

| Gastroenterology Research, ISSN 1918-2805 print, 1918-2813 online, Open Access |
| Article copyright, the authors; Journal compilation copyright, Gastroenterol Res and Elmer Press Inc |
| Journal website https://www.gastrores.org |
Review
Volume 13, Number 6, December 2020, pages 233-245
Dietary Iron Intakes in Men in Europe Are Distinctly Above the Recommendations: A Review of 39 National Studies From 20 Countries in the Period 1995 - 2016
Nils Thorm Milman
Department of Clinical Biochemistry, Naestved Hospital, University College Zealand, DK-4700 Naestved, Denmark
Manuscript submitted November 24, 2020, accepted December 8, 2020, published online December 23, 2020
Short title: Dietary Iron Intake in Men in Europe
doi: https://doi.org/10.14740/gr1344
| Abstract | ▴Top |
The objective of this review was to assess whether dietary iron intake in men in Europe is in symphony with the dietary recommendations. A literature search of national dietary surveys reporting the intake of iron using PubMed, Google Scholar, National Nutrient Databases and previous literature on dietary reviews was performed. The subjects were men aged 18 - 70 years. A total of 39 national dietary surveys in 20 European countries in the period 1995 - 2016 were included. There were considerable differences between median/mean iron dietary intake in the 20 countries. Seven countries/regions, UK-Northern Ireland, UK-Wales, Sweden, Belgium, UK-Scotland, UK-England and Serbia reported median/mean iron intake ranging from 10.5 to 11.6 mg/day. Ten countries, Norway, Finland, Lithuania, Italy, Hungary, Portugal, The Netherlands, Denmark, Iceland and Austria reported iron intake from 12.0 to 13.5 mg/day. France, Germany, Ireland and Spain reported iron intake from 14.8 to 16.0 mg/day, while Poland and Slovakia reported the highest intake of 17.2 and 22.7 mg/day. In surveys from France and The Netherlands, intake of heme iron constituted 11% of total dietary iron intake. Nutrient density for iron, reported in five countries, varied from median 11.6 mg iron/10 MJ in Denmark to 16.0 in France. In all countries, the majority of men had a dietary iron intake markedly above a recommended intake of 9 mg/day. In Europe, 75-87% of men have a dietary iron intake above 9 mg/day. A high iron intake together with relatively high intakes of meat and alcohol contributes to a high iron status and a high frequency of body iron overload in many men. We need consensus on common European standardized dietary methods, uniform dietary reference values and uniform statistical methods to perform inter-country comparisons.
Keywords: Europe; Iron, dietary; Men
| Introduction | ▴Top |
Iron is an essential mineral, which is necessary for many vital functions in the human body [1], acting as cofactor in a plethora of metabolic activities, e.g., DNA synthesis and repair [2].
In healthy humans, the body iron content is generated by gastrointestinal absorption of dietary iron [1], which is a complex process involving multiple both dietary and systemic factors [3, 4].
Body iron losses consist of basal (obligatory) losses, which are quite similar in men and women, being approximately 0.8 - 1.0 mg iron/day [1]. In contrast to women in the reproductive age, men are not exposed to extra iron losses associated with menstruations and pregnancies [5, 6]. In recent papers, the author has reviewed the dietary iron intake in women of reproductive age and in postmenopausal women [7] as well as in pregnant women [8] in Europe.
The World Health Organization’s (WHO) report on the global prevalence of anemia [9] reports the frequency of anemia among women, but not among men, in the European region. It is probably assumed that anemia and especially iron deficiency anemia in men is not a significant health problem.
However, both iron deficiency [10] and iron overload [11, 12] will affect body functions in negative ways and impair quality of life and survival.
The low physiological iron losses in men do not pose any high demands on dietary intake and iron absorption, which basically is dependent on the quantitative and qualitative intake of iron in the diet. In general, men of Western European descent do not face the problems of iron depletion and iron deficiency but rather cope with problems associated with the consequences of surplus body iron [11-14]. The frequency of high body iron reserves in men increases with age and is found in 15-20% of Danish men aged 50 - 60 years [13, 14]. The question is, to which extent habitual dietary iron intake may contribute to the occurrence of iron overload? Is dietary iron intake in European men in symphony with the national dietary recommendations? Or is it lower or higher than the recommendations?
To the knowledge of the author, there exists no previous overview focused on the dietary iron intake in men in the European countries. Therefore, the objective of this paper is to provide a review of national surveys assessing dietary iron intake in men in European countries, and to address to which degree dietary iron intake is in accordance with the recommended intake (RI) and the estimated average requirement (AR).
| Methods | ▴Top |
Literature searches were performed in PubMed, Google Chrome and Google Scholar applying the MeSH terms “dietary survey in…name of country”, “dietary iron intake” “iron intake” and “dietary iron intake in… name of country”. Search was performed for all the 37 European countries shown in Table 1. The search also included studies cited in “The European Nutrition and Health Report” 2009 [15], the review paper “Mapping Low Intake of Micronutrients Across Europe” 2013 [16], studies from “The European Food Safety Authority (EFSA): Scientific Opinion on Dietary Reference Values for Iron” 2015 [17] and the review paper “National Nutrition Surveys in Europe: a Review on the Current Status in the 53 Countries of the WHO European Region” 2018 [18].
 Click to view | Table 1. The 37 European Countries Investigated in This Review of National Nutrition Surveys of Dietary Iron Intake in Men |
Only surveys reporting the intake of dietary iron per se, i.e., without supplementary iron, were included in this review. Several countries, e.g., Bulgaria, Estonia, Romania, Greece and Switzerland had performed national dietary surveys, which did not include the intake of micronutrients and iron.
Only nationwide surveys sampling populations from the entire country were included. None of the identified surveys had used food frequency questionnaires for dietary data collection.
Several national institutes of health and nutrition as well as key opinion persons were contacted by email to obtain information about dietary iron intake. The outcome is shown in Table 1.
In the statistical interpretation of the results, it is important to consider the overall distribution of dietary iron intake when evaluating the prevalence of an inadequate iron intake. If the distribution is normal, it is relatively simple to calculate and define inadequacy using parametric statistics with arithmetic mean and standard deviation (SD). In case of an asymmetric distribution skewed to the right, with a higher frequency of low values, the median is lower than the arithmetic mean. Therefore, using the arithmetic mean in skewed data will tend to underestimate the prevalence of inadequacy and non-parametric statistics should be used instead.
| Results | ▴Top |
Most surveys were reported in English language and those reports published in other languages were translated into English using Google Translate.
An overview of the 39 included European surveys on dietary iron intake in men performed in 20 countries during the period 1995 - 2016 is shown in Table 2 [16, 19-54].
Click to view | Table 2. National Nutrition Surveys Quoting Dietary Iron Intake in Men in 20 European Countries in the Period 1995 - 2016 |
The most frequent age interval for men participating in the dietary surveys was from 18 or 19 years to 64 or 65 years used in 19/39 studies (49%). The age intervals in the other surveys ranged from 18 to 80 years (Table 2).
The dietary methods varied between the surveys (Table 2). The most frequent method was food diary records for 2 - 7 days (22/39 surveys, 56%) followed by 24-h dietary recall 1 - 3 times (14/39 surveys, 36%) and dietary history interview in the surveys from Germany (3/39 surveys, 8%). A single 24-h dietary recall was used in four studies and 24-h dietary recall for 2 - 3 times in 10 studies.
The food composition tables used to calculate dietary iron intake were in most countries based on national nutrient databases. The Baltic Republics used Russian-based food composition tables from the early 1980s and some of the East European countries used USA-based food composition tables, which were adapted for national use.
In the statistical handling of the data, most of the studies used unweighted population data, while 18/39 (46%) studies used weighted data in order to adjust the study sample for the age and gender composition of the total population in the entire country.
Dietary intake of heme iron was reported in the French SU.VI.MAX survey [27]. Heme iron in percent of total iron intake in men constituted a geometric mean or median of 11% with 5 - 95 percentiles of 4-28% [27]. In the Dutch DNFCS survey [41], the median intake of heme iron in men was 11% with 5-95 percentiles of 8-14%.
In the Irish NSIFCS survey [36], in men, on the average 20.2% of dietary iron (non-heme, plus heme iron) came from meat and meat products, the corresponding figure in women being 15.6% [36]. In the Spanish ANIBES survey [48], in men, on the average 22.9% and 5.7% of dietary iron intake was derived from consumption of meat and fish, respectively.
In the Spanish ENIDE survey [47], in the entire series of men and women (n = 2,998), 16% and 19% of dietary iron intake came from meat and fish, respectively. The Norwegian NORKOST 3 survey [42] reported that in the entire series of men and women (n = 1,787), 20% and 2% of total iron intake was derived from consumption of meat and fish, respectively, and the Irish NANS survey [37] stated that in the entire series of men and women (n = 2,651), 18% of dietary iron intake came from meats.
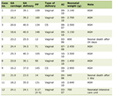
Nutrient density is the content of a food component per unit of energy. Nutrient density in men for iron in mg per 10 MJ was reported from the five countries shown in Table 3 [25-27, 36, 49]. The median or mean nutrient density varied from 11.6 mg/10 MJ in Denmark [25] to 16.0 mg/10 MJ in France [27].
Click to view | Table 3. Association Between Nutrient Density for Iron and Dietary Iron Intake in Men in the Three Nordic Countries Denmark, Sweden, Finland and in France |
The most recent and largest studies from the 20 European countries arranged according to the magnitude of median or mean dietary iron intake are shown in Table 4 [16, 21, 23, 25, 26, 28, 31, 34, 35, 37-39, 41-43, 45-47, 49-53].
Click to view | Table 4. Dietary Iron Intake in Men in 20 European Countries, Arranged According to Median/Arithmetic Mean Iron Intake |
There were considerable differences between the reported median or mean iron dietary intake in the various countries. Seven countries/regions, UK-Northern Ireland, UK-Wales, Sweden, Belgium, Scotland, UK-England and Serbia reported median/mean iron intake ranging from 10.5 to 11.6 mg/day.
Ten countries, Norway, Finland, Lithuania, Italy, Hungary, Portugal, Netherlands, Denmark, Iceland and Austria reported iron intake from 12.0 to 13.5 mg/day. France, Germany, Ireland and Spain reported iron intake from 14.8 to 16.0 mg/day, while Poland and Slovakia reported the highest intake of 17.2 and 22.7 mg/day. The “estimated” median value of the reported median/mean dietary iron intake in all the countries shown in Table 4 was 12.6 mg/day.
The median/mean iron intake in percent above RI is shown in Tables 2 and 4. In all countries, median/mean intake was 20-98% higher than the country-specific RI, with an “estimated median” of 35% (Table 4). When a common RI of 9 mg/day is applied, median/mean intake was 17-152% higher than RI, with an “estimated median” of 36%. From a statistical point of view, a median/mean iron intake well above RI indicates that considerably more than 50% of the men have an intake above the RI.
The percent of men having an iron intake below RI were specifically stated in three surveys. In Austria, 25% had an intake less than reference nutrient intake (RNI) (10 mg/day) [21], in Belgium, 25% had an intake < RI (9 mg/day) [23] and in Germany 14% had an intake less than recommended dietary allowance (RDA) (10 mg/day) [31]; these figures suggest that in most surveys more than 75% of men had an iron intake above RI.
The estimated AR is the level of daily nutrient intake that is adequate for half of the people in a population group, provided a normal distribution of requirement [55]. Using an estimated AR of 6.4 mg/day for dietary iron intake in men, it is evident the vast majority of men in all countries had an intake above AR; median/mean intake was 64-255% above AR with an “estimated” median of 91%.
Iron intake below AR was specifically stated in three surveys. In Poland 2% had an intake < AR (6.7 mg/day) [16], in Portugal 0.8% had an intake < AR (6 mg/day) [43] and in Serbia 13% had an intake < AR (6.7 mg/day) [44] (Table 2); correspondingly, 98%, 99.2% and 87% of men, respectively had an iron intake above AR [16, 43, 44].
In the various surveys, there was poor consistency in the terminology and use of dietary reference values (DRVs) for dietary iron intake. The DRVs comprised RI, RNI, RDA, dietary reference intake (DRI) or lowest recommended nutrient intake (LNRI). None used the term “population reference intake” proposed by EFSA [55] and only 12/39 (31%) surveys reported the country-specific AR. Several surveys referred to national DRV/RI/RNI/RDAs but without quoting the country-specific values. However, the daily recommended intake of dietary iron by the country-specific National Nutrition Boards in men was quite similar in most countries (Table 2). All surveys yielding information about RI recommended an RI/RNI/RDA between 8.7 and 10.0 mg iron/day.
| Discussion | ▴Top |
The European Food Consumption Survey Method (EFCOSUM) group concluded that “the most suitable method to get internationally comparable new data on population means and distributions of actual intake is 24-h recall, to be conducted at least twice” [56]. Nearly all the surveys in this review fulfilled these criteria. Repeated 24-h dietary recalls were used in 26% of the surveys, only four used a single 24-h dietary recall; 56% of the surveys used repeated food diary records. Therefore, comparison of results between countries should be possible with a reasonable reliability.
However, a study comparing two 24-h dietary recalls with 5 days food records found that in both methods, about 35% of participants had ratios of energy intake/total energy expenditure above or below the 95% confidence interval (CI), suggesting misreporting of energy intake [57]. Significant differences between the two dietary methods were found for energy, fat, alcohol, vitamin C, some vitamin Bs and iron. In general, intakes from 24-h dietary recalls, including iron, were higher compared to food records and the correlation coefficient (rs = 0.47) for iron intake in men between the two methods was significant, but not impressive [57].
The German surveys [29-31] used a dietary history interview covering the recent 4-week period, resembling a food frequency questionnaire interview; a validation study showed that these results are not directly comparable with those from food dietary records and 24-h dietary recalls [58]. Food frequency questionnaires tend to estimate higher intakes for most nutrients compared to the 24-h dietary recall method [7, 59]. However, as these [29-31] appeared to be the only national food surveys in Germany, the author decided to include them.
The calculation of dietary intake of micronutrients including iron is dependent on the quality and representativeness of the food composition tables. The food composition tables used to calculate dietary iron intake are in most countries based on national food databases and the food composition could therefore vary between countries due to the different methodologies used in the analyses of the various food items and in the sampling of food items. As an example, the Baltic Republics used elderly Russian food composition tables and some eastern European countries used food databases from USA, which were “adapted to regional conditions”. However, since the previous dietary iron review in women in Europe [6], it appears that an increasing number of European countries have established national food composition tables.
Food composition tables reflect the composition of the most common staple foods available in a specific country. Usually, mandatory fortification of foods is included in the food composition tables, whereas optional fortification is not. In some countries, there exist foods, which are iron-fortified on a voluntary basis, and this iron will not be included in the food composition tables. Iron fortified foods will contribute to a higher iron nutrient density and consequently to a higher dietary iron intake.
Adding vitamins and minerals to food is permitted in the European Union [60]. Within the European Union legislation, European countries have chosen different recommendations concerning iron fortification of foods. According to the Food Fortification Initiative, among the countries included in this review, only UK has mandatory iron fortification of wheat flour [61]. In UK fortification of wheat flour with iron has been practiced since the 1940s and the present recommendation is that the iron content must not be less than 16.5 mg/kg flour, while no upper limit is specified [62]. Additionally, in UK, there is mandatory fortification of all flours with calcium (2,350 - 3,900 mg calcium/kg flour) [62], a special combination, as calcium is an inhibitor of iron absorption [4, 63]. Denmark had mandatory fortification of flour with iron from 1954 to 1987 (30 mg elemental iron as carbonyl iron/kg flour). The general effect of mandatory iron fortification in Europe has not been systematically evaluated. However, in Denmark, from 1984 to 1994, body iron status (i.e., serum ferritin) and the prevalence of iron overload in both men [14] and postmenopausal women [64] increased significantly, while iron status was unchanged in premenopausal women [64]. These population changes in iron status occurred despite the abolition of iron fortification in 1987, suggesting a negligible effect of this specific form of fortification [14, 64].
In many countries, especially in UK and Ireland, but also including Denmark, it is permitted to fortify breakfast cereals with iron on an optional basis [65]. According to the British National Diet and Nutrition Surveys [53, 54] mandatory and optional fortification contribute to approximately 20% of the average iron intake of British adults.
As seen in Table 2, the dietary iron intake expressed as the median was consistently lower than the arithmetic mean. This indicates than iron intake in the male populations, like in the female populations [7] does not follow a normal distribution. In men, the distribution of iron intake is skewed to the right just like the distribution of the iron status biomarker serum ferritin in the population surveys of Danish men [13, 14].
Therefore, the distribution of iron intake would be better described with non-parametric statistics as median and 2.5 - 97.5 or 5 - 95 percentiles or as geometric mean and SD. Geometric mean ± SD is calculated as the mean ± SD of log10 values of iron intake. In distributions skewed to the right, the geometric mean value is close to the median value. Among the surveys 21/39 (54%) quoted the median and percentiles, none used geometric mean values. The inconsistency of the used statistical methods may to some degree impede direct comparison of the results of different surveys.
Only few of the national dietary surveys did correct for under-reporting of energy intake [66]. Under-reporting is assumed to be present in 20-30% of the participants, especially in women and obese persons [67] and appears to be less frequent in men than women [67]. Under-reporting means that the lowest percentiles for dietary iron intake should be taken with considerable reservation. Under-reporting is a confounding factor and a limitation of self-reported dietary intake [67]. Various levels of under-reporting in the different studies may contribute to the different results concerning dietary iron intake. Correcting for under-reporting will push the population mean and median intakes upwards but could be necessary to get a more accurate picture of intakes in a population.
There were marked differences between median/mean dietary iron intake in the various countries, ranging from 10.5 mg/day in UK-Northern Ireland to 22.7 mg/day in Slovakia. In all countries, median/mean iron intake was above 9 mg/day, indicating that more than 50% of the men had a dietary iron intake above 9 mg/day (Tables 2 and 3). However, there were no consistent differences between dietary iron intake across the different European regions (Western, Middle and Eastern Europe).
The country-specific RI for dietary iron was quite similar in the various countries ranging from 8 mg/day in Serbia [45] to 10 mg/day in many countries and the AR ranging from 6 to 7 mg/day (Table 2). The recommendations for dietary iron intake from different institutions in Europe and USA are listed in Table 5 [17, 68-75]. According to the most recent European recommendations for dietary iron intake in men from the Nordic Nutrition Recommendations (NNF) [70], EFSA [17, 75] and the Scientific Advisory Committee on Nutrition in UK (SACN) [72, 73], the RNI is ranging from 8.7 to 11 mg/day and the AR from 6 to 7 mg/day (Table 5). In order to make an estimated comparison between countries, the author has chosen to apply a “common” RI for iron of 9.0 mg/day and a “common” AR of 6.4 mg/day in this review.
Click to view | Table 5. RNI and AR for Dietary Iron in Men 18 - 70 Years Old in Europe and USA |
RI/RNI/RDA is used for assessment of the individual’s daily intake, while the estimated AR is the daily level of intake that is adequate for 50% of the individuals in a population group [17, 75]. From this aspect, AR is an important DRV in population surveys [17, 75].
When the median/mean iron intake in a population is well above AR and RI, then more than 50% of the men will be meeting and even exceeding their requirements. The higher above the AR/RI the intake is, the greater the proportion of men that will exceed their requirements. This assumption is valid in populations where nutrient requirements display a normal distribution.
The variations in dietary iron intake are the resultant of different factors, of which the nutrient density for iron is important. Dietary iron intake in women is closely associated with nutrient density for iron [7]. In men, the association is less pronounced, probably due to the low number of reported values (Table 3). The nutrient density for iron is dependent on the dietary habits, which differ from country to country, especially concerning the intake of meat, poultry and fish, which contain easily absorbed heme iron vs. intake of foods containing non-heme iron, which has a lower absorption ratio. Nutrient density is also influenced by mandatory and/or optional fortification of various food items.
Nutrient density for iron in men in Europe varied from 11.8 to 16.0 mg iron/10 MJ with an “estimated median” of 12.7 mg/10 MJ (Table 3), while women in the same surveys displayed a slightly higher nutrient density with an “estimated median” of 13.5 mg/10 MJ. From the previous review [7], it appears that women in Europe apparently consume a food with a higher nutrient density than men, varying from 11.8 to 23.0 mg/10 MJ with an “estimated median” of 14.1 mg/10 MJ [7]. This is somewhat surprising because women have a lower intake of meat than men as shown in Table 6 [25, 26, 28, 36, 49, 76]. Possibly the higher nutrient density in women could be caused by a higher intake of iron-containing cereals and vegetables than in men. The results of the surveys also showed that, in general, men had a significantly higher energy intake, a higher meat intake and a higher alcohol consumption than women [25, 26, 28, 36, 49, 76], factors which increase iron intake, especially of heme iron as well as iron absorption in general [3]; examples are shown in Table 6.
Click to view | Table 6. Intake of Energy, Meat and Alcohol in Men and Women (Arithmetic Mean ± Standard Deviation) in Five European National Dietary Surveys |
In men, the intake of heme iron in percent of total dietary iron intake was median 11.3-11.0% [27, 41] with 5 - 95 percentiles of 4-28% [27] and 9-16% [41]. Accordingly, due to the lower consumption of meat, heme iron intake in women was lower, ranging from 9.1% to 10.2% [27, 41] with 5 - 95 percentiles of 3-27% [27].
Overall, the percent intake of easily absorbed iron from meat and meat products in men was on the average 20-23% [36, 48]. Other surveys reported that in the entire series of men and women, on the average about 18-20% of total dietary iron came from meats [37, 42, 47].
The basal or obligatory daily iron losses in men and women occur from the skin, hair, sweat, urine and feces [77]. As reported in the study of Green et al in 1968 [77], measured by an isotope dilution method in 12 white US men, basal iron losses amount 0.012 - 0.014 mg iron/kg/day in a 70-kg man with a normal iron balance, corresponding to arithmetic mean losses of 0.95 ± 0.30 (SD) mg/day [77]. These results have been the principal basis for factorial estimations of dietary iron requirements and recommendations for men from the majority of the institutions cited in Table 5 [68-75] and using assumed iron absorption rates of 15-18% to convert the physiological requirements into dietary requirements.
The EFSA papers on the DRVs for iron [17, 75] used the individual data on basal iron losses from the isotope dilution study performed in 29 men (ethnicity not stated) in North Dakota by Hunt et al in 2009 [78]. They reported slightly higher values for iron excretion, compared to the study of Green et al [77]. The basal iron losses were arithmetic mean 1.07 ± 0.47 (SD) mg/day with a median of 1.18 mg/day (range 0.11 - 2.07 mg/day) and 90, 95 and 97.5 percentiles of 1.48, 1.61 and 1.72 mg/day, respectively [78]. Using an assumed iron absorption of 16% to convert the physiological requirements into dietary requirements resulted in a calculated median dietary requirement of 5.9 mg/day with a 97.5 percentile of 10.8 mg/day [17, 75].
The results of this review show that in general, men in Europe have a quantitative and qualitative (meats, heme iron) dietary iron intake, which in the majority of men is adequate to compensate for basal iron losses and fulfill the recommended requirements, and in a considerable fraction of the men even exceeds the RI. These findings are reflected in the few studies of iron status performed in men in Europe; as an example, in Danish men 40 - 70 years of age (non-blood donors, n = 1,103), 0.4% had iron depletion (serum ferritin < 15 µg/L), 1.5% had small iron reserves (ferritin 15 - 30 µg/L), 79.2% had an adequate iron status and 18.9% had ferritin > 300 µg/L, indicating body iron overload [14]. The dietary iron intake was associated with dietary energy intake, as serum ferritin displayed a positive correlation with body mass index (P < 0.0001) [14]. Likewise, the significant influence of alcohol on dietary iron absorption was confirmed by the positive correlation between ferritin and the amount of alcohol consumed (P < 0.0001) [14].
The high prevalence of body iron overload in men is probably also associated with the high frequency of the genetic hemochromatosis mutations C282Y, H63D and S65C on the HFE-gene in the ethnic Northern European populations [11, 12]. Approximately 15-18% of the population is heterozygous for one of the mutations and approximately 0.4-0.8% are homozygous or compound heterozygous [11, 12].
In women of reproductive age, the situation concerning body iron status is reversed compared to men [79]. A recent review of body iron status in women of reproductive age in Europe showed that approximately 40-55% had small or absent body iron reserves (serum ferritin ≤ 30 µg/L). The prevalence of iron deficiency was 10-32% and of iron deficiency anemia 2-5% [79].
Limitations of this review
This review has several limitations, due to the heterogeneous methods used in the surveys. The age groups and the dietary methods differed between surveys, statistical methods were different, most surveys used parametric, and some non-parametric statistics, most surveys used unweighted, and some weighted data, few surveys had corrected for underreporting, and furthermore, there was an inconsistent terminology regarding the use of DRVs of dietary iron. These factors make it difficult to directly compare the results of the various surveys. Furthermore, the contribution of optional food iron fortification was not evaluated in the surveys and the country-specific food composition tables were not standardized.
| Conclusions | ▴Top |
This review demonstrates that in Europe, a high proportion of men have a dietary iron intake equal to or above an AR of 6.4 mg/day and an RI of 9 mg/day. The quantitative and qualitative high iron intake contributes to an adequate body iron status in the majority of men. However, in an appreciable fraction of men, approximately 15-20% [13, 14], iron intake exceeds RI to such a degree that they over time may develop body iron overload. Mutations on the HFE-hemochromatosis gene are frequent in European men [11, 12] and will contribute to an increased iron absorption and predispose to iron overload.
In European countries and within the European Union, there is still a need for development and implementation of common standardized dietary methods [56, 57] and for standardization of food composition tables as introduced by EFSA [80]. It is also important to obtain consensus on the use of the different DRVs [75] and to agree on the use of uniform statistical methods in order to obtain reliable inter-country comparisons of dietary intakes of both macro- and micronutrients.
Acknowledgments
The author thanks Librarian, MSc in Library and Scientific Information Technology, Henrik Tvermoes at the Library of Aarhus University, Denmark, for valuable help in providing essential references in this paper.
Financial Disclosure
This research was supported by an unrestricted grant from Pharmovital ApS, Rosenkaeret 11B, DK-2860 Soeborg, Denmark.
Conflict of Interest
The author declares no conflict of interest.
Informed Consent
Not applicable.
Author Contributions
NT Milman performed the literature search and wrote the manuscript.
Data Availability
This review is based on literature searches in the PubMed and Google Scholar databases as well as literature references cited in published articles and review papers. The data used to support the findings of this study are included within the article.
| References | ▴Top |
- Anderson GJ, Frazer DM. Current understanding of iron homeostasis. Am J Clin Nutr. 2017;106(Suppl 6):1559S-1566S.
doi pubmed - Puig S, Ramos-Alonso L, Romero AM, Martinez-Pastor MT. The elemental role of iron in DNA synthesis and repair. Metallomics. 2017;9(11):1483-1500.
doi pubmed - Sharp PA. Intestinal iron absorption: regulation by dietary & systemic factors. Int J Vitam Nutr Res. 2010;80(4-5):231-242.
doi pubmed - Milman NT. A review of nutrients and compounds, which promote or inhibit intestinal iron absorption: making a platform for dietary measures that can reduce iron uptake in patients with genetic haemochromatosis. J Nutr Metab. 2020;2020:7373498.
doi pubmed - Milman N, Rosdahl N, Lyhne N, Jorgensen T, Graudal N. Iron status in Danish women aged 35-65 years. Relation to menstruation and method of contraception. Acta Obstet Gynecol Scand. 1993;72(8):601-605.
doi pubmed - Milman N, Kirchhoff M, Jorgensen T. Iron status markers, serum ferritin and hemoglobin in 1359 Danish women in relation to menstruation, hormonal contraception, parity, and postmenopausal hormone treatment. Ann Hematol. 1992;65(2):96-102.
doi pubmed - Milman NT. Dietary Iron Intake in Women of Reproductive Age in Europe: A Review of 49 Studies from 29 Countries in the Period 1993-2015. J Nutr Metab. 2019;2019:7631306.
doi pubmed - Milman NT. Dietary Iron Intake in Pregnant Women in Europe: A Review of 24 Studies from 14 Countries in the Period 1991-2014. J Nutr Metab. 2020;2020:7102190.
doi pubmed - World Health Organization. The global prevalence of anaemia in 2011. Geneva: World Health Organization 2015. http://www.who.int/nutrition/publications/micronutrients/global_prevalence_anaemia_2011/en/. Accessed October 1, 2020.
- Milman N. Anemia—still a major health problem in many parts of the world! Ann Hematol. 2011;90(4):369-377.
doi pubmed - Milman N, Pedersen P, a Steig T, Byg KE, Graudal N, Fenger K. Clinically overt hereditary hemochromatosis in Denmark 1948-1985: epidemiology, factors of significance for long-term survival, and causes of death in 179 patients. Ann Hematol. 2001;80(12):737-744.
doi pubmed - Milman NT, Schioedt FV, Junker AE, Magnussen K. Diagnosis and treatment of genetic HFE-hemochromatosis: the Danish aspect. Gastroenterology Res. 2019;12(5):221-232.
doi pubmed - Milman N, Kirchhoff M. Iron stores in 1433, 30- to 60-year-old Danish males. Evaluation by serum ferritin and haemoglobin. Scand J Clin Lab Invest. 1991;51(7):635-641.
doi pubmed - Milman N, Byg KE, Ovesen L, Kirchhoff M, Jurgensen KS. Iron status in Danish men 1984-94: a cohort comparison of changes in iron stores and the prevalence of iron deficiency and iron overload. Eur J Haematol. 2002;68(6):332-340.
doi pubmed - Elmadfa I, Meyer A, Nowak V, Hasenegger V, Putz P, Verstraeten R, Remaut-DeWinter AM, et al. European Nutrition and Health Report 2009. Forum Nutr. 2009;62:1-405.
doi - Mensink GB, Fletcher R, Gurinovic M, Huybrechts I, Lafay L, Serra-Majem L, Szponar L, et al. Mapping low intake of micronutrients across Europe. Br J Nutr. 2013;110(4):755-773.
doi pubmed - European Food Safety Authority (EFSA). EFSA panel on dietetic products, nutrition and allergies. Scientific opinion on dietary reference values for iron. EFSA Journal. 2015;13(10):4254. Appendix D., p. 71. Iron intake in males in different surveys according to age classes and country. Parma, Italy. www.efsa.europa.eu/efsajournal Accessed October 2, 2020.
doi - Rippin HL, Hutchinson J, Evans CEL, Jewell J, Breda JJ, Cade JE. National nutrition surveys in Europe: a review on the current status in the 53 countries of the WHO European region. Food Nutr Res. 2018;62.
doi pubmed - Elmadfa I, Freisling H, Nowak V, Hofstadter D, et al. Ostereichischer Enarungsbericht. Institut fur Ernahrungswissenschaften. Universitat Wien. 1. Auflage (Austrian Nutrition Report. Institute of Nutrition, University of Vienna, 1st Edition) Vienna. 2009.
- Elmadfa I. Ostereichischer Enärungsbericht, Institut fur Ernahrungswissenschaften. Universitat Wien. 1. Auflage (Austrian Nutrition Report. Institute of Nutrition, University of Vienna, 1st Edition) Vienna. 2012.
- Rust P, Hasenegger V, Konig J. Ostereichischer Enarungsbericht 2017. Department fur Ernahrungswissenschaften. Universitat Wien (Austrian Nutrition Report. Institute of Nutrition, University of Vienna) Vienna. 2017. www.bmgf.gv.at ISBN 978-3-903099-32-6.
- Devriese S, Huybrechts I, Moreau M, Van Oyen H. Belgische Voedselconsumptiepeiling 1-2004. Wetenschappelijk Instituut Volksgezondheid (The Belgian Food Consumption Survey) Scientific Institute for Public Health) WIV/EPI REPORTS N 2006. 2016.
- Teppers E. IJzer. In: Bel S, Tafforeau J (ed.). Voedselconsumptiepeiling 2014-2015. Rapport 4. WIV-ISP, Brussel, 2016.
- Danskernes Kostvaner 2003-2008. Hovedresultater. Fødevareinstituttet, Danmarks Tekniske Universitet (Dietary habits in Denmark 2003-2008. Main results. The National Food Institute, Danish Technical University). 1st ed. January 2010. ISBN: 978-87-92158-67-3. www.food.dtu.dk. Accessed October 1, 2020.
- Danskernes Kostvaner 2011-2013. Hovedresultater. Fodevareinstituttet, Danmarks Tekniske Universitet (Dietary habits in Denmark 2011-2013. Main results. The National Food Institute, Danish Technical University). 1st ed. February 2015. ISBN: 978-87-93109-39-1. www.food.dtu.dk. Accessed October 1, 2020.
- Helldan A, Kosonen M, Tapanainen H. The National FINDIET 2012 Survey. (In Finnish, summary, figures and tables in English) Helsinki: National Institute for Health and Welfare, Report No. 16, 2013.
- Galan P, Yoon HC, Preziosi P, Viteri F, Valeix P, Fieux B, Briancon S, et al. Determining factors in the iron status of adult women in the SU.VI.MAX study. SUpplementation en VItamines et Mineraux AntioXydants. Eur J Clin Nutr. 1998;52(6):383-388.
doi pubmed - Dubuisson C, Lioret S, Touvier M, Dufour A, Calamassi-Tran G, Volatier JL, Lafay L. Trends in food and nutritional intakes of French adults from 1999 to 2007: results from the INCA surveys. Br J Nutr. 2010;103(7):1035-1048.
doi pubmed - Mensink GB, Beitz R. Food and nutrient intake in East and West Germany, 8 years after the reunification—The German Nutrition Survey 1998. Eur J Clin Nutr. 2004;58(7):1000-1010.
doi pubmed - Mensink G, Burger M, Beitz R, Henschel Y, Hintzpeter B. Beitrage zur Gesundheitsberichterstattung des Bundes. Was essen wir heute? Ernahrungsverhalten in Deutschland (Contributions to health reporting in the Federal Republic of Germany. What do we eat today? Dietary behavior in Germany). Robert-Koch-Institut, Berlin. 2002.
- Nationale Verzehrsstudie II. Ergebnisbericht, Teil 2. Die bundesweite Befragung zur Ernahrung von Jugendlichen und Erwachsenen. Max-Rubner Institut. Bundesforschungsinstitut fur Ernahrung und Lebensmittel (National Food Consumption Study II. Report of Results, Part 2. The nationwide survey on the nutrition of adolescents and adults. Max-Rubner Institute. Federal Research Institute of Nutrition and Food). Karlsruhe. 2008.
doi - Biro L, Zajkas G, Greiner E, Szorad I, Varga A, Domonkos A, et al. Tapalkozasi vizsgalat Magyarorszagon 2003-2004. Mikro-tapanyagbevitel:asvanyi sok (Dietary survey in Hungary 2003-2004. Micro-nutrient intake: minerals) Orvosi Hetilap (Hung Med J). 2007;148:703-708.
doi pubmed - Lugasi A, Sarkadi NE, Zentai A, Bakacs M, Illes EBZ, Martos E. Orszagos Taplalkozas es Taplaltsagi Allapot Vizsgalat - OTAP 2009. V. A magyar lakossag mikroelem-bevitele (Hungarian Diet and Nutritional Status Survey - The OTAP 2009 study). V. Microelement intake of the Hungarian population) Orvosi Hetilap (Hung Med J). 2012;153:1177-1184.
doi pubmed - Nagy B, Nagy-Lorincz Z, Bakacs M, Sarkadi NE, Erdei G, Martos E. Orszagos Taplalkozas es Taplaltsagi Allapot Vizsgalat - OTAP 2014. IV. A magyar lakossag mikroelem-bevitele (Hungarian Diet and Nutritional Status Survey - The OTAP 2014 study. V. Microelement intake of the Hungarian population). Personal communication.
- Thorgeirsdottir H, Valgeirsdottir H, Gunnarsdottir I. National dietary survey of the Icelandic Nutrition Council 2010-2011. Main findings: Directorate of Health, Icelandic Food and Veterinary Authority and Unit for Nutrition Research, University of Iceland. 2011.
- Irish Universities Nutrition Alliance (IUNA). The North-South Ireland Food Consumption Survey, Food Safety Promotion Board, Dublin 2001. http://www.iuna.net. Accessed October 1, 2020.
- Irish Universities Nutrition Alliance (IUNA). National Adult Nutrition Survey (NANS) 2011. http://www.ucd.ie/t4cms/IUNA%20summaryreport_final.pdf. Accessed October 1, 2020.
- Sette S, Le Donne C, Piccinelli R, Arcella D, Turrini A, Leclercq C, On Behalf of the INRAN-SCAI 2005–06 Study Group. The third Italian National Food Consumption Survey, INRAN-SCAI 2005-06—part 1: nutrient intakes in Italy. Nutr Metab Cardiovasc Dis. 2011;21(12):922-932.
doi pubmed - Barzda A, Bartkeviciute R, Baltusyte I, Stukas R, Bartkeviciute S. Suaugusiu ir pagyvenusiu lietuvos gyventoju faktines mitybos ir mitybos įprociu tyrimas (Study and evaluation of actual nutrition and nutrition habits of Lithuanian adult population). Visuomenes Sveikata (People Health). 2016;72(1):85-94.
- Hulshof KFAM, Kruizinga AG. Aanvullende berekeningen met betrekking tot de consumptie van diverse zichtbare vetten en de bijdrage aan de inname van geselecteerde voedingsstoffen Voedselconsumptiepeiling 1997-1998 en tien jaar trend (Additional calculations related to the consumption of various visible fats and the contribution to the intake of selected nutrients. Food consumption survey 1997-1998 and ten year trend). TNO Voeding. TNO-rapport V.99.516. AJ Zeist, the Netherlands. 1999.
- van Rossum C, Fransen HP, Verkaik-Kloosterman J, Buurma-Rethans EJM, Ocke MC. Dutch National Food Consumption Survey 2007-2010. National Institute for Public Health and the Environment, Ministry of Health, Wellfare and Sport 2011. https://www.rivm.nl/bibliotheek/rapporten/350050006.pdf. Accessed October 1, 2020.
- Totland TH, Melnaes BK, Lundberg-Hallen N, Helland-Kigen KM, Lund-Blix NA, Myhre JB, et al. Norkost 3. En landsomfattende kostholdsundersøkelse blant menn og kvinner i Norge i alderen 18-70 ar, 2010-2011. Helsedirektoratet 2012 (A national nutrition survey among men and women in Norway in the age of 18-70 years, in the years 2010-2011. National Institute of Health 2012). www.helsedirektoratet.no. Accessed October 1, 2020.
- Lopes C, Torres D, Oliveira A, Severo M, Alarcao V, Guiomar S, et al. Inquerito Alimentar Nacional e de Atividade Fisica (IAN-AF), 2015-2016. Relatorio de resultados. University of Porto. Porto 2017. http://repositorio.insa.pt/bitstream/10400.18/5780/1/IAN-AF%20Relat%C3%B3rio%20Resultados.pdf. Accessed October 1, 2020. ISBN: 978-989-746-181-1.
- Nedeljkovic S, editor. Gurinovic M, Kadvan A. Methodology of the dietary survey in YUSAD study. (In Yugoslavian language). Study of atherosclerosis precursors in schoolchildren in Serbia: twenty years follow-up. pp. 334-342. 2011. Medical Faculty University of Belgrade. Belgrade, Serbia.
- Knez M, Nikolic M, Zekovic M, Stangoulis JC, Gurinovic M, Glibetic M. The influence of food consumption and socio-economic factors on the relationship between zinc and iron intake and status in a healthy population. Public Health Nutr. 2017;20(14):2486-2498.
doi pubmed - Babinska K, Bederova A. Changes in nutrient intake in the adult population of the Slovak Republic. J Food Compost Anal. 2002;15:359-365.
- Agencia Espanola de Seguridad Alimentaria y Nutrición (AESAN). Evaluación nutricional de la dieta española. II Micronutrientes. Sobre datos de la Encuesta Nacional de Ingesta Dietética (ENIDE). Ministerio de Sanidad, Servicios Sociales e Igualdad. Madrid 2011. https://www.laboratoriolcn.com/wp-content/uploads/2019/11/Valoracion_nutricional_ENIDE_micronutrientes.pdf Accessed 1 October 2020.
- Samaniego-Vaesken ML, Partearroyo T, Olza J, Aranceta-Bartrina J, Gil A, Gonzalez-Gross M, Ortega RM, et al. Iron intake and dietary sources in the Spanish population: findings from the ANIBES study. Nutrients. 2017;9(3):203.
doi pubmed - Riksmaten Vuxna 2010-2011. Livsmedels-och naringsintag bland vuxna i Sverige. Resultat fran matvaneundersokningen utford 2010-2011 (Food and nutrient intake in adults in Sweden 2010-2011. (In Swedish, summary, figures and tables in English) Uppsala: Livsmedelsverket (National Institute of Nutrition) 2012. ISBN 9789177142164. http://www.livsmedelsverket.se/globalassets/matvanor-halsa-miljo/kostrad-matvanor/matvaneundersokningar/riksmaten_2010_20111.pdf. Accessed October 1, 2020.
- Bates B, Lennox A, Prentice A, Bates C, Page P, Nicholson S, et al. National Diet and Nutrition Survey Rolling Programme (NDNS RP) Results from Years 1-4 (combined) for Northern Ireland (2008/09-2011/12). A survey carried out on behalf of the Food Standards Agency in Northern Ireland and Public Health England. 2015.
- Bates B, Lennox A, Prentice A, Bates C, Page P, Nicholson S, et al. National Diet and Nutrition Survey Rolling Programme (NDNS RP). Results from Years 1-4 (combined) for Scotland (2008/09-2011/12) A survey carried out on behalf of the Food Standards Agency in Scotland and Public Health England. 2015.
- Bates B, Lennox A, Prentice A, Bates C, Page P, Nicholson S, et al. National Diet and Nutrition Survey Rolling Programme (NDNS RP) Results from Years 2-5 (combined) for Wales (2009/10-2012/13) A survey carried out on behalf of the Food Standards Agency in Wales, Welsh Government and Public Health England. 2015.
- Public Health England and Food Standards Agency. National Diet and Nutrition Survey. Published 14 May 2014. Last updated February 28, 2017. https://www.gov.uk/government/statistics/national-diet-and-nutrition-survey-results-from-years-1-to-4-combined-of-the-rolling-programme-for-2008-and-2009-to-2011-and-2012. Accessed October 1, 2020.
- Public Health England and Food Standards Agency. National Diet and Nutrition Survey. Results of the National Diet and Nutrition Survey (NDNS) rolling programme for 2012 to 2013 and 2013 to 2014. Published 9 September 2016. https://www.gov.uk/government/statistics/ndns-results-from-years-5-and-6-combined. Accessed October 1, 2020.
- Scientific opinion for deriving and applying Dietary Reference Values. EFSA Panel on Dietetic Products, Nutrition and Allergies. European Food Safety Authority (EFSA) Parma, Italy. EFSA Journal 2010;8:1458. http://www.efsa.europa.eu/en/efsajournal/pub/1458.htm Accessed October 1, 2020.
doi - Brussaard JH, Lowik MR, Steingrimsdottir L, Moller A, Kearney J, De Henauw S, Becker W, et al. A European food consumption survey method—conclusions and recommendations. Eur J Clin Nutr. 2002;56(Suppl 2):89S-94S.
doi pubmed - De Keyzer W, Huybrechts I, De Vriendt V, Vandevijvere S, Slimani N, Van Oyen H, De Henauw S. Repeated 24-hour recalls versus dietary records for estimating nutrient intakes in a national food consumption survey. Food Nutr Res. 2011;55.
doi pubmed - Mensink GB, Haftenberger M, Thamm M. Validity of DISHES 98, a computerised dietary history interview: energy and macronutrient intake. Eur J Clin Nutr. 2001;55(6):409-417.
doi pubmed - Coathup V, Wheeler S, Smith L. A method comparison of a food frequency questionnaire to measure folate, choline, betaine, vitamin C and carotenoids with 24-h dietary recalls in women of reproductive age. Eur J Clin Nutr. 2016;70(3):346-351.
doi pubmed - REGULATION (EC) No 1925/2006 OF THE EUROPEAN PARLIAMENT AND OF THE COUNCIL of 20 December 2006 on the addition of vitamins and minerals and of certain other substances to foods. Official Journal of the European Union. https://eur-lex.europa.eu/legal-content/EN/TXT/?uri=CELEX:02006R1925-20190515. Accessed October 1, 2020.
- Food Fortification Initiative. Enhancing grains for healthier life. 2019 http://ffinetwork.org/regional_activity/europe.php. Accessed October 1, 2020.
- The Bread and Flour Regulations 1998 No. 141. https://www.legislation.gov.uk/uksi/1998/141/made. Accessed October 1, 2020.
- Lynch SR. The effect of calcium on iron absorption. Nutr Res Rev. 2000;13(2):141-158.
doi pubmed - Milman N, Byg KE, Ovesen L, Kirchhoff M, Jurgensen KS. Iron status in Danish women, 1984-1994: a cohort comparison of changes in iron stores and the prevalence of iron deficiency and iron overload. Eur J Haematol. 2003;71(1):51-61.
doi pubmed - Flynn A, Hirvonen T, Mensink GB, Ocke MC, Serra-Majem L, Stos K, Szponar L, et al. Intake of selected nutrients from foods, from fortification and from supplements in various European countries. Food Nutr Res. 2009;53.
doi pubmed - Becker W, Welten D. Under-reporting in dietary surveys—implications for development of food-based dietary guidelines. Public Health Nutr. 2001;4(2B):683-687.
doi pubmed - Gemming L, Jiang Y, Swinburn B, Utter J, Mhurchu CN. Under-reporting remains a key limitation of self-reported dietary intake: an analysis of the 2008/09 New Zealand Adult Nutrition Survey. Eur J Clin Nutr. 2014;68(2):259-264.
doi pubmed - Institute of Medicine. Food and Nutrition Board. Dietary reference intakes for Vitamin A, Vitamin K, Arsenic, Boron, Chromium, Copper; Iodine, Iron ect. National Academic Press. Washington DC. 2001.
- Food and Agricultural Organization of the United Nations and World Health Organization. Human vitamin and mineral requirements. Report of a joint FAO/WHO expert consultation Bangkok, Thailand. FAO Food and Nutrition Division. 2001.
- Nordic Council of Ministers. Nordic Nutrition Recommendations 2012: integrating nutrition and physical activity. Copenhagen. Nordic Council of Ministers. ISBN 978-92-893-2670-4. http://norden.diva-portal.org/smash/record.jsf?pid=diva2%3A704251&dswid=-4057. Accessed October 1, 2020.
- Department of Health (UK). The Committee on Medical Aspects of Food and Nutrition Policy (COMA). Prepared for the Department of Health by Salmon J. Dietary Reference Values - a guide. London, HSMO 1991. ISBN 0 11 3213964.
- Scientific Advisory Committee on Nutrition (SACN). Iron and Health. Published by TSO (The Stationery Office). London. 2010.
- British Nutrition Foundation. Nutrient Requirements 2019. https://www.nutrition.org.uk/attachments/article/907/Nutrition%20Requirements_Revised%20August%202019.pdf. Accessed October 1, 2020.
- Proposed nutrient and energy intakes for the European community: a report of the Scientific Committee for Food of the European community. Nutr Rev. 1993;51(7):209-212.
doi pubmed - European Food Safety Authority (EFSA). Dietary reference values for nutrients. Summary Report. Technical Report 2017.
doi - Castetbon K, Vernay M, Malon A, Salanave B, Deschamps V, Roudier C, Oleko A, et al. Dietary intake, physical activity and nutritional status in adults: the French nutrition and health survey (ENNS, 2006-2007). Br J Nutr. 2009;102(5):733-743.
doi pubmed - Green R, Charlton R, Seftel H, Bothwell T, Mayet F, Adams B, Finch C, et al. Body iron excretion in man: a collaborative study. Am J Med. 1968;45(3):336-353.
doi - Hunt JR, Zito CA, Johnson LK. Body iron excretion by healthy men and women. Am J Clin Nutr. 2009;89(6):1792-1798.
doi pubmed - Milman N, Taylor CL, Merkel J, Brannon PM. Iron status in pregnant women and women of reproductive age in Europe. Am J Clin Nutr. 2017;106(Suppl 6):1655S-1662S.
doi pubmed - European Food Safety Authority (EFSA) Food Composition Data Europe (Finland, France, Germany, Italy, Netherlands, Sweden, UK). Food Composition Tables November 2018 https://www.efsa.europa.eu/en/microstrategy/food-composition-data. Accessed October 1, 2020.
This article is distributed under the terms of the Creative Commons Attribution Non-Commercial 4.0 International License, which permits unrestricted non-commercial use, distribution, and reproduction in any medium, provided the original work is properly cited.
Gastroenterology Research is published by Elmer Press Inc.