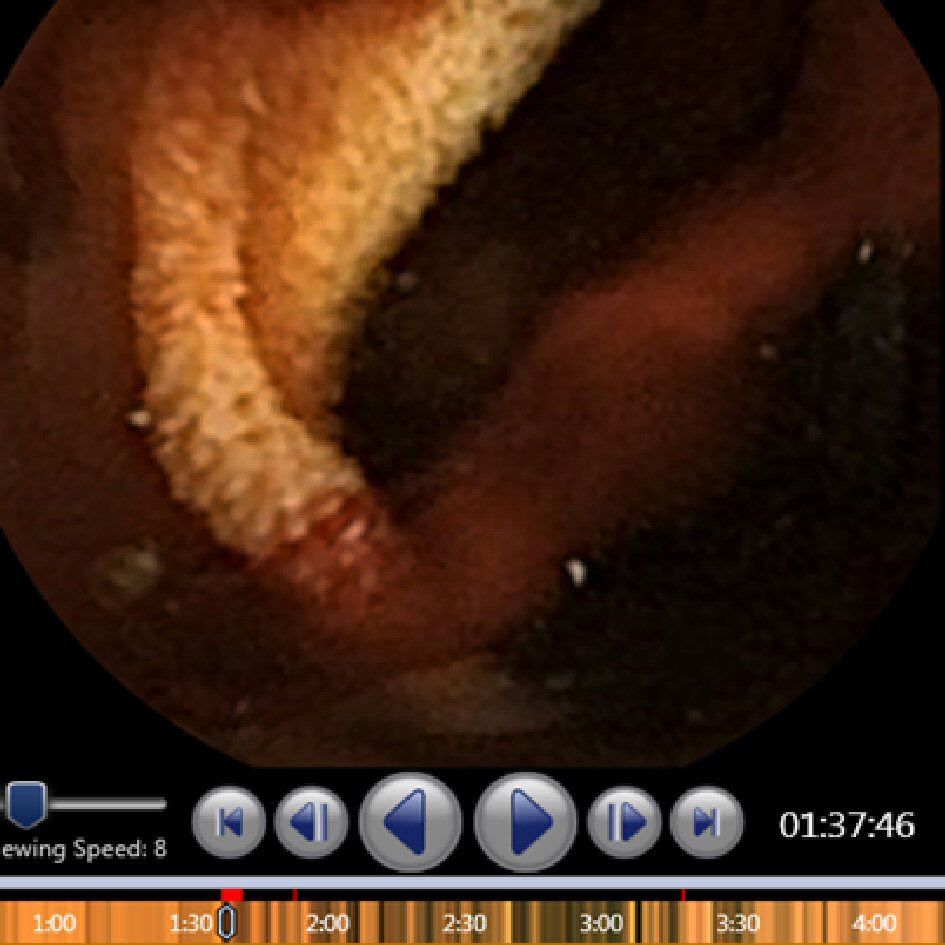
Figure 1. Example of active bleeding with suspected blood indicator markers (red bars).
| Gastroenterology Research, ISSN 1918-2805 print, 1918-2813 online, Open Access |
| Article copyright, the authors; Journal compilation copyright, Gastroenterol Res and Elmer Press Inc |
| Journal website http://www.gastrores.org |
Original Article
Volume 11, Number 2, April 2018, pages 106-111
Suspected Blood Indicator to Identify Active Gastrointestinal Bleeding: A Prospective Validation
Figures
Tables
| Categories | Active bleeding | No active bleeding | P value |
|---|---|---|---|
| Age | 68.1 ± 14.3 | 57.0 ± 18.9 | < 0 .001 |
| Male gender | 59 (51.3%) | 56 (48.7%) | 0.7 |
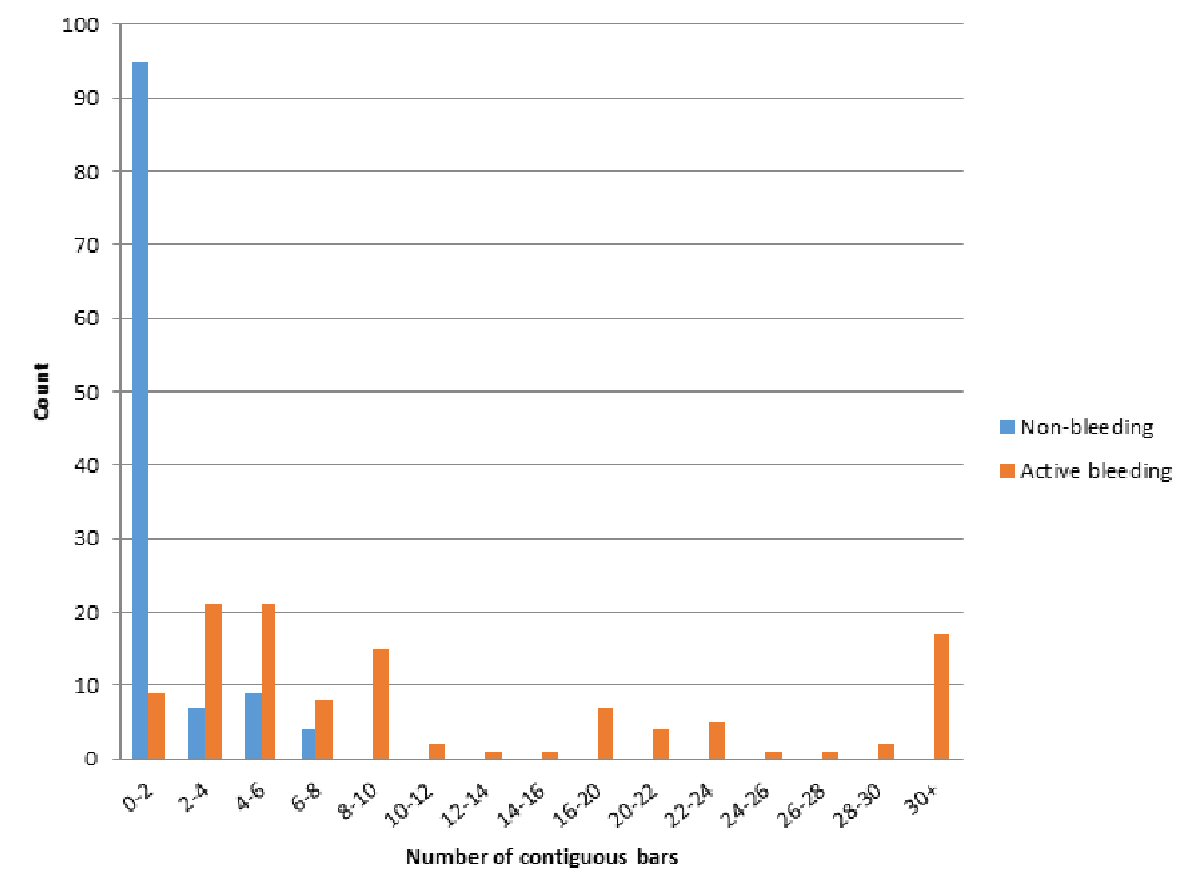
| Total number of bars | 21.2 ± 34.5 | 1.2 ± 2 | < 0.001 |
| False positive bars | 4.5 ± 5.7 | 4.3 ± 6.5 | 0.8 |
| Contiguous bars | 21.1 ± 34.3 | 1.2 ± 1.9 | < 0.001 |
| Bleeding | No bleeding | ||
|---|---|---|---|
| SBI: suspected blood indicator. | |||
| Contiguous SBI | Eight or more | 61 | 0 |
| Less than eight | 54 | 115 | |
| Total | 115 | 115 | |
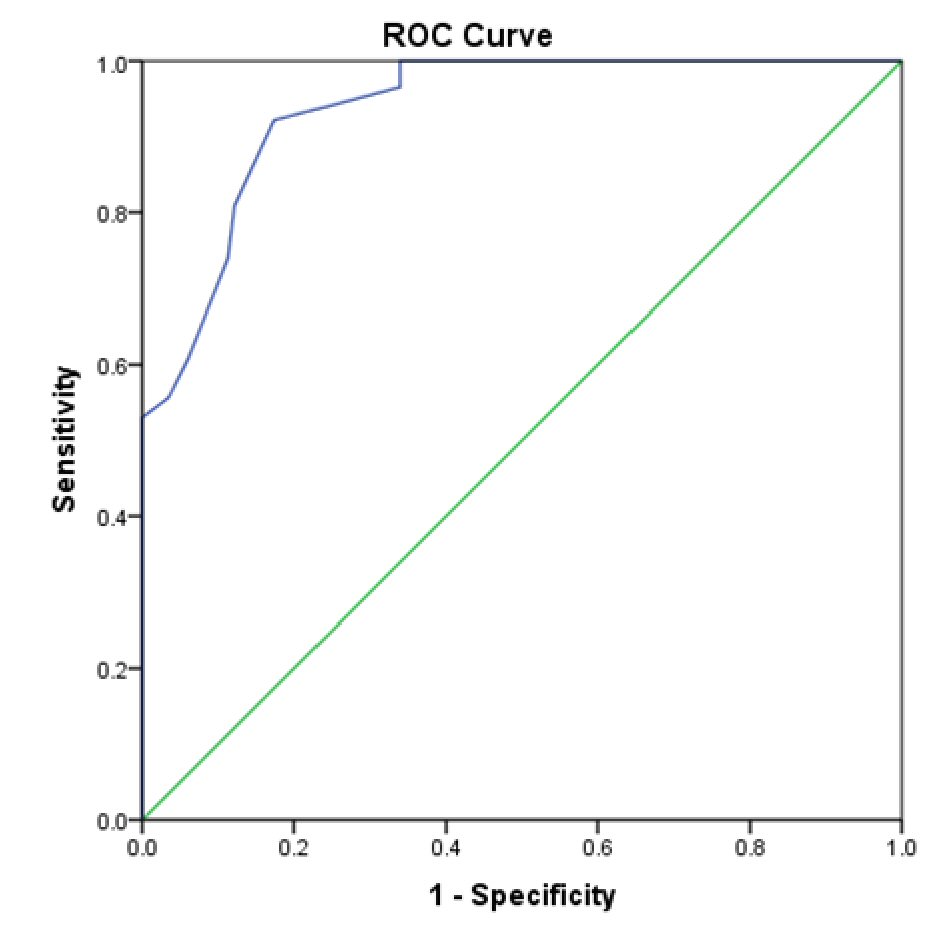
| Sensitivity | 53% | ||
| Specificity | 100% | ||
| Positive predictive value | 100% | ||
| Negative predictive value | 68.1% | ||
| Variables | Active bleeding | No active bleeding | P value |
|---|---|---|---|
| Age | 68.6 ± 15.7 | 63.7 ± 15.7 | 0.24 |
| Female gender | 12 (66.7%) | 43 (52.4%) | 0.27 |
| Total number of bars | 37 ± 31.4 | 4.9 ± 6.7 | < 0.001 |
| False positive bars | 4.5 ± 4.2 | 4.2 ± 5.9 | 0.82 |
| Contiguous bars | 32.5 ± 31.7 | 0.6 ± 1.4 | < 0.001 |
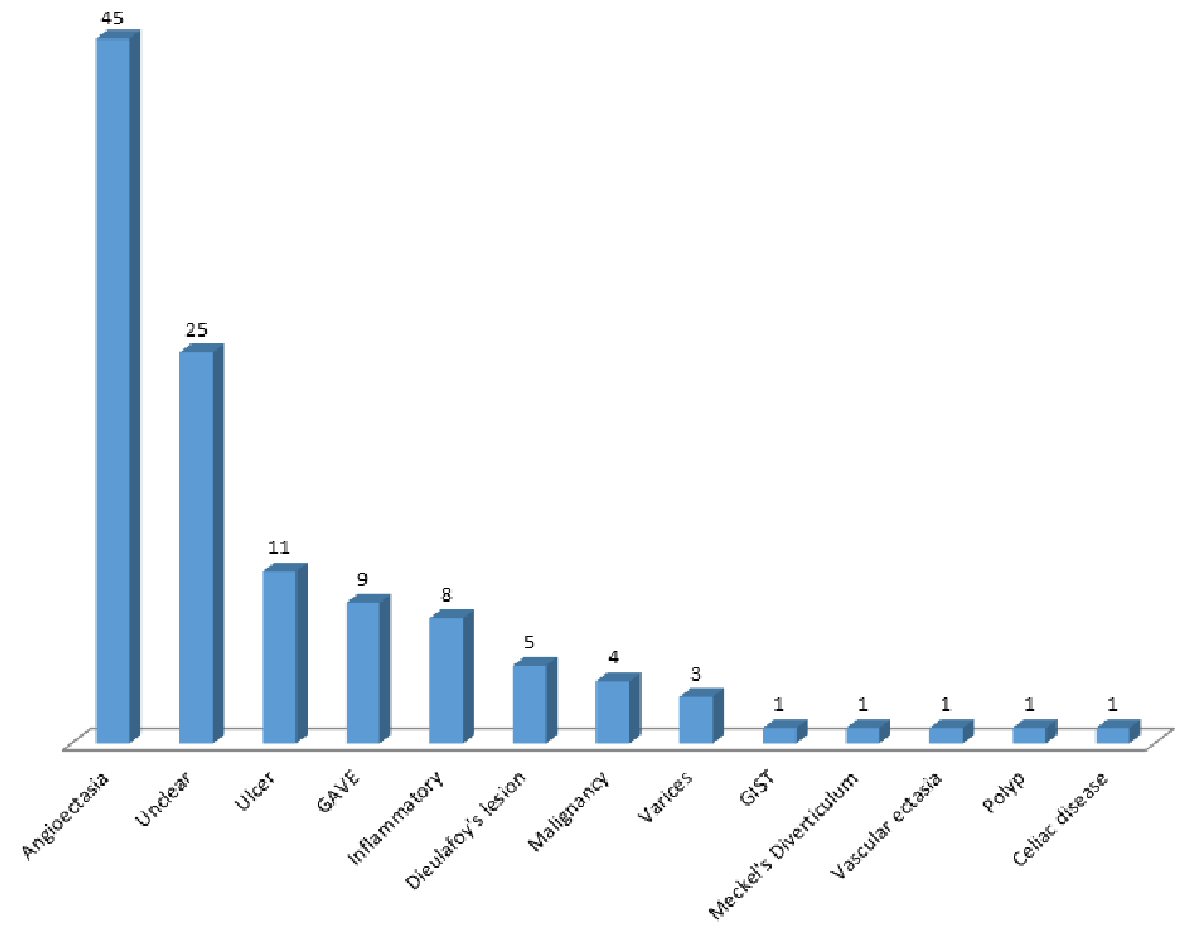
| Cause of bleeding | N (%) |
|---|---|
| Angioectasia | 7 (38.9%) |
| Peptic ulcer disease | 2 (11.1%) |
| Diverticulosis | 1 (5.6%) |
| Gastric antral vascular ectasia | 1 (5.6%) |
| Unknown | 7 (38.9%) |