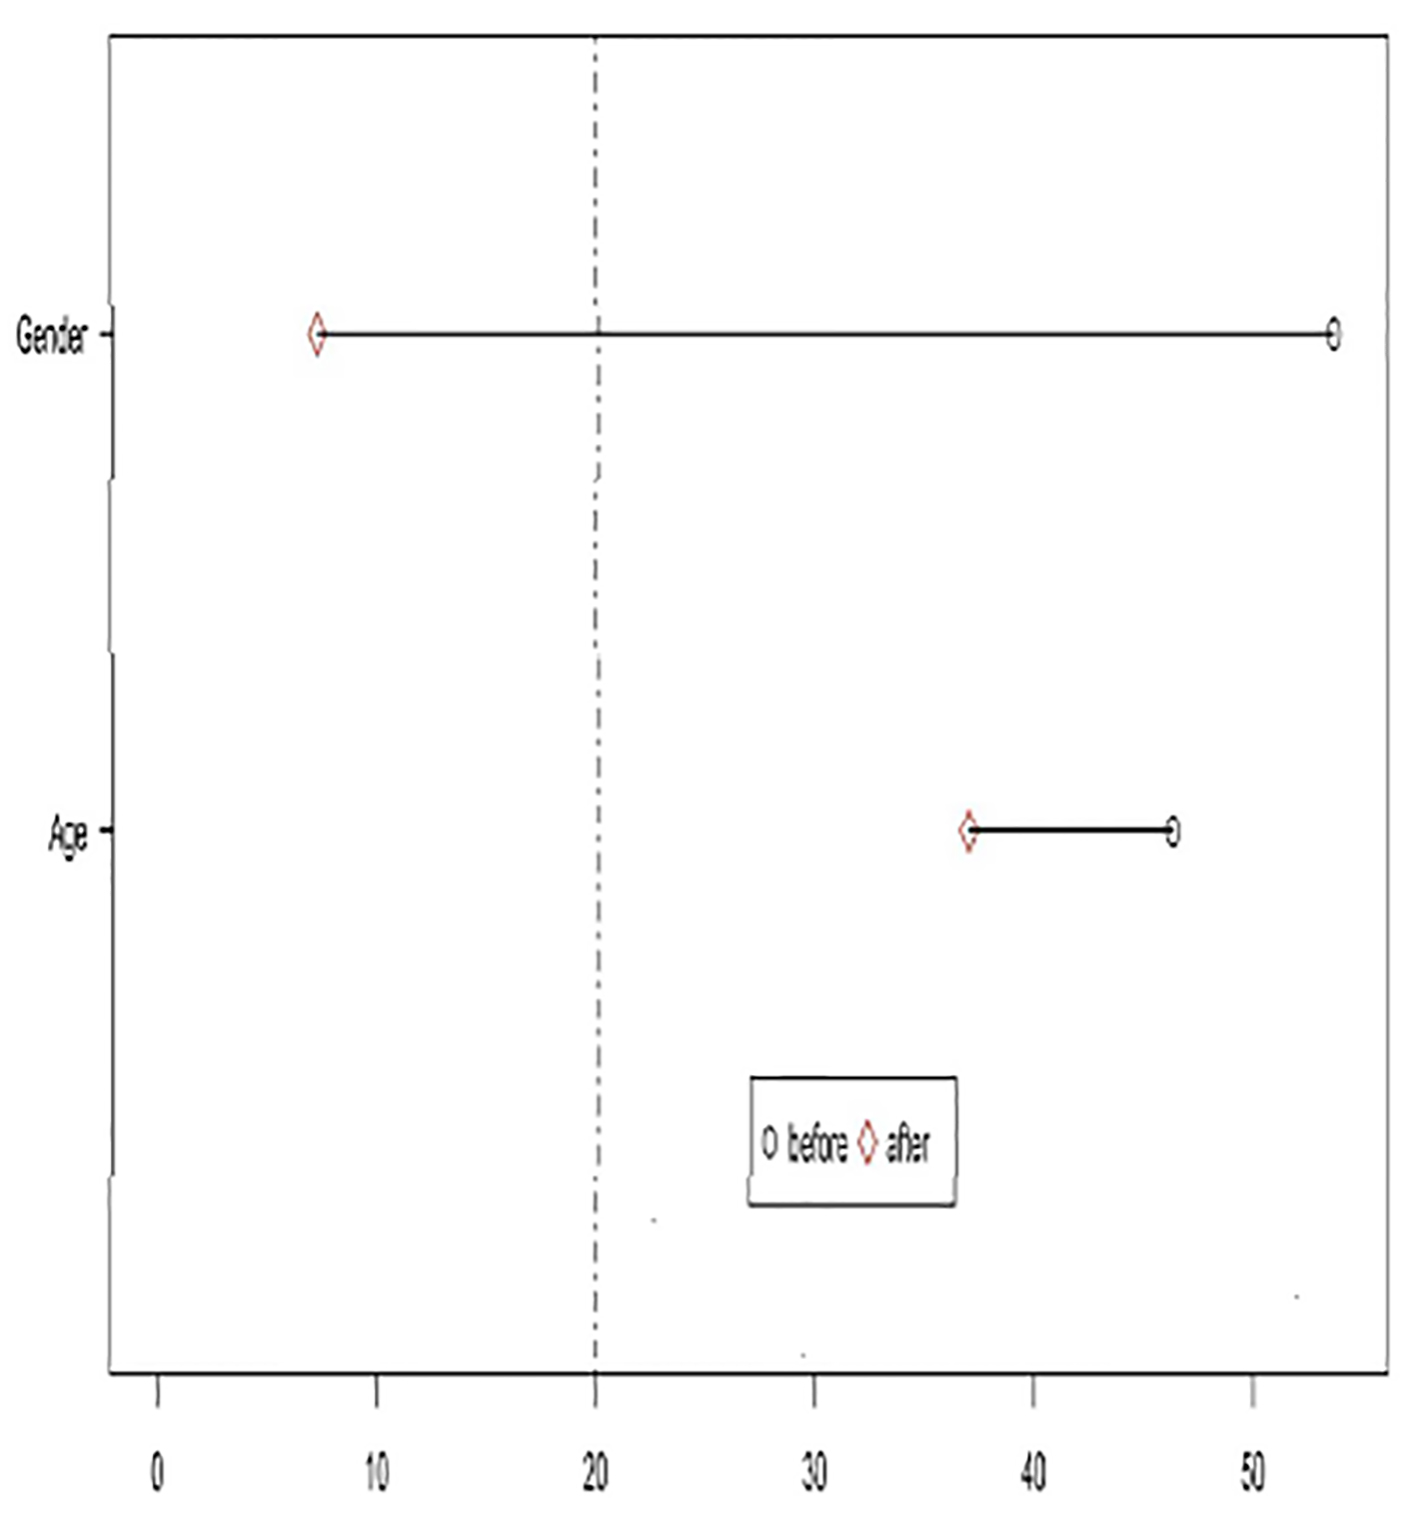
Figure 1. Testing for balance after matching.
| Gastroenterology Research, ISSN 1918-2805 print, 1918-2813 online, Open Access |
| Article copyright, the authors; Journal compilation copyright, Gastroenterol Res and Elmer Press Inc |
| Journal website http://www.gastrores.org |
Original Article
Volume 11, Number 1, February 2018, pages 18-24
Aquanet Bowel Cleansing Device Versus Oral Sodium Picosulfate for Pre-Endoscopy Bowel Preparation: Propensity Score Analysis for Interventional Effectiveness Evaluation
Figure
Tables
| Variable | Total (314) | Aquanet (157) | Sodium picosulfate (157) | P |
|---|---|---|---|---|
| Age | 54.22 ± 17.61 | 58.2 ± 16.87 | 50.24 ± 17.48 | < 0.001 |
| Gender (female) | 254 (80.9%) | 143 (91.1%) | 111 (70.7%) | < 0.001 |
| Intestinal symptoms | 0.017 | |||
| Constipated | 46 (14.6%) | 15 (9.6%) | 31 (19.7%) | |
| Normal | 268 (85.4%) | 142 (90.4%) | 126 (80.3%) |
| Variable | Total (314) | Aquanet (157) | Sodium picosulfate (157) | P |
|---|---|---|---|---|
| Rectum | 0.002 | |||
| 1 | 27 (8.6%) | 22 (14%) | 5 (3.2%) | |
| 2 | 37 (11.8%) | 19 (12.1%) | 18 (11.5%) | |
| 3 | 250 (79.6%) | 116 (73.9%) | 134 (85.4%) | |
| Sigmoid colon | < 0.001 | |||
| 0 | 7 (2.2%) | 4 (2.5%) | 3 (1.9%) | |
| 1 | 44 (14%) | 34 (21.7%) | 10 (6.4%) | |
| 2 | 42 (13.4%) | 22 (14%) | 20 (12.7%) | |
| 3 | 221 (70.4%) | 97 (61.8%) | 124 (79%) | |
| Descending colon | r | < 0.001 | ||
| 1 | 56 (17.8%) | 44 (28%) | 12 (7.6%) | |
| 2 | 53 (16.9%) | 23 (14.6%) | 30 (19.1%) | |
| 3 | 205 (65.3%) | 90 (57.3%) | 115 (73.2%) | |
| Transverse colon | < 0.001 | |||
| 0 | 1 (0.3%) | 1 (0.6%) | 0 (0%) | |
| 1 | 64 (20.4%) | 48 (30.6%) | 16 (10.2%) | |
| 2 | 52 (16.6%) | 24 (15.3%) | 28 (17.8%) | |
| 3 | 197 (62.7%) | 84 (53.5%) | 113 (72%) | |
| Ascending colon | < 0.001 | |||
| 0 | 11 (3.5%) | 9 (5.7%) | 2 (1.3%) | |
| 1 | 78 (24.9%) | 56 (35.7%) | 22 (14.1%) | |
| 2 | 62 (19.8%) | 25 (15.9%) | 37 (23.7%) | |
| 3 | 162 (51.8%) | 67 (42.7%) | 95 (60.9%) | |
| Cecum | < 0.001 | |||
| 0 | 12 ( 3.8 % ) | 10 (6.4 %) | 2 (1.3%) | |
| 1 | 103 (32.8%) | 74 (47.1%) | 29 (18.5%) | |
| 2 | 77 (24.5%) | 27 (17.2%) | 50 (31.8%) | |
| 3 | 122 (38.9%) | 46 (29.3%) | 76 (48.4%) | |
| Ileum | < 0.001 | |||
| 0 | 34 (10.8%) | 19 (12.1%) | 15 (9.6%) | |
| 1 | 40 (12.7%) | 34 (21.7%) | 6 (3.8%) | |
| 2 | 37 (11.8%) | 18 (11.5%) | 19 (12.1%) | |
| 3 | 203 (64.6%) | 86 (54.8%) | 117 (74.5%) | |
| Left | < 0.001 | |||
| 0 | 7 (2.2%) | 4 (2.5% ) | 3 (1.9%) | |
| 1 | 54 (17.2%) | 42 (26.8%) | 12 (7.6%) | |
| 2 | 54 (17.2%) | 23 (14.6%) | 31 (19.7%) | |
| 3 | 199 (63.4%) | 88 (56.1%) | 111 (70.7%) | |
| Right | < 0.001 | |||
| 0 | 44 (14%) | 27 (17.2%) | 17 (10.8%) | |
| 1 | 83 (26.4%) | 61 (38.9%) | 22 (14%) | |
| 2 | 74 (23.6%) | 23 (14.6%) | 51 (32.5%) | |
| 3 | 113 (36%) | 46 (29.3%) | 67 (42.7%) | |
| Total | 6.65 ± 2.33 | 6.02 ± 2.51 | 7.28 ± 1.95 | < 0.001 |
| Total category | < 0.001 | |||
| Bad (0 - 4) | 67 (21.3%) | 49 (31.2%) | 18 (11.5%) | |
| Good (5 - 9) | 247 (78.7%) | 108 (68.8%) | 139 (88.5%) |
| Model | Sodium picosulfate | Aquanet (bowel cleansing device) |
|---|---|---|
| Crude | 7.28 (6.93, 7.63) | 6.02 (5.52, 6.52) |
| Unadjusted | 7.16 (6.76, 7.55) | 5.92 (5.39, 6.45) |
| Adjusted | 8.6 (7.66, 9.53) | 7.54 (7, 8.08) |