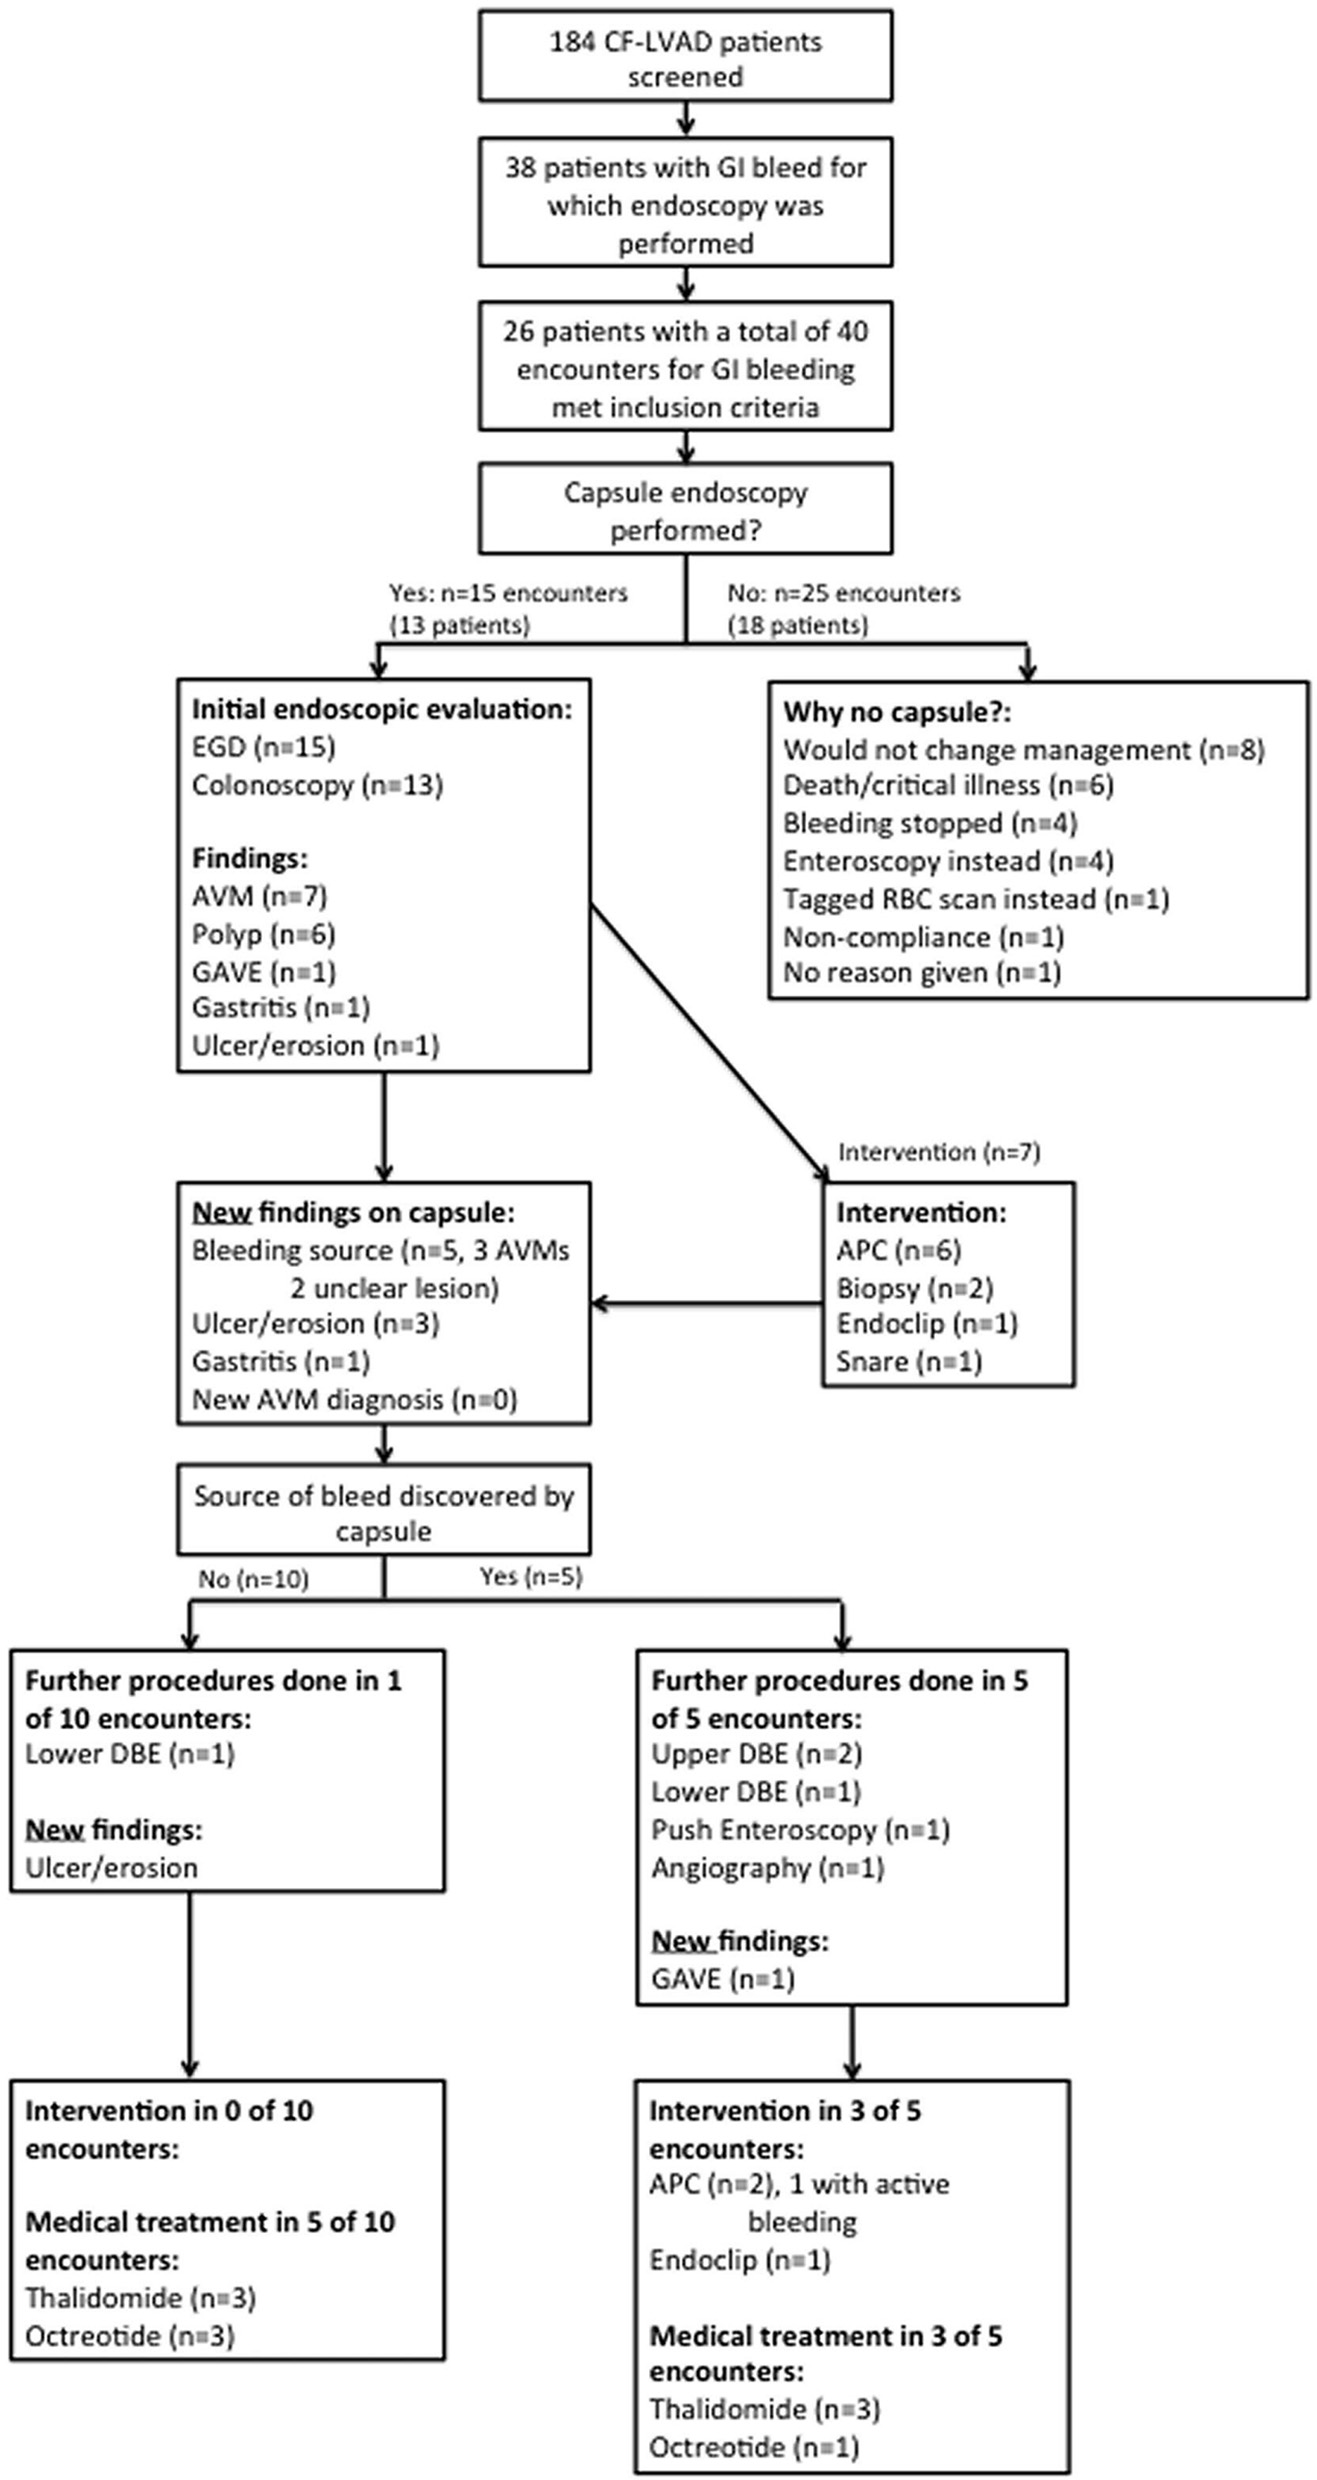
Figure 1. Flow chart for inclusion in the study and subsequent management of CF-LVAD patients with suspected small bowel bleed.
| Gastroenterology Research, ISSN 1918-2805 print, 1918-2813 online, Open Access |
| Article copyright, the authors; Journal compilation copyright, Gastroenterol Res and Elmer Press Inc |
| Journal website http://www.gastrores.org |
Original Article
Volume 10, Number 5, October 2017, pages 280-287
Efficacy of Video Capsule Endoscopy in the Management of Suspected Small Bowel Bleeding in Patients With Continuous Flow Left Ventricular Assist Devices
Figures
Tables
| Capsule (n = 15) | No capsule (n = 25) | P value | |
|---|---|---|---|
| VAD: ventricular assist device; COPD: chronic obstructive pulmonary disease; GI: gastrointestinal; ASA: American Society of Anesthesiology; RBC: red blood cell; INR: international normalized ratio; EGD: esophagogastroduodenoscopy. | |||
| Demographics | |||
| Age (mean) | 63.1 (57.0 - 69.3) | 63.7 (59.1 - 68.3) | 0.884 |
| Sex (% male) | 93.3 (68.1 - 99.8) | 68.0 (46.5 - 85.1) | 0.117 |
| Ethnicity (% White/Black/Hispanic/Asian) | 46.6/33.3/6.7/13.3 | 44.0/36.0/20.0/0 | 0.224 |
| Co-morbidities | |||
| VAD as destination therapy (%) | 66.7 (38.4 - 88.2) | 48.0 (27.8 - 68.7) | 0.332 |
| Ischemic cardiomyopathy (%) | 53.3 (26.6 - 78.7) | 72.0 (50.6 - 87.9) | 0.310 |
| Diabetes (%) | 53.3 (26.9 - 78.7) | 36.0 (18.0 - 57.5) | 0.336 |
| COPD or asthma (%) | 40.0 (16.3 - 67.7) | 24.0 (9.4 - 45.1) | 0.311 |
| Prior GI bleed (%) | 40.0 (16.3 - 67.7) | 48.0 (28.0 - 68.7) | 0.747 |
| ASA status (mean) | 3.33 (2.88 - 3.79) | 3.20 (2.96 - 3.44) | 0.549 |
| Clinical presentation | |||
| Melena (%) | 60.0 (32.3 - 83.7) | 84.0 (63.9 - 95.5) | 0.135 |
| Hematochezia (%) | 33.3 (11.8 - 61.6) | 16.0 (4.5 - 36.1) | 0.225 |
| Hematemesis (%) | 0 (0 - 21.8) | 12.0 (2.5 - 31.2) | 0.279 |
| Occult bleed (%) | 20.0 (4.3 - 48.1) | 8.0 (0.1 - 26.0) | 0.345 |
| Anticoagulation | |||
| Aspirin (%) | 73.3 (44.9 - 92.2) | 96.1 (79.6 - 99.9) | 0.056 |
| Warfarin (%) | 80.0 (51.9 - 95.7) | 80.0 (59.3 - 93.2) | 1.000 |
| Heparin (%) | 13.3 (1.7 - 40.5) | 16.0 (4.5 - 36.1) | 1.000 |
| Argatroban (%) | 0 (0 - 21.8) | 4.0 (0.1 - 20.4) | 1.000 |
| Plavix (%) | 0 (0 - 21.8) | 4.0 (0.1 - 20.4) | 1.000 |
| Eptifatide (%) | 0 (0 . 21.8) | 0 (0 - 13.7) | 1.000 |
| Laboratory values | |||
| RBC transfusion (median units 72 h prior to scope) | 3 (0 - 4) | 2 (1 - 3) | 0.591 |
| Platelet transfusion (median units 72 h prior to scope) | 0 (0 - 0) | 0 (0 - 0) | 0.267 |
| FFP transfusion (median units 72 h prior to scope) | 0 (0 - 0) | 0 (0 - 1) | 0.276 |
| Hemoglobin (mean) | 7.97 (7.38 - 8.56) | 8.55 (8.05 - 9.04) | 0.135 |
| Platelets (mean) | 245 (198 - 290) | 188 (154 - 222) | 0.041 |
| Creatinine (mean) | 1.25 (1.19 - 1.62) | 1.40 (1.19 - 1.62) | 0.421 |
| Dialysis (%) | 0 (0 - 21.8) | 12.0 (2.5 - 31.2) | 0.279 |
| INR (mean) | 1.83 (1.52 - 2.14) | 2.06 (1.79 - 2.32) | 0.269 |
| Vital signs before endoscopy | |||
| Intubated prior (%), not including for procedure | 0 (0 - 21.8) | 24.0 (9.4 - 45.1) | 0.067 |
| Inspired O2 (median %) | 21.0 (21.0 - 21.0) | 21.0 (21.0 - 40.0) | 0.378 |
| Vasopressors (median) | 0 (0 - 0) | 0 (0 - 0) | 0.140 |
| Initial workup | |||
| EGD and Colonoscopy (%) | 86.6 (59.5 - 98.3) | 36.0 (18.0 - 57.5) | 0.003 |
| EGD only (%) | 13.3 (1.7 - 40.5) | 64.0 (42.5 - 82.0) | 0.003 |
| Capsule (n = 15) | No capsule (n = 25) | P value | |
|---|---|---|---|
| AVM: arteriovenous malformation; GAVE: gastric antral vascular ectasia; APC: argon plasma coagulation; IR: interventional radiology; RBC: red blood cell. | |||
| Findings | |||
| AVM (%) | 46.7 (21.3 - 73.4) | 32.0 (14.9 - 53.5) | 0.502 |
| Ulcer or erosion (%) | 33.3 (11.8 - 61.6) | 20.0 (6.8 - 40.7) | 0.457 |
| Gastritis (%) | 13.3 (1.7 - 40.5) | 12.0 (2.5 - 31.2) | 1.000 |
| Polyp (%) | 40.0 (16.3 - 67.7) | 8.0 (0.9 - 26.0) | 0.036 |
| GAVE (%) | 13.3 (1.7 - 40.5) | 4.0 (0.1 - 20.4) | 0.545 |
| Endoscopic intervention | |||
| APC (%) | 40.0 (16.3 - 67.7) | 24.0 (9.4 - 45.1) | 0.311 |
| Clip (%) | 13.3 (1.7 - 40.5) | 12.0 (2.5 - 31.2) | 1.000 |
| Injection (%) | 0 (0 - 21.8) | 0 (0 - 13.7) | 1.000 |
| Snare (%) | 6.7 (0.1 - 31.9) | 0 (0 - 13.7) | 0.375 |
| Management | |||
| IR intervention (%) | 6.7 (0.2 - 31.9) | 0 (0 - 13.7) | 0.375 |
| Tagged RBC scan (%) | 0 (0 - 21.8) | 8.0 (0.9 - 26.0) | 0.519 |
| Start octreotide or thalidomide (%) | 46.7 (21.3 - 73.4) | 52.0 (31.3- 72.2) | 1.000 |
| Double balloon enteroscopy (%) | 20.0 (4.3 - 48.1) | 12.0 (2.5 - 31.2) | 0.654 |
| Push enteroscopy (%) | 6.7 (0.2 - 31.9) | 12.0 (2.5 - 31.2) | 1.000 |
| Any enteroscopy (%) | 26.7 (7.8 - 55.1) | 20.0 (6.8 - 40.7) | 0.705 |
| Events within 30 days | Capsule (n = 15) | No capsule (n = 25) | P value |
|---|---|---|---|
| PRBC: packed red blood cell: GI: gastrointestinal. | |||
| Readmission (%) | 46.7 (21.3 - 73.4) | 16.0 (4.5 - 36.1) | 0.065 |
| Related readmission (%) | 20.0 (4.3 - 48.1) | 8.0 (1.0 - 26.0) | 0.345 |
| Length of stay (median days) | 12 (5 - 30) | 6 (3 - 15) | 0.117 |
| Any adverse event (%) | 6.7 (0.2 - 31.9) | 36.0 (18.0 - 57.5) | 0.060 |
| Any adverse event or re-bleeding (%) | 33.3 (11.8 - 61.6) | 56.0 (34.9 - 75.6) | 0.204 |
| PRBC transfusion (median units) | 3 (0 - 7) | 1 (0 - 10) | 0.864 |
| Death (%) | 0 (0 - 21.8) | 20.0 (6.8 - 40.7) | 0.137 |
| Death related to GI bleed (%) | 0 (0 - 21.8) | 12.0 (2.5 - 31.2) | 0.279 |