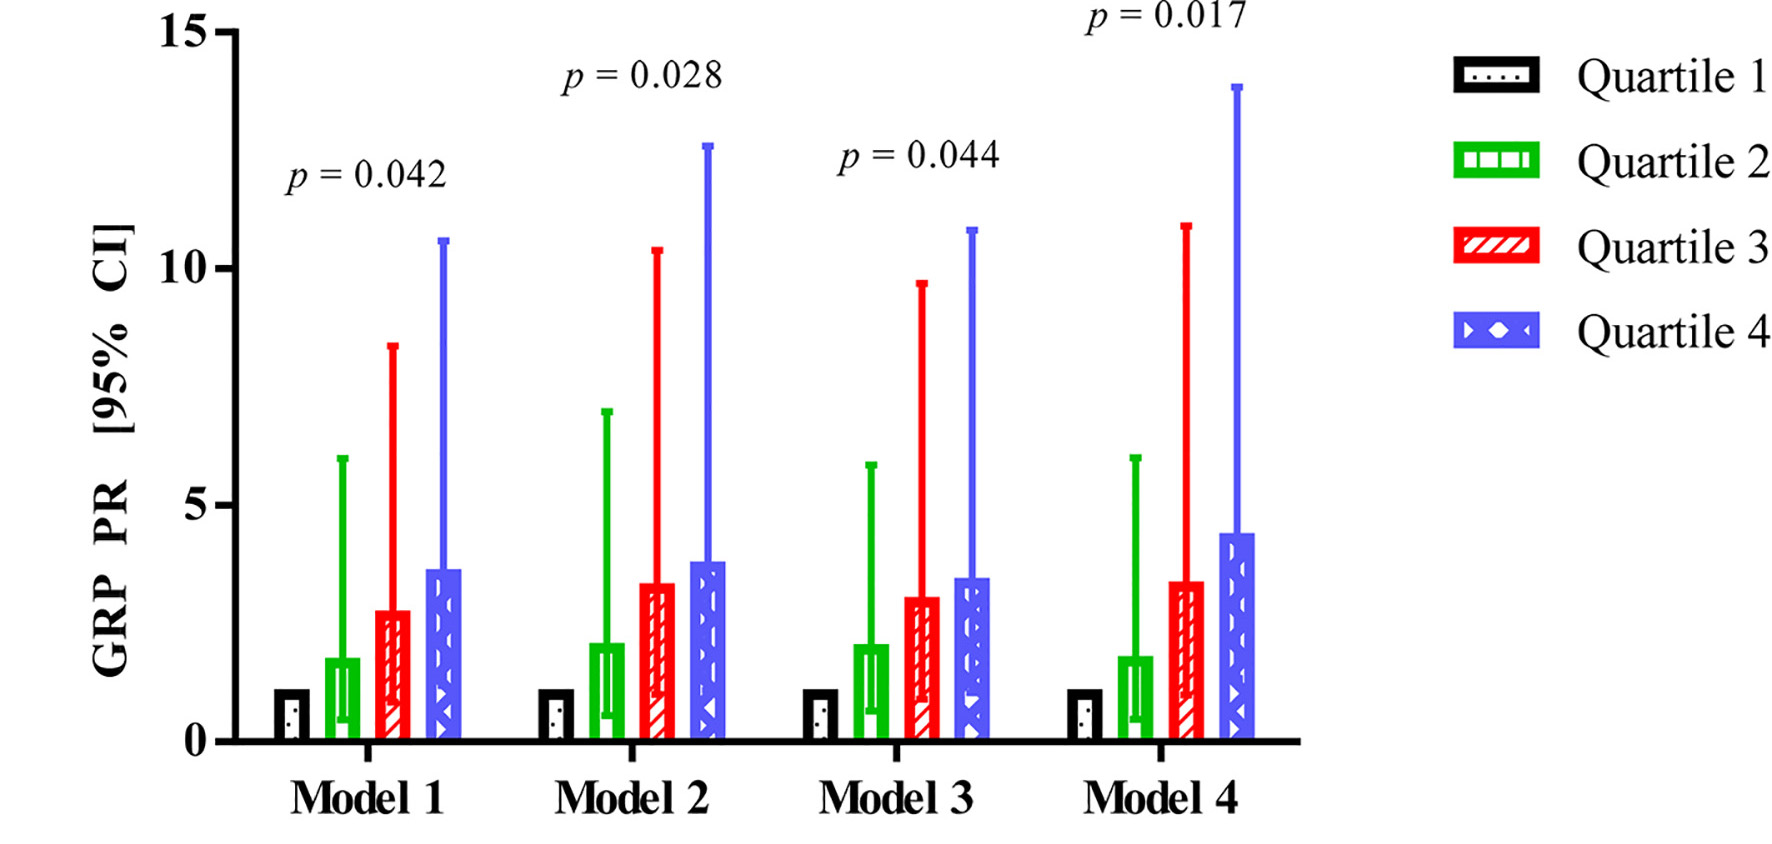
Figure 1. Association between GRP and abnormal glucose metabolism in patients after acute pancreatitis. GRP: gastrin-releasing peptide; CI: confidence interval; PR: prevalence ratio.
| Gastroenterology Research, ISSN 1918-2805 print, 1918-2813 online, Open Access |
| Article copyright, the authors; Journal compilation copyright, Gastroenterol Res and Elmer Press Inc |
| Journal website http://www.gastrores.org |
Original Article
Volume 10, Number 4, August 2017, pages 224-234
Gastrin-Releasing Peptide and Glucose Metabolism Following Pancreatitis
Figures
Tables
| Characteristic | NGM (n = 53) | AGM (n = 30) | Total (n = 83) | P |
|---|---|---|---|---|
| AGM: abnormal glucose metabolism; AP: acute pancreatitis; BMI: body mass index; FBG: fasting blood glucose; HbA1c: glycated hemoglobin A1c; NGM: normal glucose metabolism. *Data are presented as mean ± standard deviation (SD); †P-values < 0.05. | ||||
| Age (years)* | 47 ± 15 | 57 ± 13 | 51 ± 15 | 0.005† |
| Sex | 0.485 | |||
| Male | 30 | 20 | 50 | |
| Female | 23 | 10 | 33 | |
| Ethnicity | 0.005† | |||
| NZ European | 29 | 18 | 47 | |
| Maori | 1 | 5 | 6 | |
| Pacific Islanders | 2 | 1 | 3 | |
| Asian | 4 | 5 | 9 | |
| Other | 17 | 1 | 18 | |
| BMI (kg/m2)* | 26.86 ± 4.82 | 29.93 ± 6.07 | 27.95 ± 5.46 | 0.016† |
| Etiology | 0.906 | |||
| Biliary | 24 | 13 | 37 | |
| Alcohol | 12 | 6 | 18 | |
| Other | 17 | 11 | 28 | |
| Recurrence | 0.448 | |||
| No | 40 | 20 | 60 | |
| Yes | 13 | 10 | 23 | |
| Severity | < 0.001† | |||
| Mild | 50 | 18 | 68 | |
| Moderate | 2 | 9 | 11 | |
| Severe/critical | 1 | 3 | 4 | |
| Duration from first attack of AP (months)* | 33 ± 30 | 23 ± 19 | 30 ± 27 | 0.112 |
| FBG (mmol/L)* | 4.98 ± 0.29 | 5.87 ± 0.77 | 5.30 ± 0.67 | < 0.001† |
| HbA1c (mmol/mol)* | 33.57 ± 2.62 | 39.13 ± 3.00 | 35.58 ± 3.84 | < 0.001† |
| Pancreatic hormones | Gastrin-releasing peptide | |
|---|---|---|
| β (95% CI) | P | |
| Data are presented as β coefficients (95% CI). *P-values < 0.05. Model 1 was the unadjusted model. Model 2 was adjusted for age, sex, ethnicity, and BMI. Model 3 was adjusted for age, sex, ethnicity, BMI, etiology, severity, duration, and recurrence. Model 4 was adjusted for those confounders found to be significant in model 3. Specifically, model 4 for amylin and insulin was adjusted for BMI and recurrence. Model 4 for glucagon was adjusted for age, sex, BMI, recurrence, and duration. Model 4 for pancreatic polypeptide was adjusted for sex, age, BMI, and recurrence. Model 4 for somatostatin was adjusted for age and recurrence. | ||
| Amylin | ||
| Model 1 | -0.001 (-0.006, 0.005) | 0.833 |
| Model 2 | 0.000 (-0.005, 0.004) | 0.885 |
| Model 3 | -0.001 (-0.005, 0.004) | 0.793 |
| Model 4 | 0.000 (-0.005, 0.005) | 0.972 |
| Glucagon | ||
| Model 1 | -0.004 (-0.007, -0.002) | 0.002* |
| Model 2 | -0.004 (-0.006, -0.002) | 0.001* |
| Model 3 | -0.005 (-0.007, -0.003) | < 0.001* |
| Model 4 | -0.005 (-0.007, -0.003) | < 0.001* |
| Insulin | ||
| Model 1 | -0.001 (-0.004, 0.002) | 0.602 |
| Model 2 | 0.001 (-0.002, 0.004) | 0.420 |
| Model 3 | 0.002 (-0.001, 0.005) | 0.249 |
| Model 4 | 0.001 (-0.002, 0.004) | 0.509 |
| Pancreatic polypeptide | ||
| Model 1 | -0.001 (-0.002, 0.001) | 0.225 |
| Model 2 | -0.002 (-0.003, 0.000) | 0.010* |
| Model 3 | -0.002 (-0.003, -0.001) | < 0.001* |
| Model 4 | -0.001 (-0.003, 0.000) | 0.028* |
| Somatostatin | ||
| Model 1 | -0.022 (-0.311, 0.267) | 0.881 |
| Model 2 | -0.013 (-0.278, 0.253) | 0.924 |
| Model 3 | -0.075 (-0.323, 0.174) | 0.557 |
| Model 4 | -0.087 (-0.356, 0.183) | 0.528 |
| Gut hormones | Gastrin-releasing peptide | |
|---|---|---|
| β (95% CI) | P | |
| Data are presented as β coefficients (95% CI). *P-values < 0.05. Model 1 was the unadjusted model. Model 2 was adjusted for age, sex, ethnicity, and BMI. Model 3 was adjusted for age, sex, ethnicity, BMI, etiology, severity, duration, and recurrence. Model 4 was adjusted for those confounders found to be significant in model 3. Specifically, model 4 for cholecystokinin, gastric-inhibitory peptide, gastrin, ghrelin, glucagon-like peptide-1 and 2, oxyntomodulin, secretin, and vasoactive intestinal peptide was adjusted for BMI and recurrence. Model 4 for glicentin was adjusted for BMI, recurrence, and duration. Model 4 for peptide YY was adjusted for age, BMI, recurrence, and duration. | ||
| Cholecystokinin | ||
| Model 1 | 0.036 (-0.341, 0.413) | 0.852 |
| Model 2 | -0.050 (-0.410, 0.310) | 0.785 |
| Model 3 | -0.021 (-0.372, 0.330) | 0.907 |
| Model 4 | 0.037 (-0.330, 0.404) | 0.844 |
| Gastric-inhibitory peptide | ||
| Model 1 | -0.001 (-0.002, 0.001) | 0.223 |
| Model 2 | -0.001 (-0.003, 0.000) | 0.054 |
| Model 3 | -0.002 (-0.004, -0.001) | 0.001* |
| Model 4 | -0.001 (-0.003, 0.000) | 0.065 |
| Gastrin | ||
| Model 1 | 0.000 (0.000, 0.000) | 0.610 |
| Model 2 | 0.000 (0.000, 0.000) | 0.463 |
| Model 3 | 0.000 (0.000, 0.000) | 0.543 |
| Model 4 | 0.000 (0.000, 0.000) | 0.677 |
| Ghrelin | ||
| Model 1 | -0.011 (-0.025, 0.004) | 0.142 |
| Model 2 | -0.008 (-0.022, 0.007) | 0.302 |
| Model 3 | -0.012 (-0.026, 0.001) | 0.077 |
| Model 4 | -0.010 (-0.024, 0.005) | 0.180 |
| Glicentin | ||
| Model 1 | -0.005 (-0.012, 0.002) | 0.175 |
| Model 2 | -0.006 (-0.013, 0.001) | 0.081 |
| Model 3 | -0.007 (-0.014, -0.001) | 0.024* |
| Model 4 | -0.004 (-0.010, 0.003) | 0.282 |
| Glucagon-like peptide-1 | ||
| Model 1 | 0.001 (-0.001, 0.002) | 0.322 |
| Model 2 | 0.000 (-0.001, 0.002) | 0.845 |
| Model 3 | 0.000 (-0.001, 0.002) | 0.754 |
| Model 4 | 0.000 (-0.001, 0.002) | 0.588 |
| Glucagon-like peptide-2 | ||
| Model 1 | 0.022 (-0.010, 0.054) | 0.181 |
| Model 2 | 0.017 (-0.015, 0.048) | 0.300 |
| Model 3 | 0.016 (-0.015, 0.046) | 0.318 |
| Model 4 | 0.021 (-0.009, 0.051) | 0.175 |
| Oxyntomodulin | ||
| Model 1 | 0.005 (-0.007, 0.017) | 0.403 |
| Model 2 | 0.001 (-0.010, 0.013) | 0.839 |
| Model 3 | 0.001 (-0.010, 0.012) | 0.840 |
| Model 4 | 0.004 (-0.007, 0.016) | 0.464 |
| Peptide YY | ||
| Model 1 | -0.001 ( -0.002, 0.000) | 0.055 |
| Model 2 | -0.001 (-0.002, 0.000) | 0.026* |
| Model 3 | -0.002 (-0.003, -0.001) | < 0.001* |
| Model 4 | -0.002 (-0.003, -0.001) | 0.003* |
| Secretin | ||
| Model 1 | 0.088 (-2.688, 2.845) | 0.950 |
| Model 2 | -0.390 (-2.994, 2.215) | 0.769 |
| Model 3 | -0.932 (-3.560, 1.696) | 0.487 |
| Model 4 | -0.097 (-2.722, 2.528) | 0.942 |
| Vasoactive intestinal peptide | ||
| Model 1 | 0.351 (-0.271, 0.973) | 0.269 |
| Model 2 | 0.245 (-0.343, 0.833) | 0.414 |
| Model 3 | 0.367 (-0.253, 0.987) | 0.246 |
| Model 4 | 0.497 (-0.082, 1.076) | 0.092 |
| Cytokine | Gastrin-releasing peptide | |
|---|---|---|
| β (95% CI) | P | |
| Data are presented as β coefficients (95% CI). *P-values < 0.05. Model 1 was the unadjusted model. Model 2 was adjusted for age, sex, ethnicity, and BMI. Model 3 was adjusted for age, sex, ethnicity, BMI, etiology, severity, duration, and recurrence. Model 4 was adjusted for those confounders found to be significant in model 3. Model 4 for interleukin-6 was adjusted for BMI and recurrence. Model 4 for monocyte chemoattractant protein-1 was adjusted for BMI, recurrence, and duration. Model 4 for tumor necrosis factor α was adjusted for age, BMI, and recurrence. | ||
| Interleukin-6 | ||
| Model 1 | -0.001 (-0.006, 0.005) | 0.749 |
| Model 2 | -0.004 (-0.009, 0.002) | 0.211 |
| Model 3 | -0.005 (-0.010, 0.001) | 0.108 |
| Model 4 | 0.000 (-0.006, 0.005) | 0.901 |
| Monocyte chemoattract protein-1 | ||
| Model 1 | -0.002 (-0.004, 0.000) | 0.024* |
| Model 2 | -0.003 (-0.005, -0.001) | 0.001* |
| Model 3 | -0.003 (-0.005, -0.002) | < 0.001* |
| Model 4 | -0.002 (-0.004, 0.000) | 0.017* |
| Tumor necrosis factor-α | ||
| Model 1 | -0.034 (-0.063, -0.005) | 0.023* |
| Model 2 | -0.036 (-0.065, -0.007) | 0.015* |
| Model 3 | -0.050 (-0.078, -0.023) | < 0.001* |
| Model 4 | -0.039 (-0.069, -0.010) | 0.008* |