Gastroenterology Research, ISSN 1918-2805 print, 1918-2813 online, Open Access
Article copyright, the authors; Journal compilation copyright, Gastroenterol Res and Elmer Press Inc
Journal website http://www.gastrores.org

Original Article

Volume 10, Number 4, August 2017, pages 218-223


Long-Term Follow-Up of Autonomic and Enteric Measures in Patients Undergoing Vertical Banded Gastroplasty for Morbid Obesity

Figure

Figure 1.
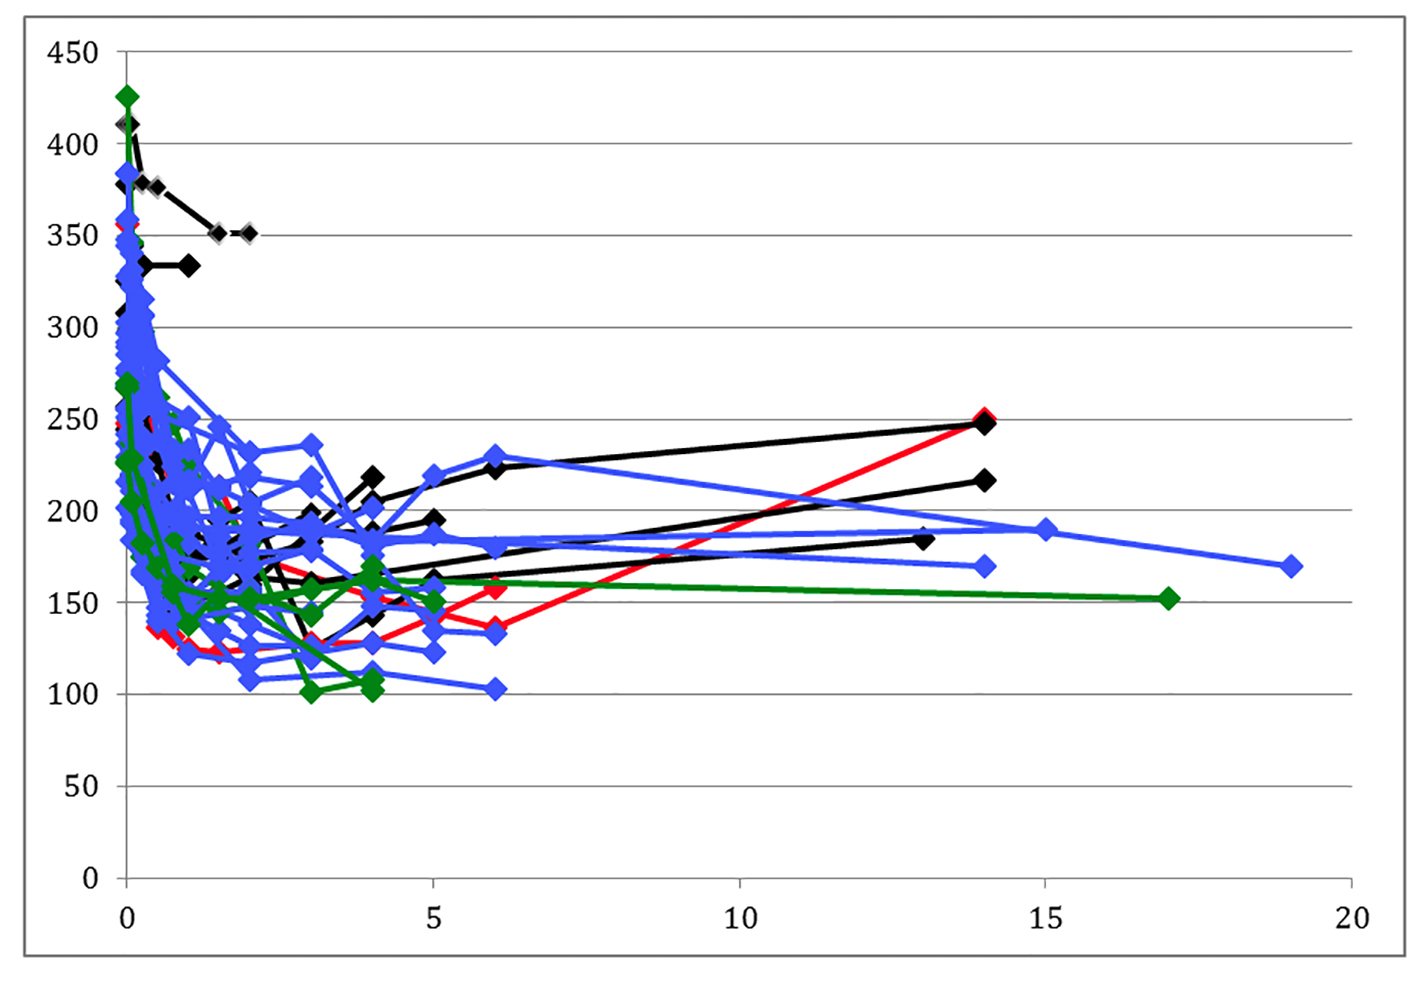
Figure 1. Patient weight changes. Black lines are predicted weight gainers, green lines are those predicted to gain weight but actually lost weight, blue lines are patients predicted to lose weight, and red lines are predicted losers who actually regained.

Tables

Table 1. Participants and Individual Autonomic Measurements
 
ParameterNormal valueStudent’s t-test of meansActual weight gainers (n = 10)Actual weight losers (n = 29)
Gainers (n = 10)Losers (n = 29)P-valuen normaln abnormal% abnormaln normaln abnormal% abnormal
EGG: electrogastrogram; VC: vasoconstriction; PAR: postural adjustment ratio; RRI: R-to-R interval.
% Female90.00%89.66%1.0000
Mean age at surgery (years)32.0039.040.0409
Mean weight at surgery (lbs)309.30289.340.3615
Mean EGG (cycles per min)2.5 - 3.33.223.310.608220%25414%
Mean VC (%)> 8080.4078.090.677330%20931%
Mean PAR (%)> 2535.7351.660.118220%20931%
Mean RRI (%)> 3330.9024.610.215550%82172%


Table 2. Prediction of Weight Change by Model
 
Actual weight gainActual weight lossTotal
Using data obtained at baseline
  Gainer model predicted weight gain8 (80%)Loser model predicted weight gain5 (17%)13
  Gainer model predicted weight loss2 (20%)Loser model predicted weight loss24 (83%)26
  Totals1029
  Overall correct classification rate: 32/39 (82%)
Using data 3 months postoperative data
  Gainer model predicted weight gain9 (90%)Loser Model Predicted Weight Gain5 (17%)14
  Gainer model predicted weight loss1 (10%)Loser Model Predicted Weight Loss24 (83%)25
  Totals1029
  Overall correct classification rate: 34/39 (87%)