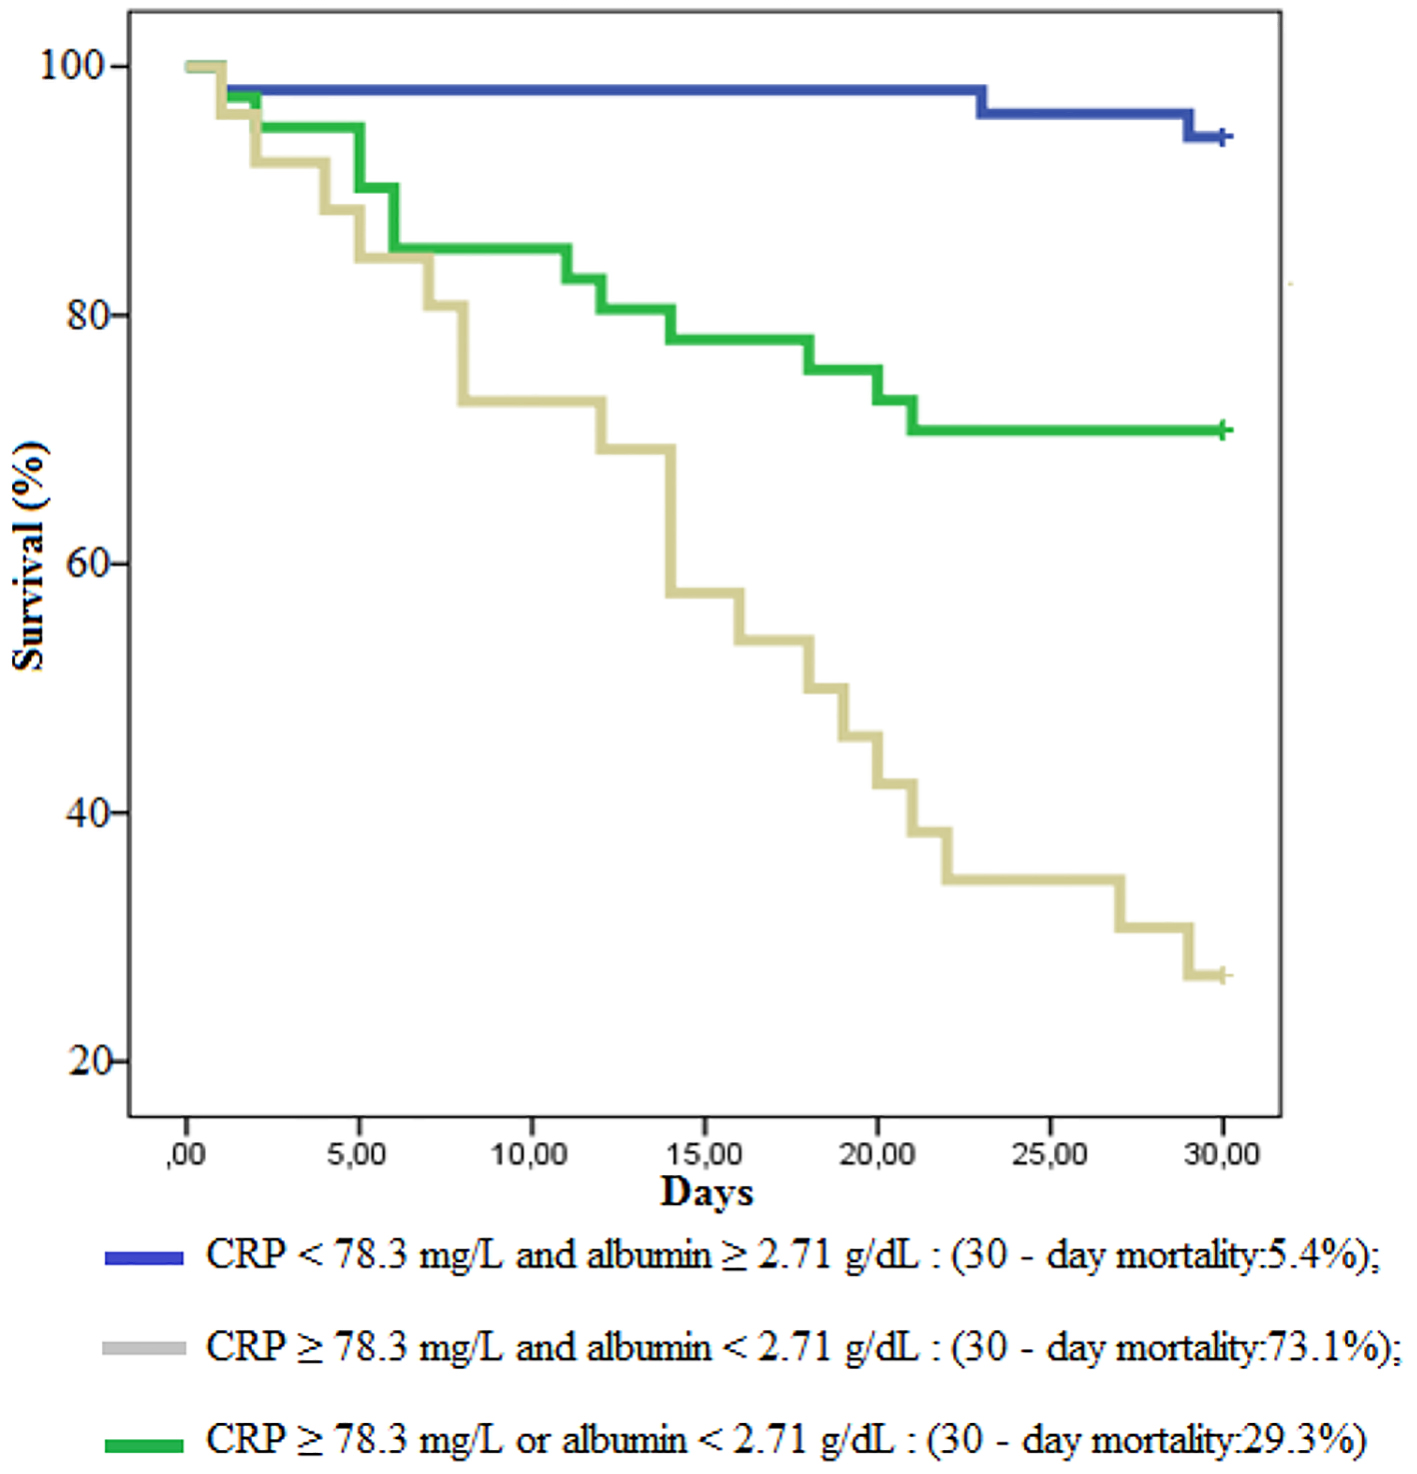
Figure 1. Survival graph based on CRP and albumin.
| Gastroenterology Research, ISSN 1918-2805 print, 1918-2813 online, Open Access |
| Article copyright, the authors; Journal compilation copyright, Gastroenterol Res and Elmer Press Inc |
| Journal website http://www.gastrores.org |
Original Article
Volume 10, Number 3, June 2017, pages 172-176
High C-Reactive Protein and Low Albumin Levels Predict High 30-Day Mortality in Patients Undergoing Percutaneous Endoscopic Gastrotomy
Figure
Tables
| Characteristics | Number (%) |
|---|---|
| Age | |
| < 65 | 42 (35%) |
| ≥ 65 | 78 (65.0%) |
| Indication for PEG | |
| Cerebrovascular disease | 69 (57.5%) |
| Neurologic disease | 25 (20.8%) |
| Dementia | 16 (13.3%) |
| Malignancy | 10 (8.3%) |
| Department conducting PEG | |
| Intensive care unit | 43 (35.8) |
| Inpatient units | 77 (64.2%) |
| Infection | Agent | Number (%) |
|---|---|---|
| PEG site infection | 13 (10.3%) | |
| Klebsiella spp. | 4 (30.7%) | |
| Enterococcus faecium | 2 (15.3%) | |
| Escherichia coli | 2 (15.3%) | |
| Acinetobacter baumannii | 2 (15.3%) | |
| Staphylococcus aureus | 1 (7.6%) | |
| Proteus mirabilis | 1 (7.6%) | |
| Stenotrophomonas maltophilia | 1 (7.6%) | |
| Bloodstream infection | 6 (5.0%) | |
| Candida albicans | 5 (83.3%) | |
| Enterococcus faecium | 1 (16.7%) | |
| Aspiration pneumonia | 3 (2.5%) | |
| Klebsiella spp. | 3 (100%) |
| Deceased (n = 34) | Surviving (n = 86) | P value | |
|---|---|---|---|
| *Fisher’s exact test. **Chi-square test. ***Mann-Whitney U test. | |||
| Comorbid conditions | |||
| Diabetes mellitus | 2 (5.9%) | 8 (9.3%) | > 0.05* |
| Coronary artery disease | 11 (32.4%) | 12 (14.0%) | 0.021** |
| Cerebrovascular disease | 21 (61.8%) | 57 (66.3%) | > 0.05** |
| Dementia | 6 (17.6%) | 18 (20.9%) | > 0.05** |
| Malignancy | - | 9 (10.5%) | > 0.05* |
| Hypertension | 11 (32.4%) | 27 (31.4%) | > 0.05** |
| Chronic kidney failure | 2 (5.9%) | 2 (2.3%) | > 0.05* |
| Biomarkers | |||
| CRP (mg/L) | 124.5 (19.2 - 737.0) | 28.6 (1.5 - 284.0) | < 0.001*** |
| Albumin (g/dL) | 2.67 (0.3 - 4.2) | 2.97 (1.67 - 4.56) | 0.001*** |
| % neutrophil | 75.3 (38.8 - 96.5) | 83.3 (29.6 - 96.3) | 0.001*** |
| % lymphocyte | 14.5 (1.8 - 56.1) | 9.7 (2.9 - 29.1) | 0.001*** |
| Hemoglobin (g/dL) | 11.6 (7.3 - 18.2) | 9.9 (8.0 - 15.7) | 0.002*** |
| Platelet count (103/µL) | 286,150 (26,600 - 613,000) | 282,500 (23,250 -435,000) | 0.060*** |
| Leukocyte count (103/µL) | 9,258 (4,640 - 25,120) | 13,240 (1,536 -43,750) | 0.002*** |
| INR | 1.14 (0.85 - 1.54) | 1.09 (0.9 - 1.46) | 0.193*** |
| Creatinine (mg/dL) | 0.6 (0.1 - 4.1) | 0.6 (0.2 - 5.5) | 0.470*** |
| Days of hospitalization prior to PEG | 13 (1 - 170) | 34 (2 - 89) | < 0.001*** |
| Cut-off value | P value | Sensitivity (%) | Specificity (%) | Positive predictive value (%) | Negative predictive value (%) | |
|---|---|---|---|---|---|---|
| CRP (mg/L) | 78.3 | < 0.001 | 85.2 (82.8 - 87.3) | 74.5 (71.6 - 77.1) | 76.9 (74.9 - 78.8) | 83.4 (81.2 - 85.4) |
| Albumin (g/dL) | 2.71 | 0.001 | 75.5 (72.7 - 78.1) | 61.8 (58.7 - 64.8) | 66.8 (64.4 - 68.3) | 71.6 (69.1 - 73.9 |
| % neutrophil | 75.89 | 0.001 | 82.3 (79.7 - 84.6) | 53.1 (49.9 - 56.2) | 63.7 (62.0 - 65.3) | 75 (72.1 -77.6) |
| % lymphocyte | 14.42 | 0.001 | 51.8 (48.6 - 54.9) | 85.3 (82.9 - 87.4) | 77.8 (75.0 - 80.5) | 63.9 (62.2 - 65.4) |
| Hemoglobin (g/dL) | 9.94 | 0.002 | 73.8 (70.9 - 76.5) | 58.9 (55.7 - 61.9) | 64.2 (62.3 - 66.1) | 69.2 (66.6 - 71.6) |
| Leukocyte count (103/µL) | 10,530 | 0.002 | 67.6 (63.9 - 69.8) | 66.7 (63.6 - 69.6) | 67.0 (64.8 - 69.1) | 66.4 (64.4 - 68.7) |