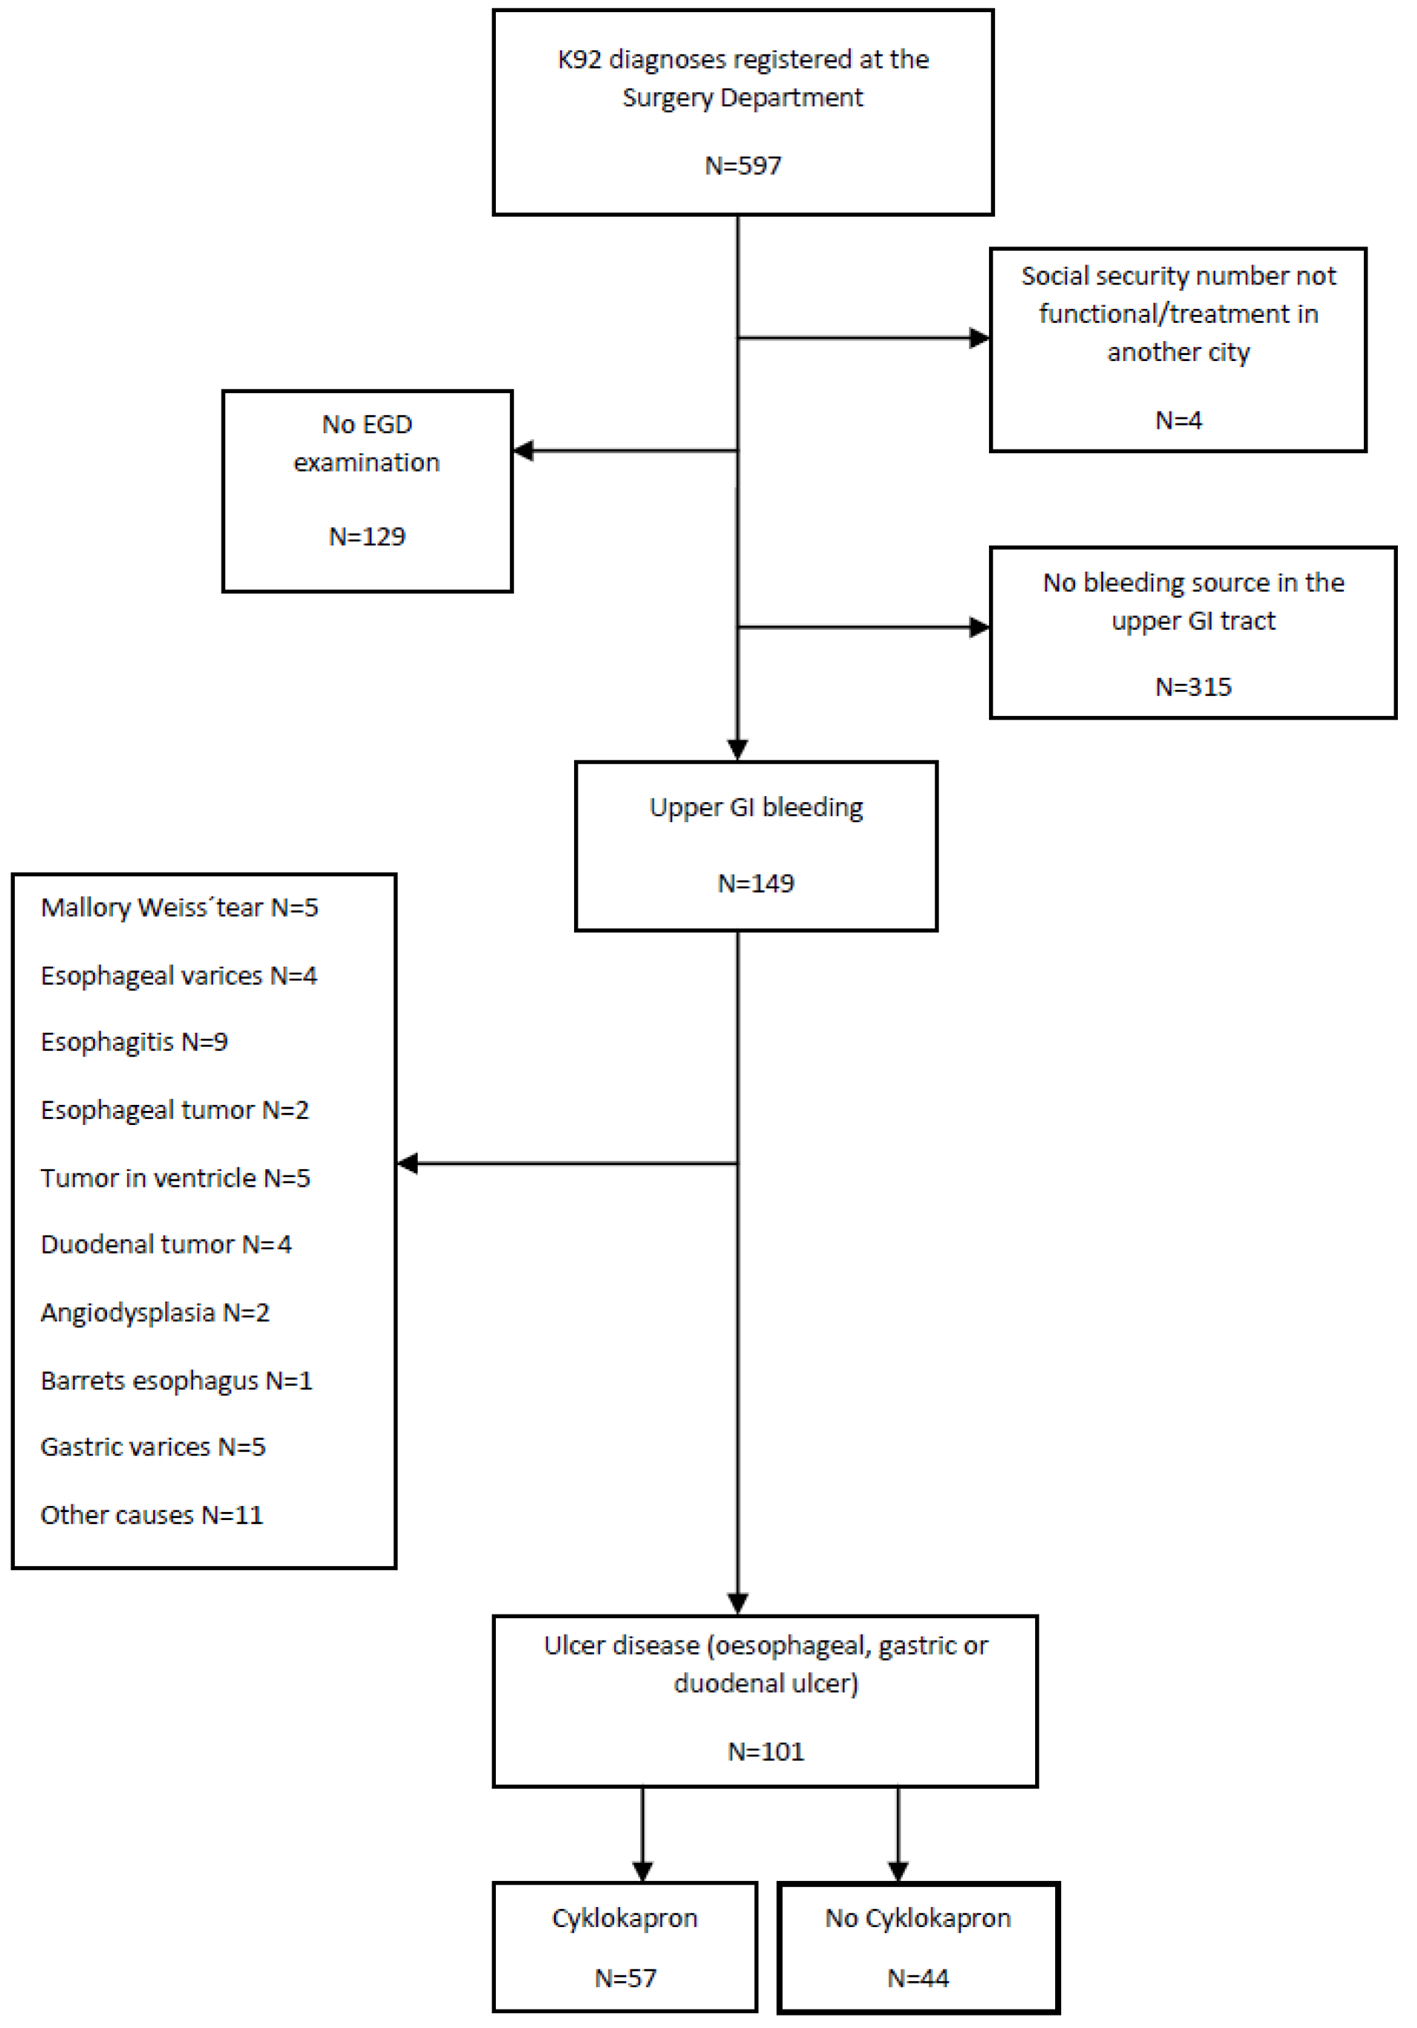
Figure 1. Flow chart for patient selection.
| Gastroenterology Research, ISSN 1918-2805 print, 1918-2813 online, Open Access |
| Article copyright, the authors; Journal compilation copyright, Gastroenterol Res and Elmer Press Inc |
| Journal website http://www.gastrores.org |
Original Article
Volume 10, Number 3, June 2017, pages 159-165
The Trend of Tranexamic Use in Upper Gastrointestinal Bleeding Ulcers
Figure
Tables
| Total (N = 101) | TXA (N = 57) | No TXA (N = 44) | P value | |
|---|---|---|---|---|
| Women, N (%) | 45 (44.6) | 24 (42.1) | 21 (47.7) | 0.857 |
| Men, N (%) | 56 (55.4) | 33 (59.9) | 23 (52.3) | 0.866 |
| Mean age, years | 71 CI (69 - 75) | 73 | 69 | 0.514 |
| Mean systolic blood pressure | 121 CI (115 - 127) | 119 | 123 | 0.237 |
| Hemoglobin, mean value | 98 CI (92 - 103) | 93 | 102 | 0.177 |
| Pulse, mean value | 87 CI (84 - 92) | 84 | 90 | 0.211 |
| Hematemesis, N (%) | 50 (49.5) | 32 (60.4) | 18 (41.9) | 0.386 |
| Melena, N (%) | 75 (74.3) | 42 (79.2) | 33 (76.7) | 1.000 |
| Hematochezia, N (%) | 11 (12.1) | 7 (14.3) | 4 (9.5) | 0.755 |
| Abdominal pain or discomfort, N (%) | 40 (43.0) | 19 (38.0) | 21 (48.8) | 0.355 |
| TXA | No TXA | P value | |
|---|---|---|---|
| Cardiovascular disease, N (%) | 40 (70.2) | 28 (63.6) | 0.487 |
| Number of medications comprising a risk for ulcer disease Median value (min. - max.) | 1 (0 - 4) | 1 (0 - 3) | 0.732 |
| TXA | No TXA | P value | |
|---|---|---|---|
| x: no statistics because PPI was a constant. | |||
| PPI, N (%) | 57 (100) | 44 (100) | x |
| Adrenaline, N (%) | 20 (36.4) | 8 (18.6) | 0.053 |
| Other treatments, N (%) | 16 (28.1) | 5 (11.9) | 0.052 |
| H. pylori eradication, N (%) | 26 (46.4) | 27 (61.4) | 0.137 |
| EGD < 24 h | 47 (82.5) | 31 (70.5) | 0.154 |
| > 0 MAF | Re-bleeding, N (%) | Days at hospital, median value (min. - max.) | Treatment at Surgery Department, N (%) | Treatment at Surgery Department and ICU, N (%) | |
|---|---|---|---|---|---|
| TXA | 43 (84.3) | 10 (17.5) | 5 (1 - 15) | 43 (75.4) | 14 (24.6) |
| No TXA | 20 (64.5) | 6 (13.6) | 3 (0 - 39) | 41 (93.2) | 3 (6.8) |
| P-value | 0.039 | 0.594 | 0.005 | 0.018 | 0.018 |
| MAF | Re-bleeding | Treatment at the Surgery Department | Treatment at the Surgery Department and ICU | |
|---|---|---|---|---|
| Men, N (%) | 37 (66.1) | 10 (17.9) | 46 (82.1) | 10 (17.9) |
| Women, N (%) | 26 (57.8) | 6 (13.3) | 38 (84.4) | 7 (15.6) |
| Age, median value (min. - max.) | 76 (38 - 94) | 74 (24 - 90) | 73 (24 - 94) | 75 (49 - 90) |