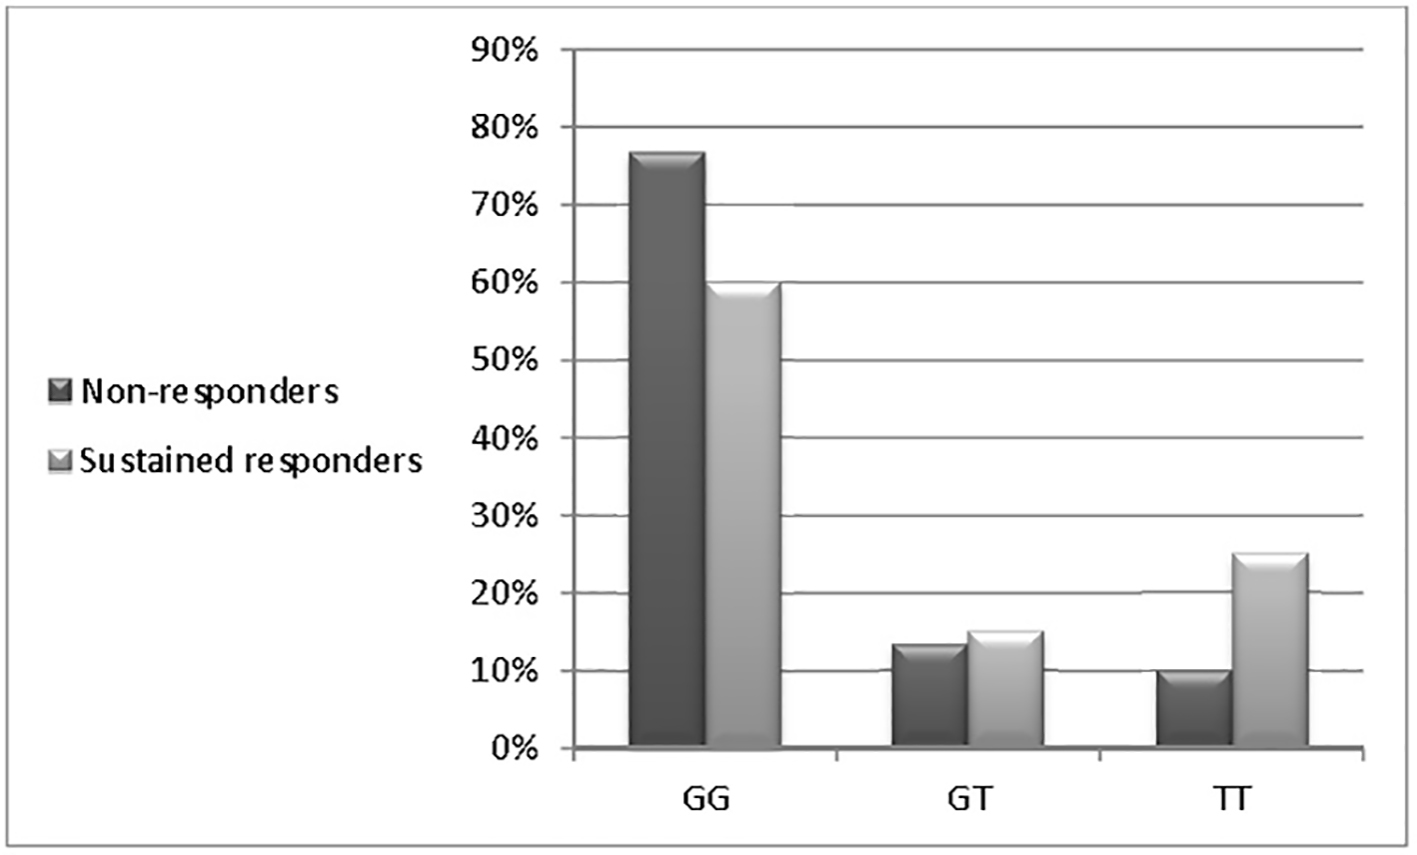
Figure 1. Distributions of the MxA promoter genotypes among studied patients.
| Gastroenterology Research, ISSN 1918-2805 print, 1918-2813 online, Open Access |
| Article copyright, the authors; Journal compilation copyright, Gastroenterol Res and Elmer Press Inc |
| Journal website http://www.gastrores.org |
Original Article
Volume 10, Number 2, April 2017, pages 100-105
Assessment of the Relation Between SNP in MxA Gene and the Responsiveness of Egyptian HCV Genotype 4 Patients to Pegylated Interferon and Ribavirin Treatment
Figures
Tables
| Mean ± SD | No. (%) | |
|---|---|---|
| Age (years) | 45.23 ± 7.10 | |
| Sex | ||
| Male | 50(71.5%) | |
| Female | 20(28.5%) | |
| Glucose (mg/ dL) | 93.93 ± 22.58 | |
| Creatinine (mg/dL) | 0.87 ± 0.18 | |
| Albumin (g/dL) | 4.23 ± 0.61 | |
| Alkaline phosphatase (IU/L) | 92.39 ± 16.76 | |
| AST (IU/L) | 60.09 ± 38.75 | |
| ALT (IU/L) | 62.58 ± 40.58 | |
| Total Bilirubin (mg/dL) | 0.91 ± 0.34 | |
| Direct Bilirubin (mg/dL) | 0.25 ± 0.17 | |
| Total leucocytic count (109/L) | 6,579.14 ± 1,630.41 | |
| Hemoglobin (g/dL) | 13.73 ± 1.38 | |
| Platelets (109/L) | 207,842.86 ± 65,301.01 | |
| Prothrombin concentration (%) | 86.6 ± 8.9837 | |
| Alpha feto protein (ng/mL) | 3.95 ± 2.39 | |
| HCV RNA by PCR(IU/mL) | 892,644 ± 1,444,794 | |
| Necroinflammatory score (Metavir) | ||
| A1 | 52 (74.2%) | |
| A2 | 12 (17.2%) | |
| A3 | 6 (8.6%) | |
| Fibrosis score (Metavir) | ||
| F1 | 52 (74.2%) | |
| F2 | 12 (17.2%) | |
| F3 | 6 (8.6%) |
| Groups | P-value | ||
|---|---|---|---|
| Non-responders, mean ± SD | Sustained responders, mean ± SD | ||
| Age (years) | 43.4 ± 7.7 | 46.3 ± 6.5 | 0.092 |
| ALT (IU/L) | 56.8 ± 33.2 | 67.4 ± 45.2 | 0.282 |
| AFP (ng/mL) | 3.8 ± 2.1 | 4.0 ± 2.6 | 0.669 |
| HCV RNA by PCR (IU/mL) | 256,354 ± 958,756 | 359,462 ± 102,658 | 0.789 |
| Parameter | Non-responders | Sustained responders | Crude OR | 95% CI | P-value |
|---|---|---|---|---|---|
| GG (n = 47) | 23 (76.7%) | 24 (60.0%) | 0.958 | 0.541 - 1.698 | 0.884 |
| GT (n = 10) | 4 (13.3%) | 6 (15.0%) | 0.667 | 0.188 - 2.362 | 0.530 |
| TT (n = 13) | 3 (10.0%) | 10 (25.0%) | 0.300 | 0.083 - 1.090 | 0.067 |
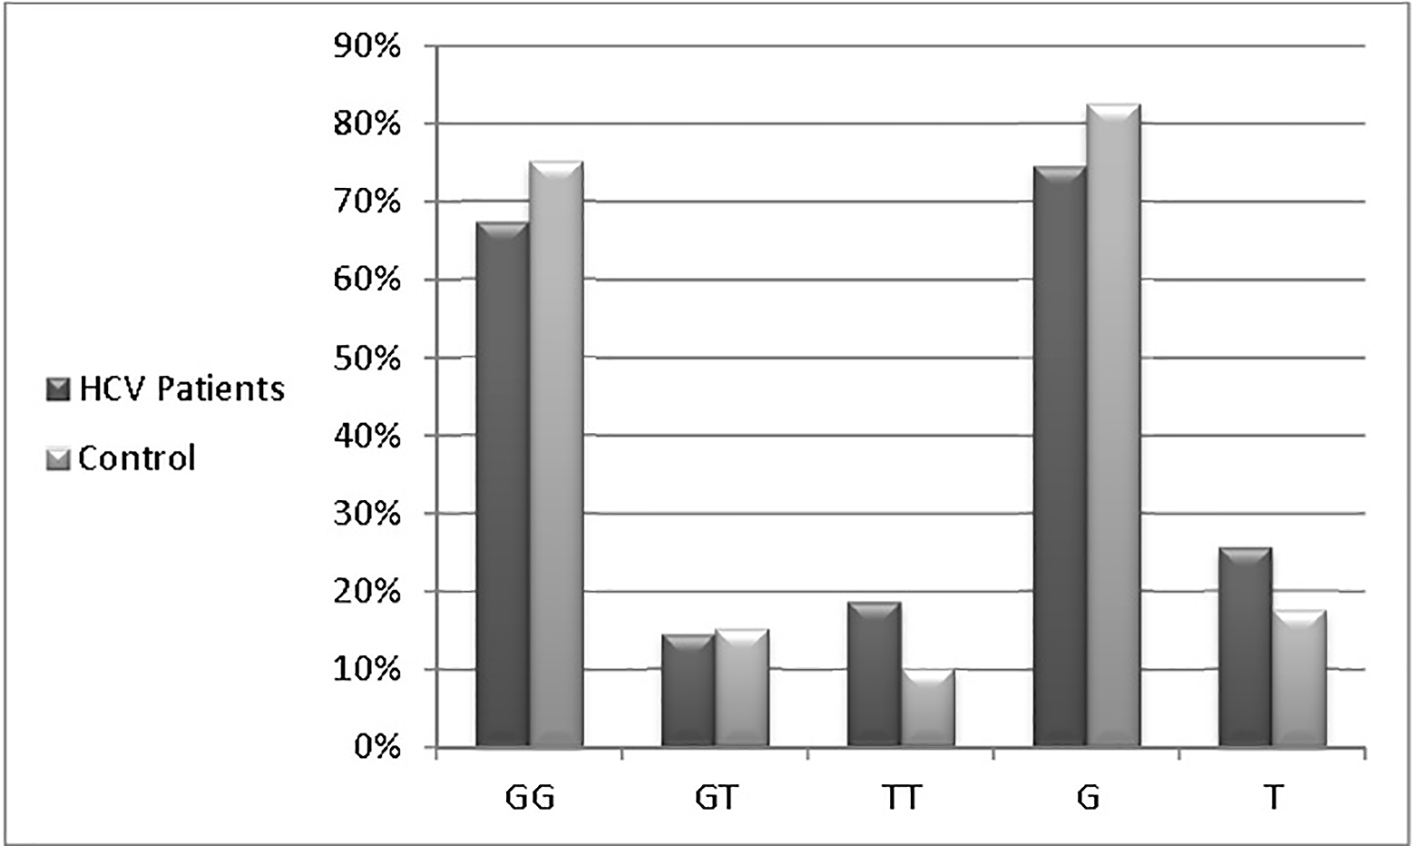
| Parameter | GG (n = 77) | GT (n = 16) | TT (n = 17) | G (n = 170) | T (n = 50) |
|---|---|---|---|---|---|
| HCV patients | 47 (67%) | 10 (14.5%) | 13 (18.5%) | 105 (74.5%) | 36 (25.5%) |
| Controls | 30 (75%) | 6 (15%) | 4 (10%) | 66 (82.5%) | 14 (17.5%) |
| Parameter | Non-responders | Sustained responders |
|---|---|---|
| Age (years) | ||
| < 49 years (n = 45) | 21 (70.0%) | 24 (60.0%) |
| > 49 years (n = 25) | 9 (30.0%) | 16 (40.0%) |
| Gender | ||
| Female (n = 20) | 8 (26.7%) | 12 (30.0%) |
| Male (n = 50) | 22 (73.3%) | 28 (70.0%) |
| ALT | ||
| < 66 IU/L (n = 45) | 20 (66.7%) | 25 (62.5%) |
| > 66 IU/L (n = 25) | 10 (33.3%) | 15 (37.5%) |
| MxA | ||
| GG (n = 47) | 23 (76.7%) | 24 (60.0%) |
| GT (n = 10) | 4 (13.3%) | 6 (15.0%) |
| TT (n = 13) | 3 (10.0%) | 10 (25.0%) |
| Activity | ||
| A1 (n = 52) | 20 (66.7%) | 32 (80.0%) |
| A2 (n = 12) | 4 (13.3%) | 8 (20.0%) |
| A3 (n = 6) | 6 (20.0%) | 0 (0%) |
| Fibrosis | ||
| F1 (n = 52) | 20 (66.7%) | 32 (80.0%) |
| F2 (n = 12) | 4 (13.3%) | 8 (20.0%) |
| F3 (n = 6) | 6 (20.0%) | 0 (0%) |
| Predicting factors | Non-responders | Sustained responders | Crude OR | 95% CI | P-value |
|---|---|---|---|---|---|
| Age | |||||
| < 49 years (n = 45) | 21 (70.0%) | 24 (60.0%) | 0.875 | 0.487 - 1.572 | 0.655 |
| > 49 years (n = 25) | 9 (30.0%) | 16 (40.0%) | 0.563 | 0.249 - 1.273 | 0.167 |
| Sex | |||||
| Female (n = 20) | 8 (26.7%) | 12 (30.0%) | 0.667 | 0.273 - 1.631 | 0.374 |
| Male (n = 50) | 22 (73.3%) | 28 (70.0%) | 0.786 | 0.450 - 1.373 | 0.397 |
| ALT | |||||
| < 66 U/L (n = 45) | 20 (66.7%) | 25 (62.5%) | 0.800 | 0.444 - 1.440 | 0.457 |
| > 66 U/L (n = 25) | 10 (33.3%) | 15 (37.5%) | 0.667 | 0.300 - 1.484 | 0.321 |