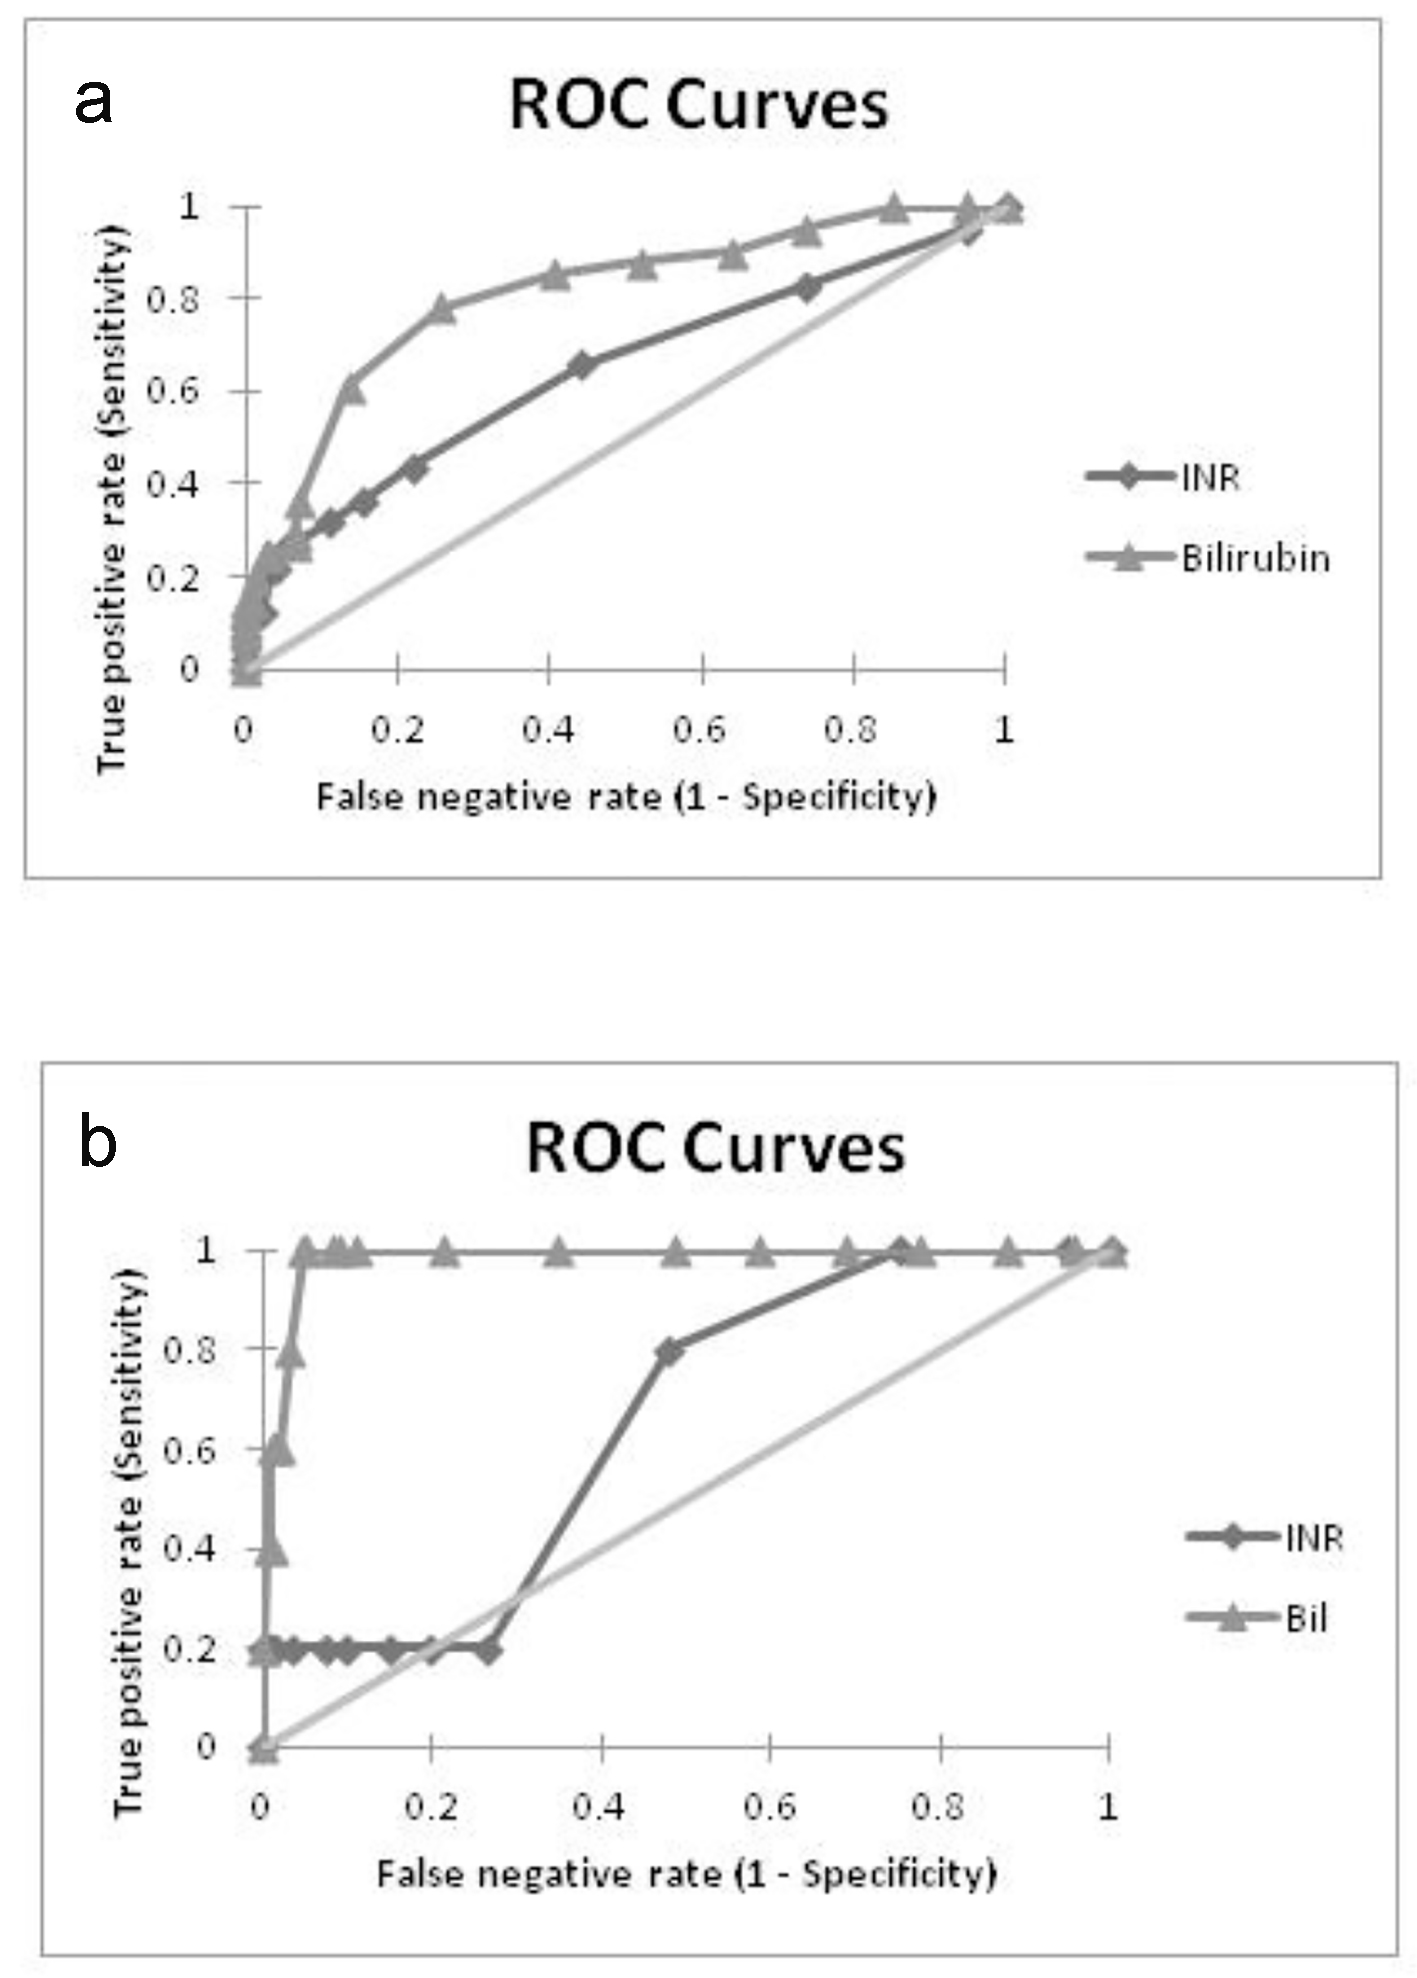
Figure 1. ROC curves showing predictive performance of bilirubin and INR in (a) fetal adversities and (b) maternal adversities.
| Gastroenterology Research, ISSN 1918-2805 print, 1918-2813 online, Open Access |
| Article copyright, the authors; Journal compilation copyright, Gastroenterol Res and Elmer Press Inc |
| Journal website http://www.gastrores.org |
Original Article
Volume 10, Number 1, February 2017, pages 21-27
Predictors of Fetal and Maternal Outcome in the Crucible of Hepatic Dysfunction During Pregnancy
Figure
Tables
| PEC/EC | HELLP | ICP | HG | AFLP | |
|---|---|---|---|---|---|
| ALT: alanine aminotransferase; STB: serum total bilirubin; PEC/EC: preeclampsia/eclampsia; HELLP: hemolysis, elevated liver enzymes, low platelets; AFLP: acute fatty liver of pregnancy; ICP: intrahepatic cholestasis of pregnancy; HG: hyperemesis gravidarum. | |||||
| Incidence | 3% | 0.2-0.8% | 0.1-0.2% | 0.3-2% | 0.008% |
| Maternal mortality | 15-20% | 1.1-3.4% | Unknown | Rare | 12.5-18% |
| Fetal mortality | 13-30% | 6-70% | 8-35% | Rare | 7-66% |
| LFT derangement | 20-30% | 40-50% | 60-90% | 40-50% | 100% |
| Occurrence (trimester) | Second/third | Third | Second/third | First | Third |
| ALT | × 2 to × 5 | × 2 to × 30 | × 1.5 to × 8 | × 2 to × 5 | × 3 to × 15 |
| STB (mg/dL) | < 5 | 1.5-10x | < 6 | < 4 | 4-15x |
| Age | ||||||
|---|---|---|---|---|---|---|
| < 21 (N = 29) | 21 - 25 (N = 89) | 26 - 30 (N = 62) | 31 - 35 (N = 11) | > 35 (N = 6) | Total (%) (N = 197) | |
| BOH: bad obstetric history; CLD: chronic liver disease. | ||||||
| Demographics | ||||||
| Primigravida | 28 (97%) | 58 (65%) | 32 (52%) | 2 (18%) | 2 (33%) | 122 (62%) |
| Booked | 23 (79%) | 81 (91%) | 58 (94%) | 11 (100%) | 6 (100%) | 179 (91%) |
| BOH | 1 (3%) | 18 (20%) | 25 (40%) | 6 (54%) | 3 (50%) | 53 (27%) |
| Hypothyroidism | 2 (7%) | 9 (10%) | 16 (26%) | 2 (18%) | 3 (50%) | 32 (16%) |
| Anemia | 11 (38%) | 31 (35%) | 25 (40%) | 1 (9%) | 4 (67%) | 72 (37%) |
| Diabetes | 1 (3%) | 8 (9%) | 2 (3%) | 1 (9%) | 2 (33%) | 14 (7%) |
| Twin pregnancy | - | 3 (3%) | 1 (2%) | 1 (9%) | 1 (17%) | 6 (3%) |
| Cesarean | 18 (62%) | 69 (78%) | 49 (79%) | 9 (81%) | 5 (83%) | 150 (76%) |
| Causality | ||||||
| Pre-eclampsia | 11 (38%) | 50 (56%) | 39 (63%) | 8 (73%) | 5 (83%) | 113 (57%) |
| Eclampsia | 9 (31%) | 18 (20%) | 7 (11%) | 2 (18%) | 1 (17%) | 37 (19%) |
| HELLP | 2 (7%) | 9 (10%) | 4 (6%) | - | - | 15 (8%) |
| Viral infection | 2 (7%) | 4 (4%) | 5 (8%) | 1 (9%) | - | 12 (6%) |
| Hyperemesis | 2 (7%) | 4 (4%) | 3 (5%) | - | - | 9 (5%) |
| ICP | 2 (7%) | 3 (3%) | 3 (5%) | - | - | 8 (4%) |
| CLD | - | 1 (1%) | 1 (2%) | - | - | 2 (1%) |
| Sepsis | 1 (3%) | - | - | - | - | 1 (0.5%) |
| PEC (N = 113) | EC (N = 37) | HELLP (N = 15) | V (N = 12) | HG (N = 9) | ICP (N = 8) | CLD (N = 2) | S (N = 1) | Total (N = 197) | |
|---|---|---|---|---|---|---|---|---|---|
| Demographics | |||||||||
| Age, median (IQR) | 25 (23 - 28) | 23 (21 - 26) | 23 (22 - 29) | 26 (22 - 29) | 24 (21 - 29) | 25 (20 - 28) | 24 | 19 | 25 (22 - 28) |
| Primigravida | 68 (60%) | 25 (68%) | 9 (60%) | 7 (58%) | 6 (67%) | 5 (63%) | 1 (50%) | 1 (100%) | 122 (62%) |
| BOH | 32 (28%) | 5 (14%) | 5 (33%) | 5 (42%) | 2 (22%) | 3 (38%) | 1 (50%) | - | 53 (27%) |
| Diabetes | 10 (9%) | 1 (3%) | 0 | - | - | 3 (38%) | 0 | - | 14 (7%) |
| Hypothyroidism | 22 (19%) | 3 (8%) | 2 (13%) | - | 1 (11%) | 3 (38%) | 1 (50%) | - | 32 (16%) |
| Obesity | 12 (11%) | - | 1 (7%) | - | 1 (11%) | 1 (13%) | - | - | 15 (8%) |
| Symptoms | |||||||||
| Headache | 21 (19%) | 9 (24%) | 5 (33%) | 2 (17%) | 1 (11%) | - | - | - | 38 (19%) |
| Nausea/vomiting | 15 (13%) | 6 (16%) | 7 (46%) | 3 (25%) | 9 (100%) | 1 (13%) | 1 (50%) | 1 (100%) | 43 (22%) |
| Pruritus | 27 (24%) | 5 (14%) | 3 (20%) | 7 (58%) | - | 8 (100%) | 1 (50%) | - | 51 (26%) |
| Jaundice | 2 (2%) | 2 (5%) | 3 (20%) | 10 (83%) | - | 2 (25%) | 1 (50%) | 1 (100%) | 21 (11%) |
| Abruptio placentae | 1 (1%) | - | 2 (13%) | - | - | - | - | 1 (100%) | 4 (2%) |
| Renal dysfunction | 2 (2%) | 2 (5%) | 1 (7%) | - | - | - | - | 1 (100%) | 6 (3%) |
| STB | AST | ALT | INR | Hb% | PLT | |
|---|---|---|---|---|---|---|
| PLT: platelet count. | ||||||
| Pre-eclampsia | 1.2 (0.9 - 1.4) | 48 (45 - 52) | 56 (52 - 60) | 1 (0.9 - 1.1) | 12.2 (10.3 - 12.7) | 2.1 (1.75 - 2.5) |
| Eclampsia | 1.4 (1.3 - 1.5) | 53 (44 - 61) | 60 (51 - 67) | 1.1 (1 - 1.5) | 12.4 (10.7 - 13) | 1.9 (1.4 - 2.4) |
| HELLP | 1.3 (1 - 1.5) | 108 (88 - 136) | 130 (97 - 152) | 1 (0.9 - 1.1) | 10.2 (9.7 - 12.7) | 1 (0.9 - 1.2) |
| Viral infection | 2.8 (2.6 - 3.1) | 192 (87 - 317) | 216 (93 - 348) | 1.2 (1 - 1.6) | 12.1 (10.7 - 12.9) | 1.9 (1.2 - 2.1) |
| Hyperemesis | 0.9 (0.9 - 1.1) | 50 (47 - 57) | 55 (51 - 67) | 1 (0.9 - 1) | 12.9 (12.4 - 13.2) | 2.2 (1.9 - 2.5) |
| ICP | 1.1 (1 - 2.2) | 59 (53 - 66) | 66 (60 - 70) | 0.9 (0.9 - 1) | 12.7 (11.2 - 13.4) | 1.9 (1.3 - 2.3) |
| CLD | 2.1 | 40 | 48 | 1.3 | 9 | 1 |
| Sepsis | 2.8 | 131 | 142 | 1.1 | 7.7 | 1.8 |
| Adverse events | ||||||
| Fetal | 1.5 (1.4 - 2.7) | 61 (52 - 94) | 70 (58 - 107) | 1.1 (1 - 1.6) | 11 (9 - 13) | 1.3 (1 - 2) |
| Maternal | 3.3 (2.9 - 4.5) | 131 (100 - 217) | 142 (110 - 253) | 1.1 (1 - 2) | 8.8 (8 - 11) | 0.8 (0.4 - 1.3) |
| PEC (N = 118) | EC (N = 37) | HELLP (N = 15) | V (N = 12) | HG (N = 9) | ICP (N = 9) | CLD (N = 2) | S (N = 1) | Total (N = 203) | |
|---|---|---|---|---|---|---|---|---|---|
| ICU: intensive care unit; LBW: low birth weight; FDR: fetal death rate; NICU: neonatal intensive care unit. | |||||||||
| Fetal outcome (N = 203) | |||||||||
| Single fetus | 108 (92%) | 37 (100%) | 15 (100%) | 12 (100%) | 9 (100%) | 7 (78%) | 2 (100%) | 1 (100%) | 191 (94%) |
| Male fetus | 64 (54%) | 19 (51%) | 5 (33%) | 7 (58%) | 4 (44%) | 3 (33%) | 2 (100%) | 1 (100%) | 105 (52%) |
| Pre-term | 52 (44%) | 18 (49%) | 10 (67%) | 1 (8%) | 2 (22%) | - | 2 (100%) | 1 (100%) | 86 (42%) |
| LBW | 75 (64%) | 27 (73%) | 14 (93%) | 4 (33%) | 2 (22%) | 2 (22%) | 2 (100%) | 1 (100%) | 127 (63%) |
| Infant death | 8 (7%) | 9 (24%) | 3 (20%) | 1 (8%) | - | - | - | - | 21 (10%) |
| Miscarriage | 3 (3%) | 1 (3%) | 2 (13%) | - | - | - | - | - | 6 (3%) |
| Stillbirth | 5 (4%) | 4 (11%) | 2 (13%) | 1 (8%) | - | - | 1 (50%) | 1 (100%) | 14 (7%) |
| FDR | 16 (14%) | 14 (38%) | 7 (47%) | 2 (17%) | - | - | 1 (50%) | 1 (100%) | 41 (20%) |
| NICU | 30 (25%) | 16 (43%) | 6 (40%) | 1 (8%) | - | 1 | - | - | 54 (27%) |
| Maternal outcome (N = 197) | |||||||||
| Death | - | 2 (5%) | 2 (13%) | - | - | - | - | 1 (100%) | 5 (2.5%) |
| ICU | 1 | 4 | 4 | - | - | - | - | 1 | 10 (5%) |
| Cesarean | 89 (79%) | 31 (84%) | 10 (67%) | 12 (100%) | 2 (22%) | 3 (38%) | 2 (100%) | 1 (100%) | 150 (76%) |
| Maternal risk factor | Adverse fetal outcome | Adverse maternal outcome | ||
|---|---|---|---|---|
| Odds ratio | P value | Odds ratio | P value | |
| Primigravida | 0.95 | 1 | 0.4 | 0.37 |
| Hypothyroidism | 1.62 | 0.34 | 3.6 | 0.18 |
| Diabetes | 0.27 | 0.3 | - | 1 |
| Anemia | 2.16 | 0.03 | 7.29 | 0.06 |
| Thrombocytopenia | 3.47 | 0.0006 | 9.4 | 0.03 |
| Coagulopathy | 1.36 | 0.005 | 0.69 | 1 |
| Hyperbilirubinemia | 5.18 | 0.002 | 3.9 | 0.0001 |