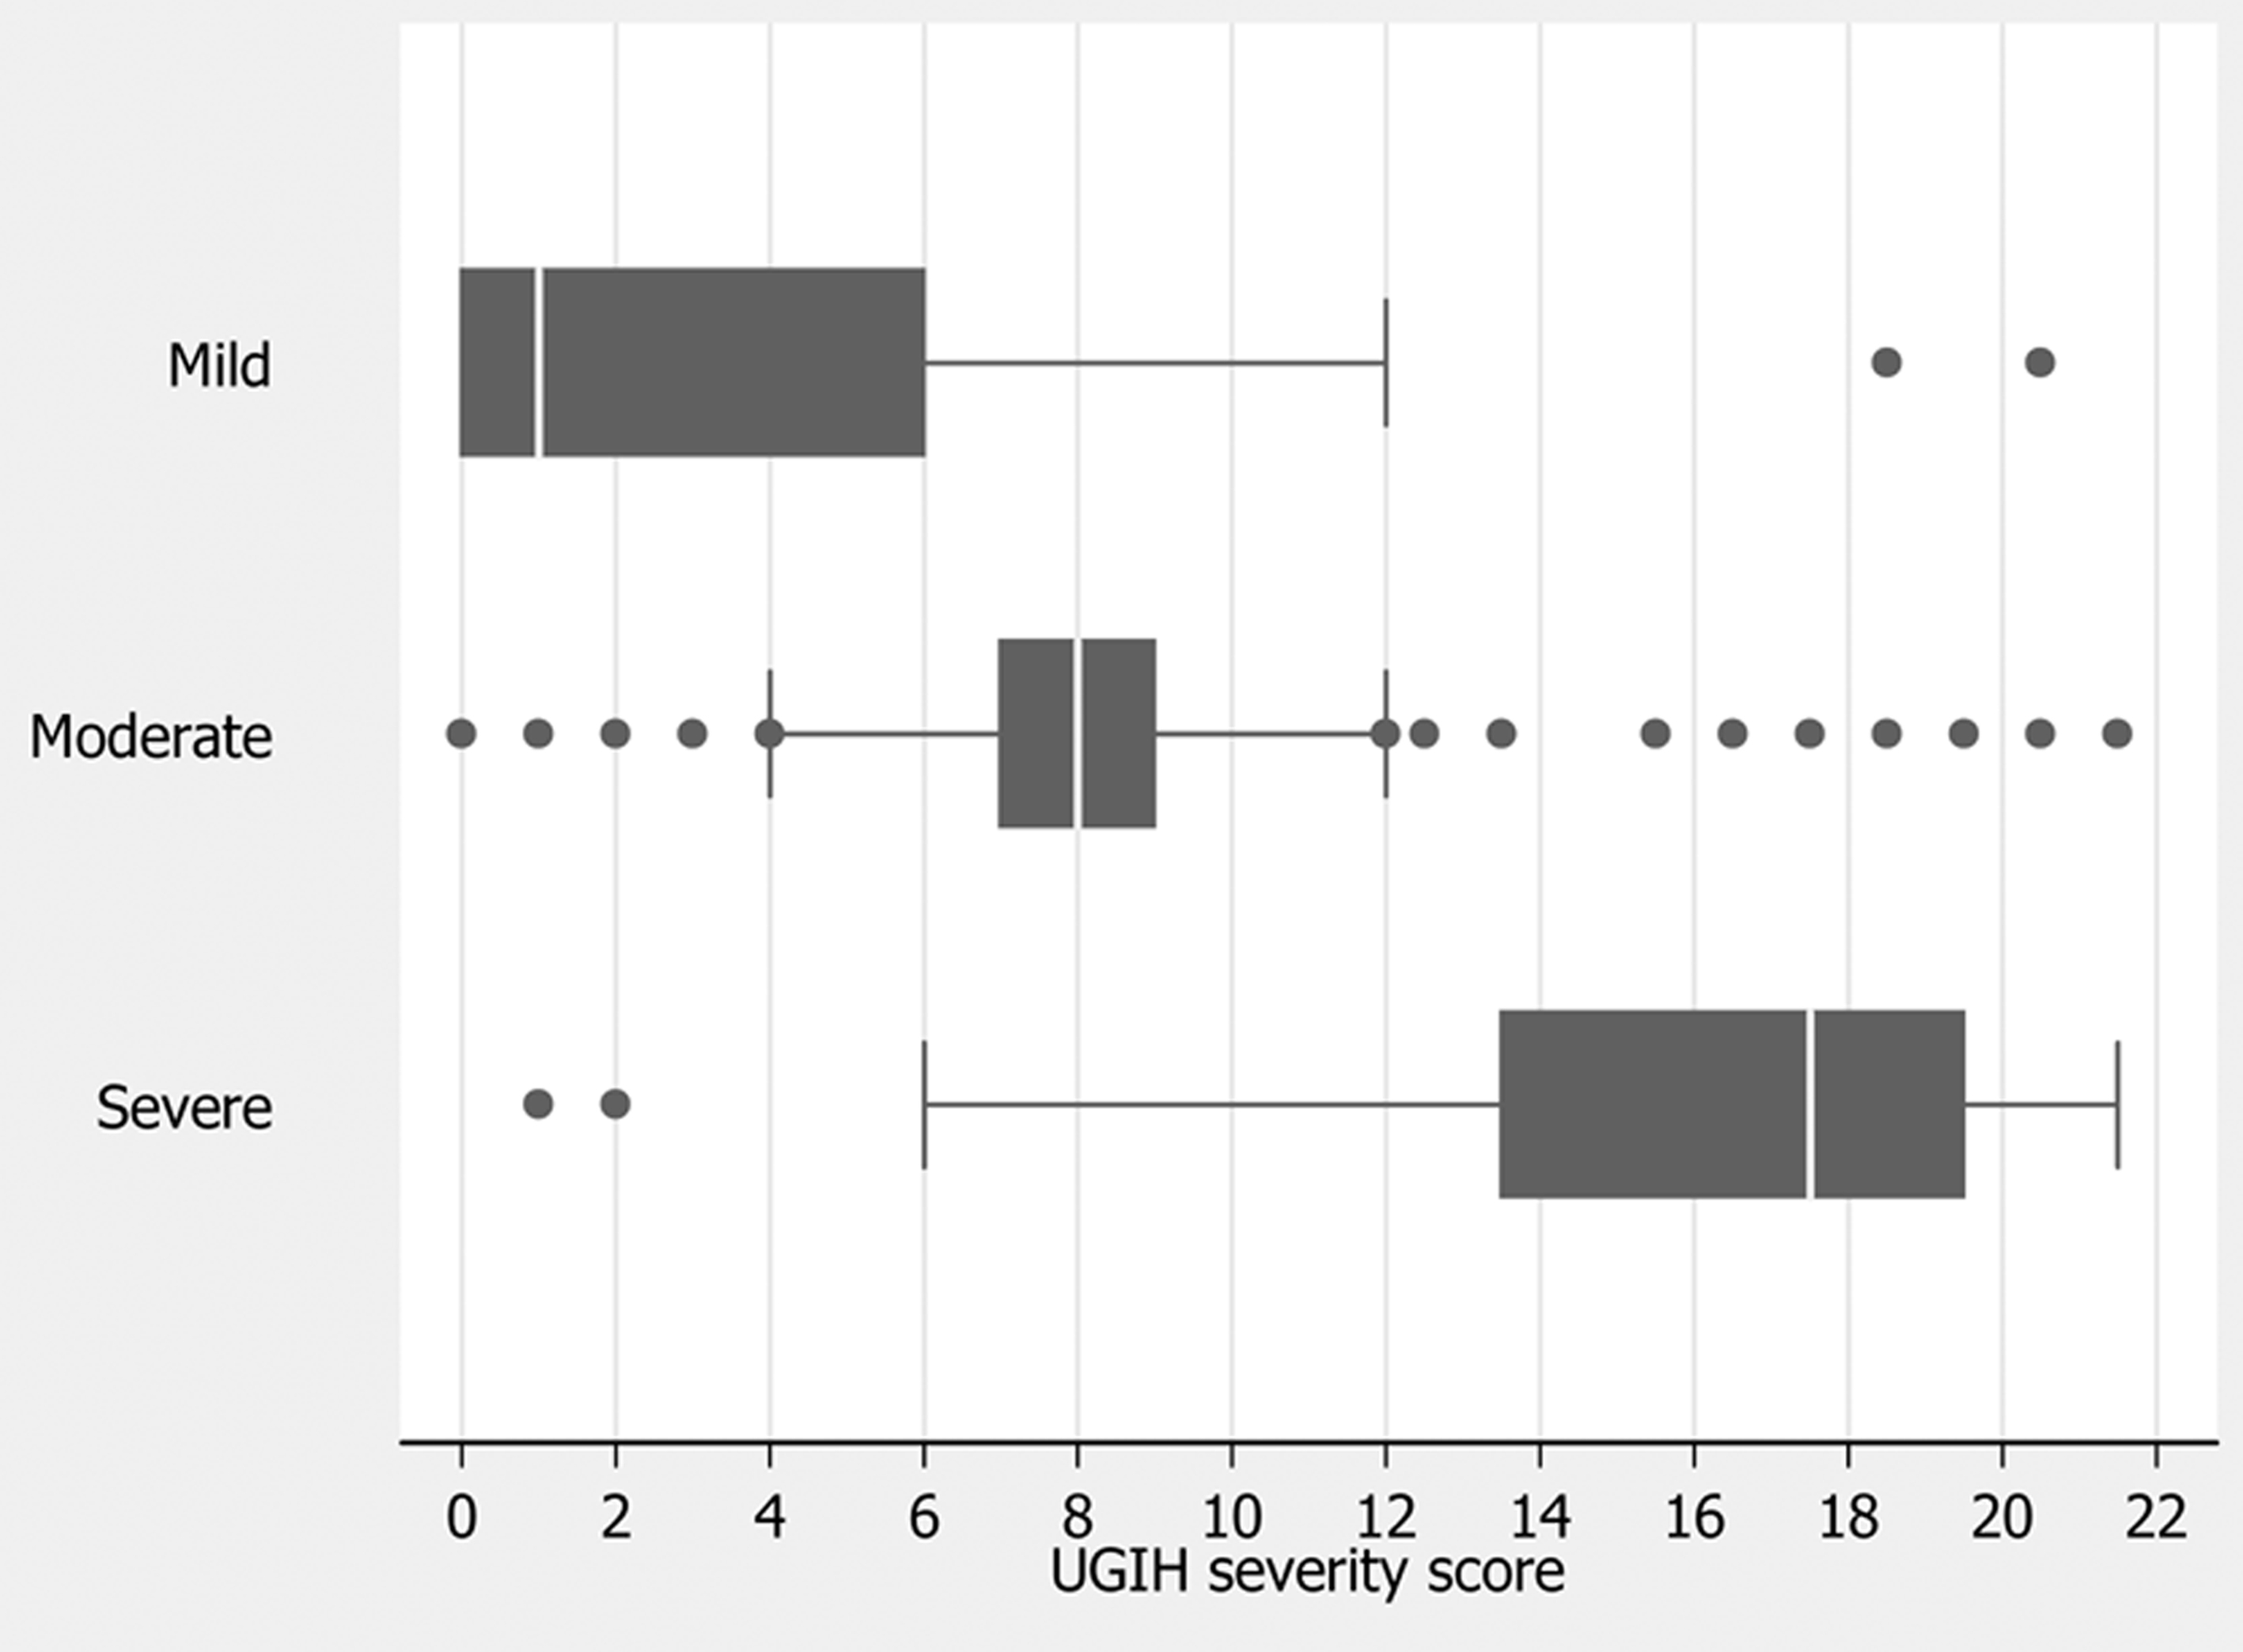
Figure 1. Distribution of UGIH severity scores by criterion-classified severity levels. Vertical lines in box represent medians. Box boundaries represent 25th and 75th percentiles.
| Gastroenterology Research, ISSN 1918-2805 print, 1918-2813 online, Open Access |
| Article copyright, the authors; Journal compilation copyright, Gastroenterol Res and Elmer Press Inc |
| Journal website http://www.gastrores.org |
Original Article
Volume 5, Number 6, December 2012, pages 219-226
Upper Gastrointestinal Hemorrhage: Development of the Severity Score
Figures
Tables
| Patient characteristics | Mild | Moderate | Severe | P-value* |
|---|---|---|---|---|
| n = 255 mean ± SD | n = 664 mean ± SD | n = 124 mean ± SD | ||
| *P-value from chi-squared for linear trends, or two-way ANOVA by rank. SD: standard deviation; SBP: systolic blood pressure; BUN: blood urea nitrogen. | ||||
| Demographics | ||||
| Male (n, %) | 175 (68.6) | 427 (64.3) | 87 (70.2) | 0.871 |
| Age (year) | 54.6 ± 18.0 | 60.4 ± 14.8 | 58.4 ± 14.2 | 0.010 |
| Mode of presentation (n, %) | ||||
| Hematemesis | 117 (45.9) | 299 (45.0) | 66 (53.2) | 0.315 |
| Coffee ground vomiting | 67 (26.3) | 114 (17.2) | 26 (21.0) | 0.048 |
| Hematochezia | 20 (7.8) | 40 (6.0) | 8 (6.5) | 0.462 |
| Melena | 113 (44.3) | 421 (63.4) | 69 (55.7) | 0.001 |
| Syncope | 28 (11.0) | 144 (21.7) | 34 (27.4) | < 0.001 |
| Hemodynamics | ||||
| Pulse (/min) | 89.8 ± 16.3 | 91.4 ± 15.7 | 93.1 ± 17.7 | 0.022 |
| SBP (mmHg) | 128.6 ± 21.6 | 120.6 ± 20.5 | 88.5 ± 17.0 | < 0.001 |
| Biochemicals | ||||
| Hemoglobin (g/dL) | 11.4 ± 2.4 | 7.0 ± 2.1 | 7.4 ± 2.9 | < 0.001 |
| BUN (mg/dL) | 23.9 ± 16.5 | 36.5 ± 21.7 | 37.6 ± 22.5 | < 0.001 |
| Co-morbidities (n, %) | ||||
| Cirrhosis | 14 (5.5) | 106 (16.0) | 28 (22.6) | < 0.001 |
| Hepatic failure | 0 (0) | 6 (0.9) | 2 (1.6) | 0.071 |
| Cardiac failure | 1 (0.4) | 6 (0.9) | 4 (3.2) | 0.024 |
| Renal failure | 4 (1.6) | 53 (8.0) | 12 (9.7) | < 0.001 |
| Clinical outcomes (n, %) | ||||
| Re-bleeding | 6 (2.4) | 42 (6.3) | 18 (14.5) | < 0.001 |
| Dead | 0 (0) | 1 (0.2) | 24 (19.4) | < 0.001 |
| Predictors | Category | OR | 95% CI | P-value | Coefficient* | Score |
|---|---|---|---|---|---|---|
| *Coefficients from multivariable continuation ratio logistic regression. OR: odds ratio; CI: confidence interval; ref: reference category; BUN: blood urea nitrogen. | ||||||
| Age (year) | ≥ 60 | 1.57 | 1.13 - 2.18 | 0.007 | 0.45 | 1 |
| < 60 | 1.00 | ref | 0 | |||
| Pulse (/min) | ≥ 100 | 1.56 | 1.11 - 2.19 | 0.011 | 0.44 | 1 |
| < 100 | 1.00 | ref | 0 | |||
| Systolic pressure (mmHg) | < 100 | 97.49 | 54.86 - 173.25 | < 0.001 | 4.58 | 10.5 |
| ≥ 100 | 1.00 | ref | 0 | |||
| Hemoglobin (g/dL) | < 10 | 15.00 | 10.48 - 21.46 | < 0.001 | 2.71 | 6 |
| ≥ 10 | 1.00 | ref | 0 | |||
| BUN (mg/dL) | ≥ 35 | 2.22 | 1.57 - 3.14 | < 0.001 | 0.80 | 2 |
| < 35 | 1.00 | Ref | 0 | |||
| Cirrhosis | yes | 2.55 | 1.58 - 4.14 | < 0.001 | 0.94 | 2 |
| no | 1.00 | Ref | 0 | |||
| Hepatic failure | yes | 8.12 | 1.66 - 39.67 | 0.010 | 2.09 | 4.5 |
| no | 1.00 | ref | 0 | |||
| Score-classified urgency levels | Score range | Criterion-classified severity levels | Risk estimation validity* | |||||
|---|---|---|---|---|---|---|---|---|
| Mild | Moderate | Severe | Over | Correct | Under | |||
| n = 247 | n = 650 | n = 116 | (%) | (%) | (%) | |||
| *Percentage of total patients. SD: standard deviation; IQR: Inter-quartile range. | ||||||||
| Mean ± SD | 3.0 ± 3.5 | 8.3 ± 3.3 | 16.1 ± 4.2 | |||||
| IQR** | 0 - 6 | 7-9 | 13.5-19.5 | |||||
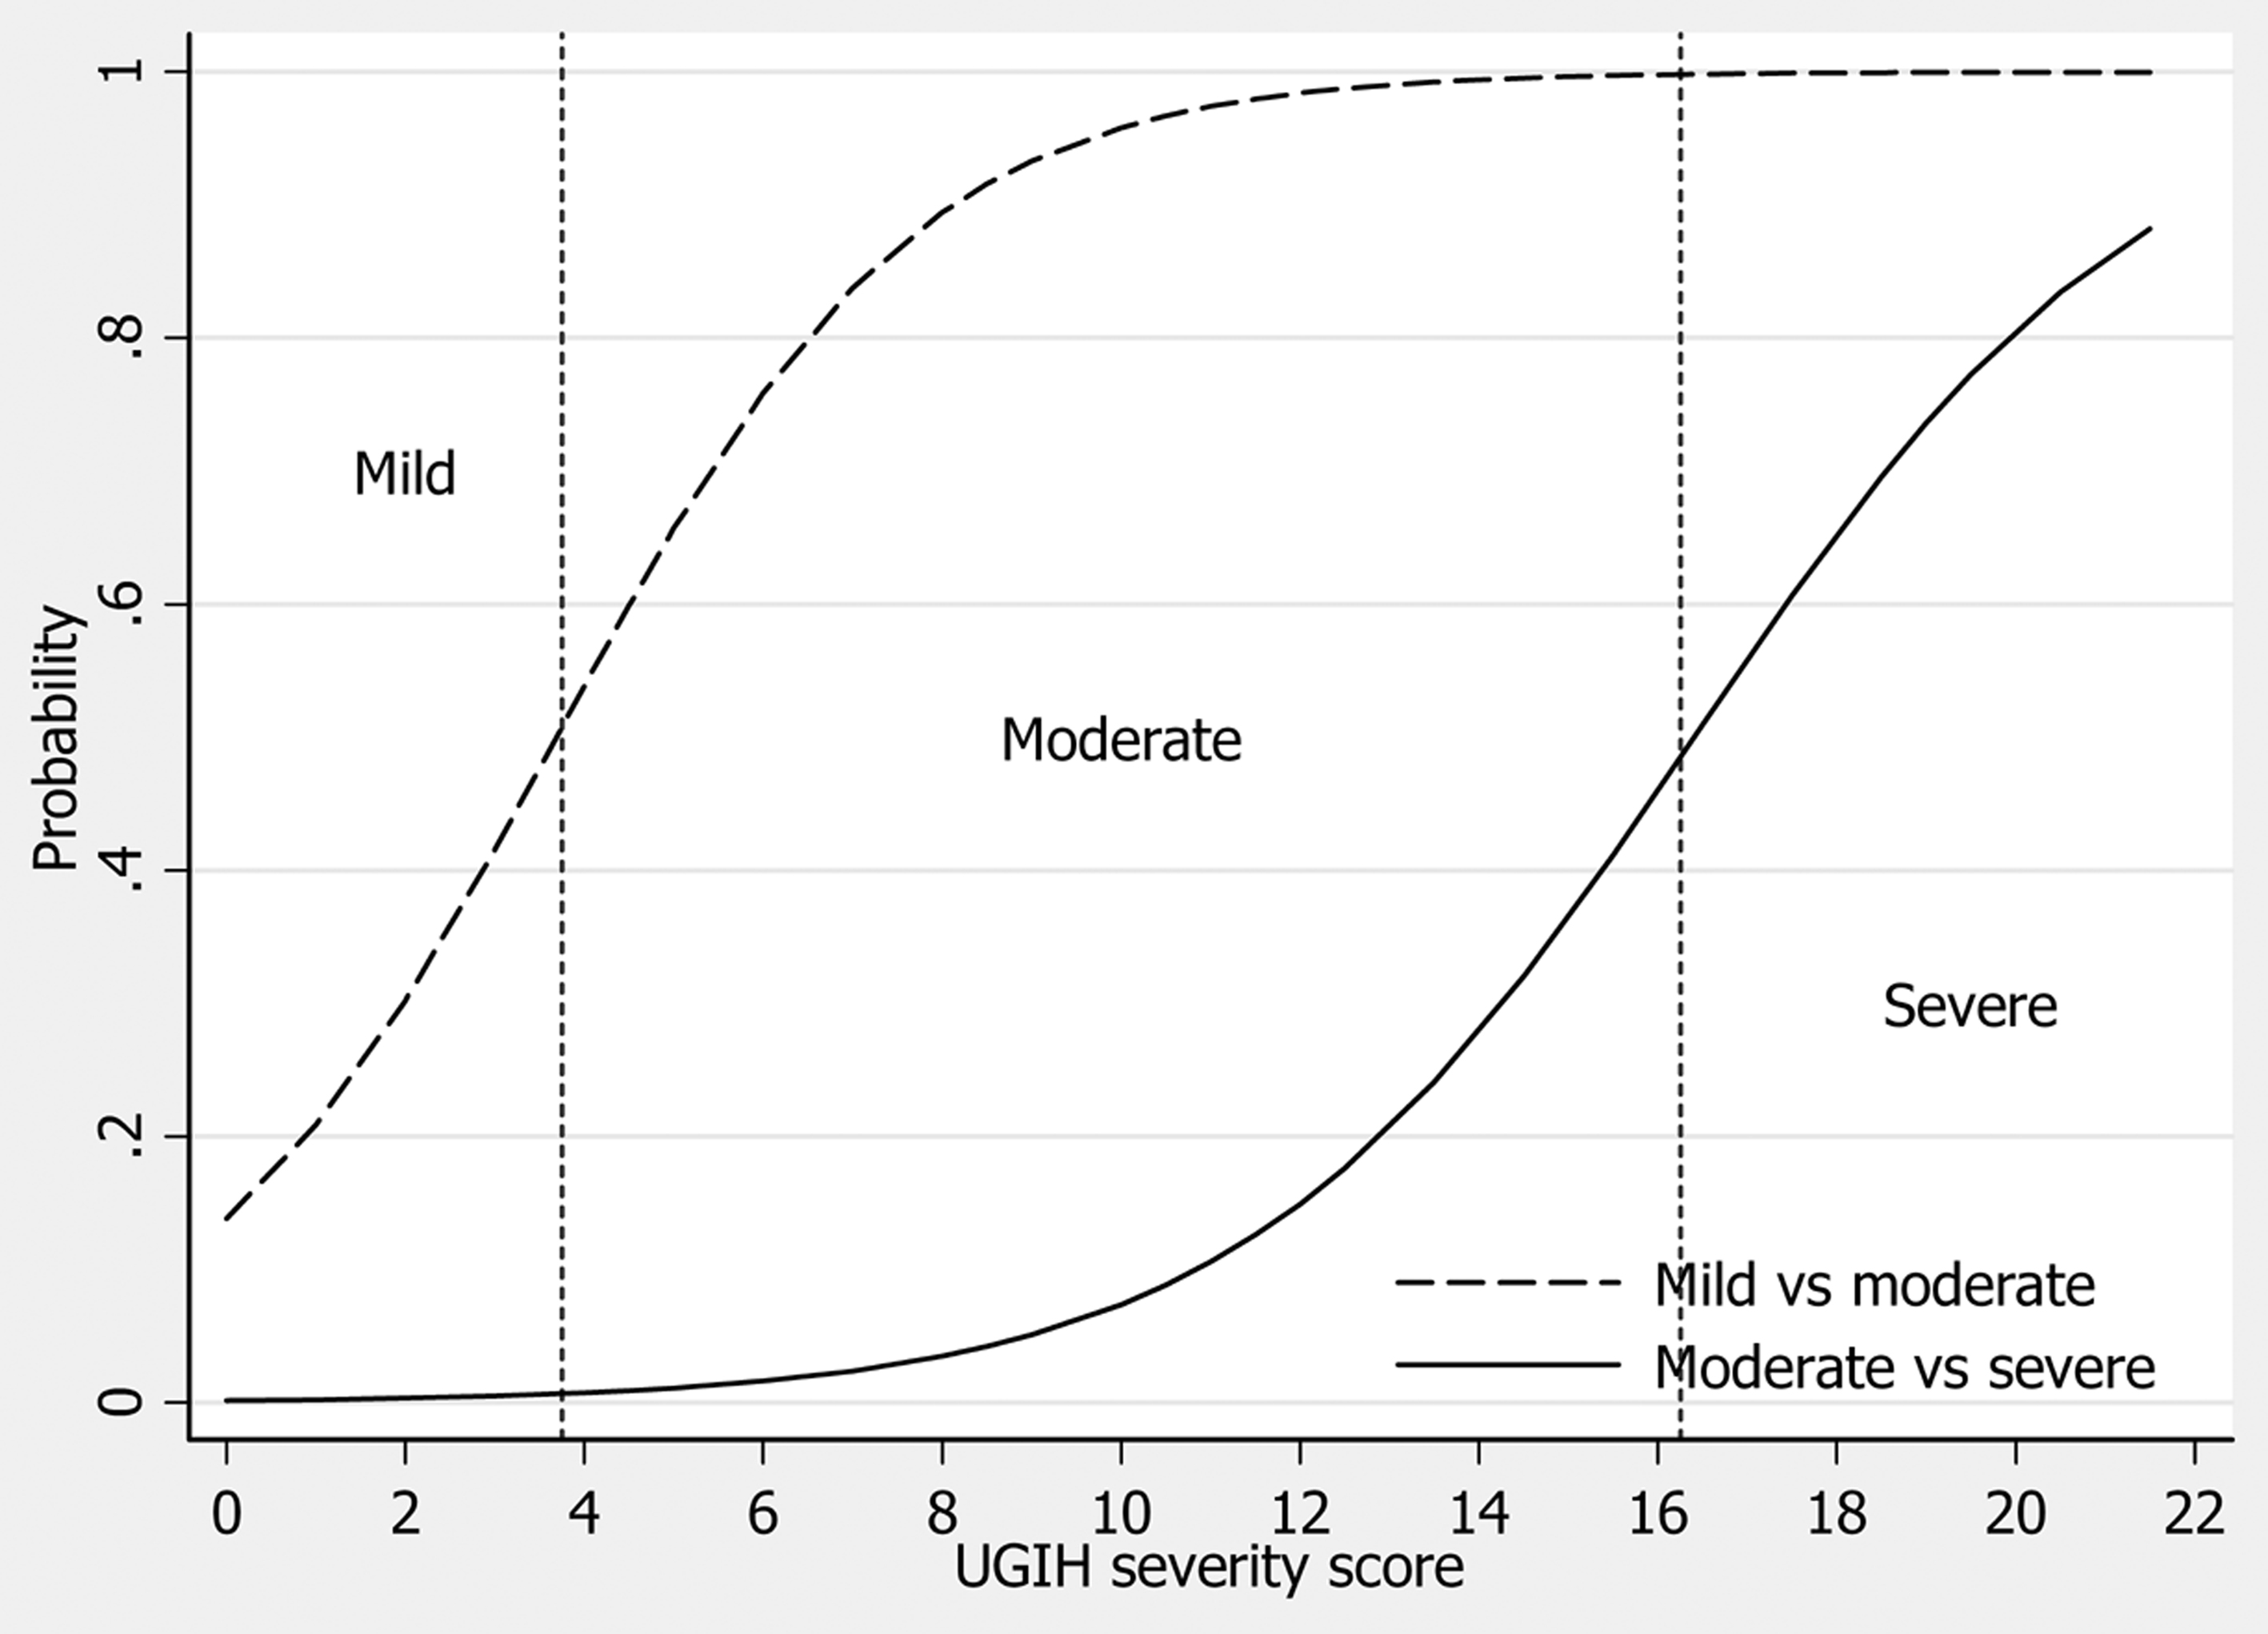
| Non-urgent | n = 215 | < 4 | 174 | 39 | 2 | - | 17.2 | 4.0 |
| Urgent | n = 677 | 4 - 16 | 71 | 571 | 35 | 7.0 | 56.4 | 3.5 |
| Emergent | n = 121 | > 16 | 2 | 40 | 79 | 4.1 | 7.8 | - |
| Total | 11.1 | 81.4 | 7.5 | |||||