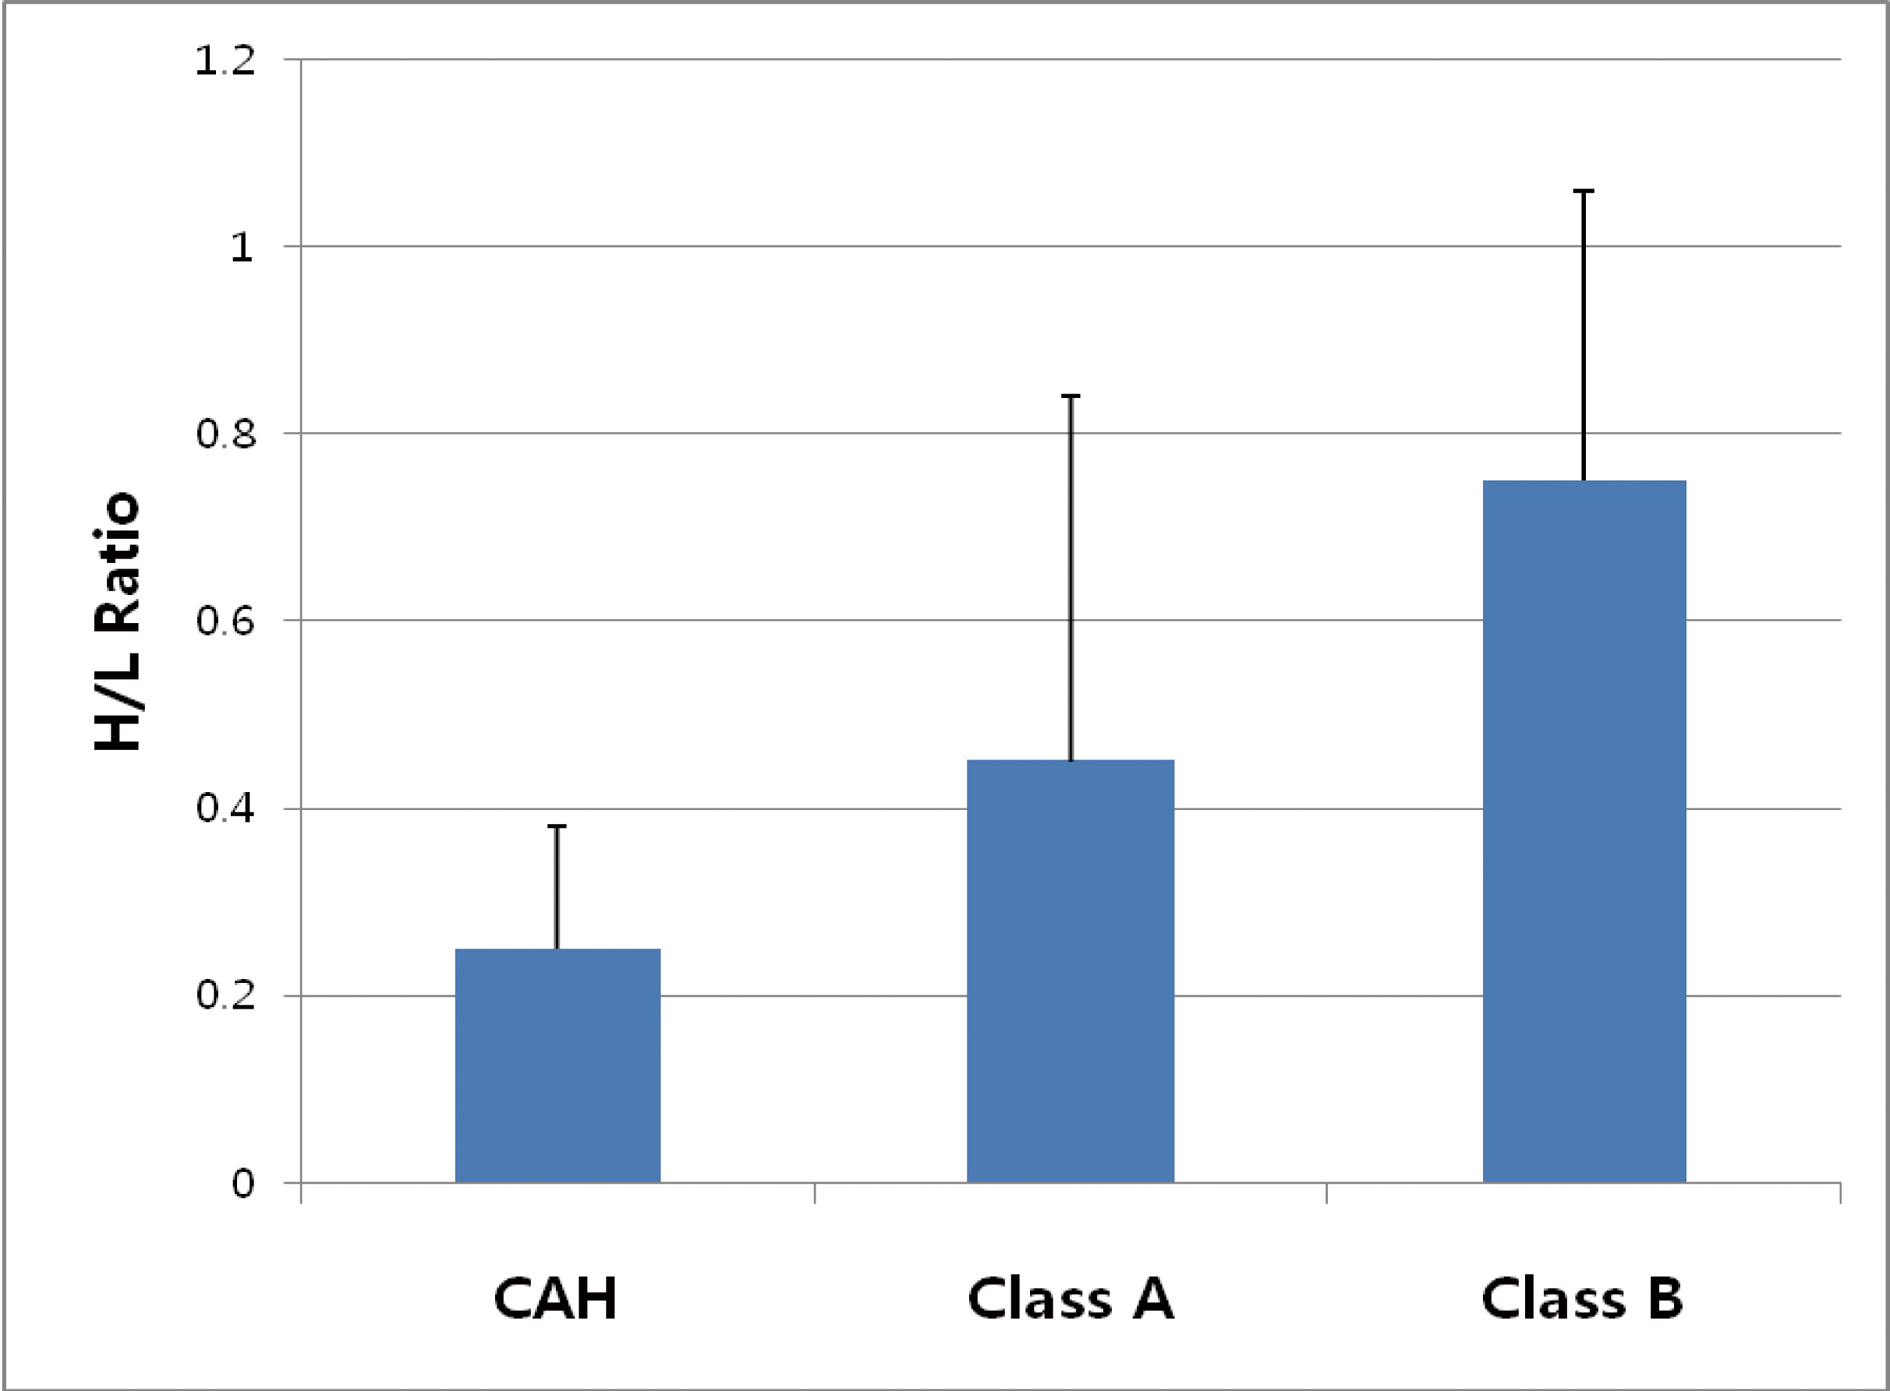
Figure 1. Mean values of H/L ratios of the patients. Asterisk (*) shows the significant difference among 3 groups by ANOVA (P < 0.01). CAH: chronic active hepatitis; Class A: Child-Pugh class A; Class B: Child-Pugh class B.
| Gastroenterology Research, ISSN 1918-2805 print, 1918-2813 online, Open Access |
| Article copyright, the authors; Journal compilation copyright, Gastroenterol Res and Elmer Press Inc |
| Journal website http://www.gastrores.org |
Original Article
Volume 5, Number 5, October 2012, pages 182-189
Abnormal Gas Diffusing Capacity and Portosystemic Shunt in Patients With Chronic Liver Disease
Figure
Tables
| Variables | CAH | Class A | Class B | Total | |
|---|---|---|---|---|---|
| The numbers of each variable among the groups were analyzed by Chi-square analysis at P < 0.05 level. CAH: chronic acute hepatitis; Class A: Child-Pugh Class A; Class B: Child-Pugh Class B; HBV: hepatitis B virus; HCV: hepatitis C virus. Asterisk (*) shows significant differences among the three groups in each variable by ANOVA at P < 0.05 level. ALT: alanine aminotransferase; AST: aspartate aminotransferase; TB: total bilirubin; PT: prothrombin time. | |||||
| Numbers of patients | 15 | 16 | 13 | 44 | |
| Age (years, mean ± SD) | 32.3 ± 8.5 | 47.2 ± 12.1 | 48.6 ± 10.3 | 40.3 ± 8.3 | |
| Gender (male/female) | 9/6 | 12/4 | 9/4 | 30/14 | |
| Etiology (numbers (%)) | |||||
| HBV induced | 14 (93.3) | 9 (56.3) | 12 (92.3) | 35 (79.5) | |
| HCV induced | 0 (0.0) | 4 (25.0) | 0 (0.0) | 4 (9.1) | |
| Alcohol-related | 1 (6.7) | 2 (12.5) | 1 (7.7) | 4 (9.1) | |
| Unknown | 0 (0.0) | 1 (6.3) | 0 (0.0) | 1 (2.3) | |
| Smoking status (numbers (%)) | |||||
| No smoking | 7 (46.7) | 6 (37.5) | 4 (30.7) | 17 (38.6) | |
| Former or current smoker | 8 (53.3) | 10 (62.5) | 9 (69.3) | 27 (61.4) | |
| Evaluation of chest radiography (numbers (%)) | |||||
| Normal | 14 (93.3) | 16(100.0) | 12 (92.3) | 42 (95.5) | |
| Abnormal | 1 (6.7) | 0 (0.0) | 1 (7.7) | 2 (4.5) | |
| Liver function test (Mean ± S.D) | |||||
| ALT (U/L) | 116.9 ± 86.6 | 61.6 ± 36.2 | 51.3 ± 33.9* | ||
| AST (U/L) | 69.3 ± 50.1 | 62.6 ± 36.2 | 60.2 ± 24.5 | ||
| TB (mg/dL) | 1.9 ± 0.7 | 1.1 ± 0.5 | 2.1 ± 0.8 | ||
| Albumin (g/dL) | 4.4 ± 0.6 | 4.4 ± 0.6 | 3.5 ± 0.6 | ||
| PT (%) | 95.8 ± 11.2 | 91.3 ± 12.9 | 64.9 ± 10.6* | ||
| Variables | CAH (n = 15) | Class A (n = 16) | Class B (n = 13) |
|---|---|---|---|
| * shows the significant differences among the three groups in each variable by ANOVA at P < 0.01 level. † and †† show the significant differences among the groups in each variable by Chi-square analysis at P < 0.05 and P < 0.01, respectively. FVC: forced vital capacity; FEV1: forced expiratory volume for 1 second; TLC: total lung capacity; DLco: diffusing capacity for carbon monoxide; VA: alveolar volume; PaO2: partial pressure of arterial oxygen; SaO2 : saturation of arterial oxygen. | |||
| Spirometry and Single breath technique (mean % of predicted value ± S.D.) | |||
| FVC | 91.7 ± 7.4 | 103.2 ± 11.9 | 98.2 ± 11.8 |
| FEV1 | 94.7 ± 8.9 | 98.0 ± 12.2 | 96.5 ± 10.4 |
| FEV1/FVC | 103.2 ± 4.9 | 94.9 ± 2.9 | 101.1 ± 7.8 |
| TLC | 91.9 ± 9.9 | 96.1 ± 10.8 | 94.9 ± 11.9 |
| DLco | 81.1 ± 11.9 | 77.7 ± 12.6* | 69.3 ± 9.4* |
| DLco/VA | 94.3 ± 9.6 | 85.4 ± 17.4* | 79.1 ± 8.4* |
| Arterial blood gas analysis | |||
| PaO2 (mmHg) | 96.3 ± 8.4 | 88.7 ± 13.6 | 88.1 ± 10.8 |
| SaO2 (%) | 98.2 ± 1.4 | 95.5 ± 4.8 | 96.5 ± 1.2 |
| Pulmonary function abnormality (case, %) | |||
| Diffusion impairment†† | 1 (6.7) | 4 (25.0) | 8 (61.5) |
| Restrictive defect | 2 (13.3) | 1 (6.3) | 1 (7.7) |
| Obstructive defect | 0 (0.0) | 0 (0.0) | 0 (0.0) |
| Total case (%)† | 3 (20.0) | 5 (31.3) | 9 (69.2) |
| Variables | FVC | FEV1 | FEV1/FVC | TLC | DLco | DLco/VA |
|---|---|---|---|---|---|---|
| All the data were presented as p-values by two-way ANOVA, and * shows the significant p-value under 0.05 level. † and †† show the significant correlations between pulmonary function such as spirometric indices and H/L ratio by Pearson’s correlation analysis at P < 0.05 and P < 0.001 levels, respectively. Disease category includes ‘chronic active hepatitis’, ‘Child-Pugh class A’ and ‘Child-Pugh class B’. Smoking status includes ‘nonsmokers’ and ‘former or current smokers’. Interaction means relationship between disease category and smoking status. | ||||||
| Disease Category | 0.022* | 0.679 | 0.012* | 0.538 | 0.044* | 0.013* |
| Smoking Status | 0.100 | 0.190 | 0.541 | 0.716 | 0.522 | 0.886 |
| Interaction | 0.072 | 0.244 | 0.316 | 0.612 | 0.538 | 0.547 |
| H/L ratio | 0.2653 | 0.089 | -0.3072† | 0.1666 | -0.3395† | -0.4801†† |