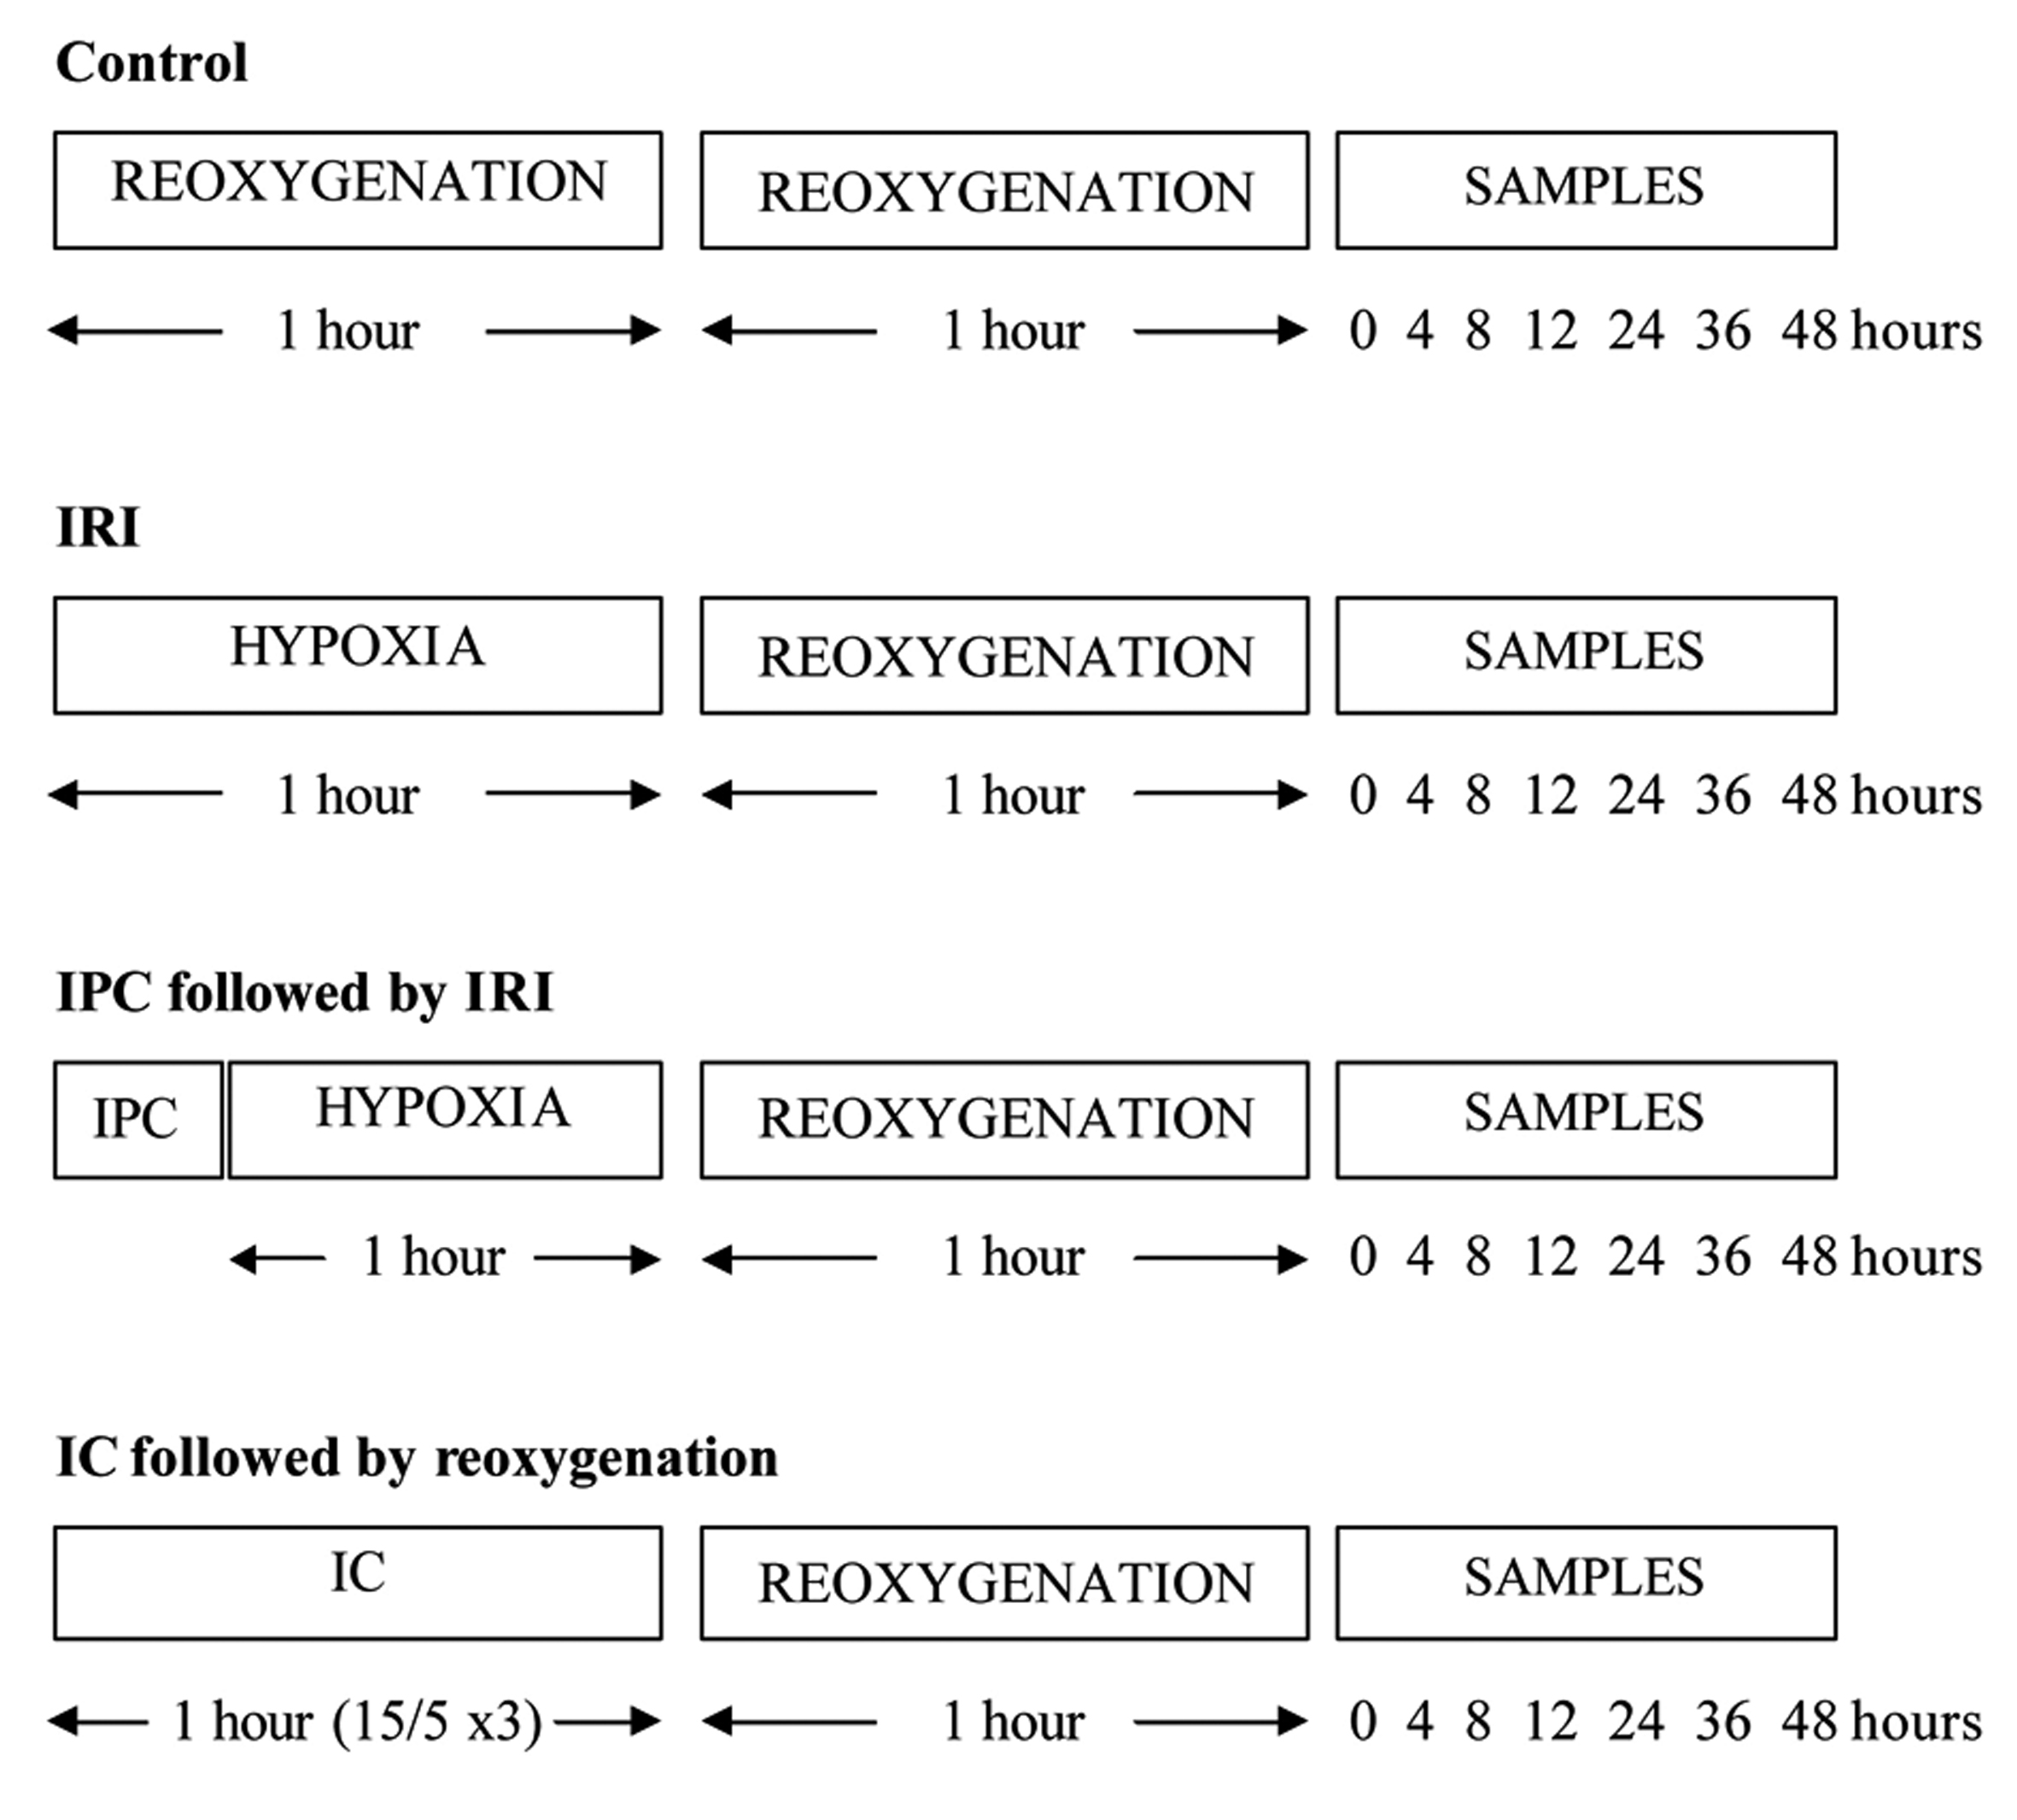
Figure 1. Ischaemia and reperfusion protocols used in this study.
| Gastroenterology Research, ISSN 1918-2805 print, 1918-2813 online, Open Access |
| Article copyright, the authors; Journal compilation copyright, Gastroenterol Res and Elmer Press Inc |
| Journal website http://www.gastrores.org |
Original Article
Volume 5, Number 3, June 2012, pages 85-96
Ischaemic Preconditioning and Intermittent Clamping Does not Influence Mediators of Liver Regeneration in a Human Liver Sinusoidal Endothelial Cell Model of Ischaemia-Reperfusion Injury
Figures
Tables
| Time (Hours) | Control (Mean (SEM) pg/mL) | IRI | IPC | IC | |||
|---|---|---|---|---|---|---|---|
| Mean (SEM) pg/mL | P-valueξ | Mean (SEM) pg/mL | P-valueβ | Mean (SEM) pg/mL | P-valueχ | ||
| ξ: P-value was derived from Mann Whitney U test between the IRI and control groups. β: P-value was derived from Mann Whitney U test between the IPC and IRI groups. χ: P-value was derived from Mann Whitney U test between the IC and IRI groups. NS: Not significant. | |||||||
| 0 | 4.14 (1.49) | 7.03 (1.57) | NS | 6.81 (1.61) | NS | 5.82 (1.25) | NS |
| 4 | 10.28 (1.24) | 30.34 (7.39) | 0.028 | 37.84 (9.39) | NS | 29.28 (7.35) | NS |
| 8 | 38.18 (9.90) | 60.36 (11.74) | NS | 66.79 (11.51) | NS | 69.85 (23.62) | NS |
| 12 | 45.49 (11.25) | 73.14 (14.75) | NS | 77.72 (14.71) | NS | 75.03 (17.78) | NS |
| 24 | 99.90 (35.02) | 156.80 (43.62) | NS | 139.68 (34.62) | NS | 156.50 (42.78) | NS |
| 36 | 180.62 (63.74) | 253.83 (86.50) | NS | 334.22 (145.38) | NS | 309.92 (106.77) | NS |
| 48 | 310.05 (126.36) | 449.89 (135.11) | NS | 572.22 (139.44) | NS | 662.78 (149.64) | NS |
| Time (Hours) | Control (Mean (SEM) pg/mL) | IRI | IPC | IC | |||
|---|---|---|---|---|---|---|---|
| Mean (SEM) pg/mL | P-valueξ | Mean (SEM) pg/mL | P-valueβ | Mean (SEM) pg/mL | P-valueχ | ||
| ξ: P-value was derived from Mann Whitney U test between the IRI and control groups. β: P-value was derived from Mann Whitney U test between the IPC and IRI groups. χ: P-value was derived from Mann Whitney U test between the IC and IRI groups. NS: Not significant. | |||||||
| 0 | 108.78 (26.72) | 118.58 (18.76) | NS | 99.63 (18.34) | NS | 100.43 (21.17) | NS |
| 4 | 384.67 (95.76) | 888.47 (332.47) | NS | 885.73 (281.69) | NS | 830.10 (262.55) | NS |
| 8 | 993.77 (303.52) | 1836.53 (750.05) | NS | 1833.00 (812.49) | NS | 1658.43 (552.36) | NS |
| 12 | 1480.26 (630.49) | 2318.59 (926.13) | NS | 2318.41 (873.36) | NS | 2244.22 (769.89) | NS |
| 24 | 2339.97 (866.46) | 3650.34 (1179.0) | NS | 3727.84 (308.26) | NS | 3811.90 (1282.7) | NS |
| 36 | 495.56 (177.68) | 528.10 (161.22) | NS | 613.32 (178.73) | NS | 695.27 (172.94) | NS |
| 48 | 686.15 (336.40) | 763.70 (366.15) | NS | 572.22 (139.44) | NS | 842.01 (238.24) | NS |
| Time (Hours) | Control (Mean (SEM) pg/mL) | IRI | IPC | IC | |||
|---|---|---|---|---|---|---|---|
| Mean (SEM) pg/mL | P-valueξ | Mean (SEM) pg/mL | P-valueβ | Mean (SEM) pg/mL | P-valueχ | ||
| ξ: P-value was derived from Mann Whitney U test between the IRI and control groups. β: P-value was derived from Mann Whitney U test between the IPC and IRI groups. χ: P-value was derived from Mann Whitney U test between the IC and IRI groups. NS: Not significant. | |||||||
| 0 | 3.79 (1.25) | 7.53 (1.55) | NS | 6.73 (1.20) | NS | 4.44 (0.60) | NS |
| 4 | 11.44 (5.91) | 25.67 (5.53) | NS | 22.47 (6.65) | NS | 19.90 (5.23) | NS |
| 8 | 40.61 (17.39) | 74.36 (22.74) | NS | 67.11 (23.69) | NS | 63.75 (20.32) | NS |
| 12 | 70.74 (31.93) | 108.61 (31.76) | NS | 92.37 (26.42) | NS | 101.80 (28.18) | NS |
| 24 | 159.52 (65.94) | 234.59 (73.61) | NS | 208.74 (59.72) | NS | 243.60 (63.22) | NS |
| 36 | 214.30 (88.84) | 330.58 (99.61) | NS | 392.03 (133.34) | NS | 432.04 (152.23) | NS |
| 48 | 306.84 (116.61) | 467.89 (128.72) | NS | 656.95 (253.13) | NS | 719.84 (268.52) | NS |
| Time (Hours) | Control (Mean (SEM) pg/mL) | IRI | IPC | IC | |||
|---|---|---|---|---|---|---|---|
| Mean (SEM) pg/mL | P-valueξ | Mean (SEM) pg/mL | P-valueβ | Mean (SEM) pg/mL | P-valueχ | ||
| ξ: P-value was derived from Mann Whitney U test between the IRI and control groups. β: P-value was derived from Mann Whitney U test between the IPC and IRI groups. χ: P-value was derived from Mann Whitney U test between the IC and IRI groups. NS: Not significant. | |||||||
| 0 | 2.57 (0.76) | 4.40 (0.56) | NS | 4.74 (1.83) | NS | 6.58 (2.36) | NS |
| 4 | 6.36 (2.83) | 13.40 (2.44) | NS | 19.34 (7.34) | NS | 21.88 (5.53) | NS |
| 8 | 16.86 (6.58) | 25.36 (5.06) | NS | 43.28 (16.26) | NS | 34.04 (11.41) | NS |
| 12 | 15.45 (3.19) | 35.56 (8.15) | NS | 49.16 (16.99) | NS | 47.00 (12.76) | NS |
| 24 | 28.65 (8.87) | 48.28 (11.38) | NS | 60.82 (23.02) | NS | 83.95 (25.26) | NS |
| 36 | 25.73 (8.20) | 62.64 (12.96) | NS | 119.69 (26.44) | NS | 132.00 (11.89) | NS |
| 48 | 110.16 (50.80) | 171.78 (50.19) | NS | 182.70 (39.07) | NS | 208.52 (27.50) | NS |