Figures
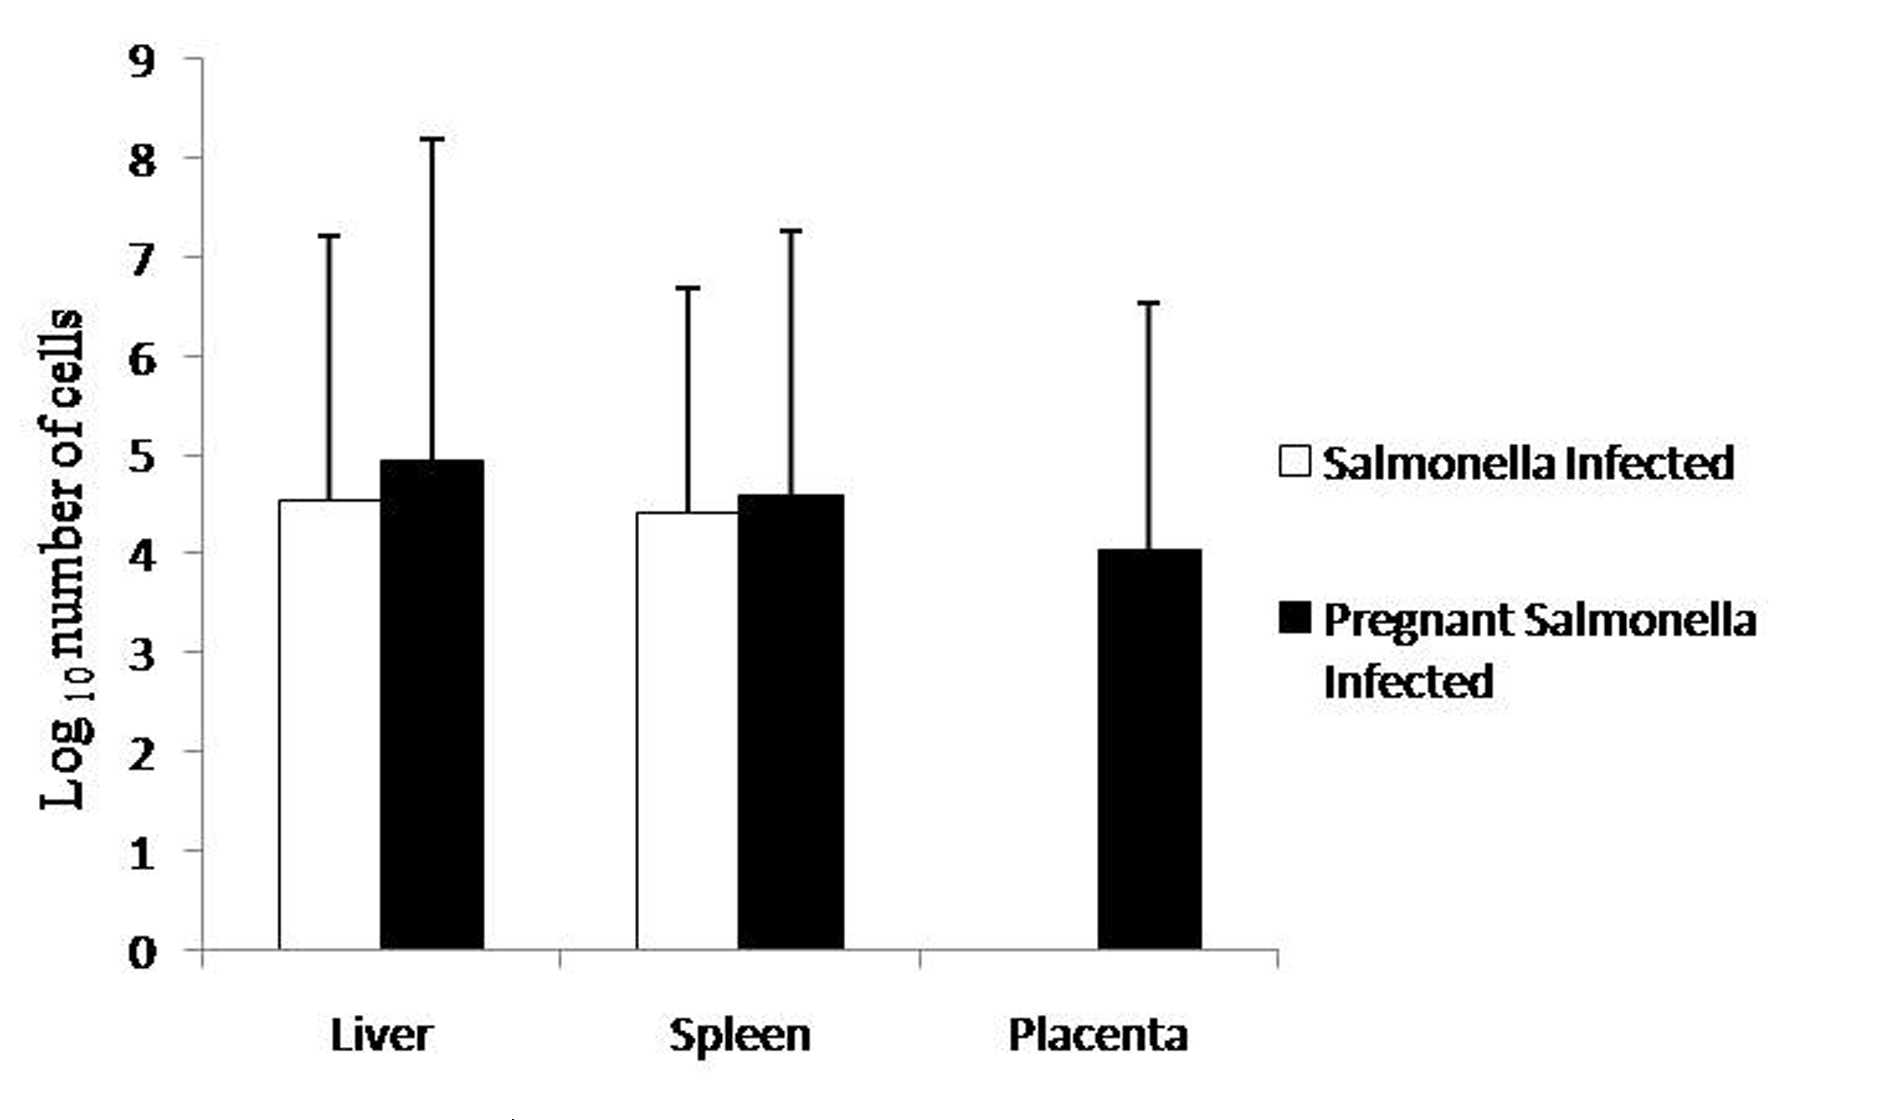
Figure 1. Bacterial Load in different organs. Values are expressed in log10 number of cells as Mean ± S.E.
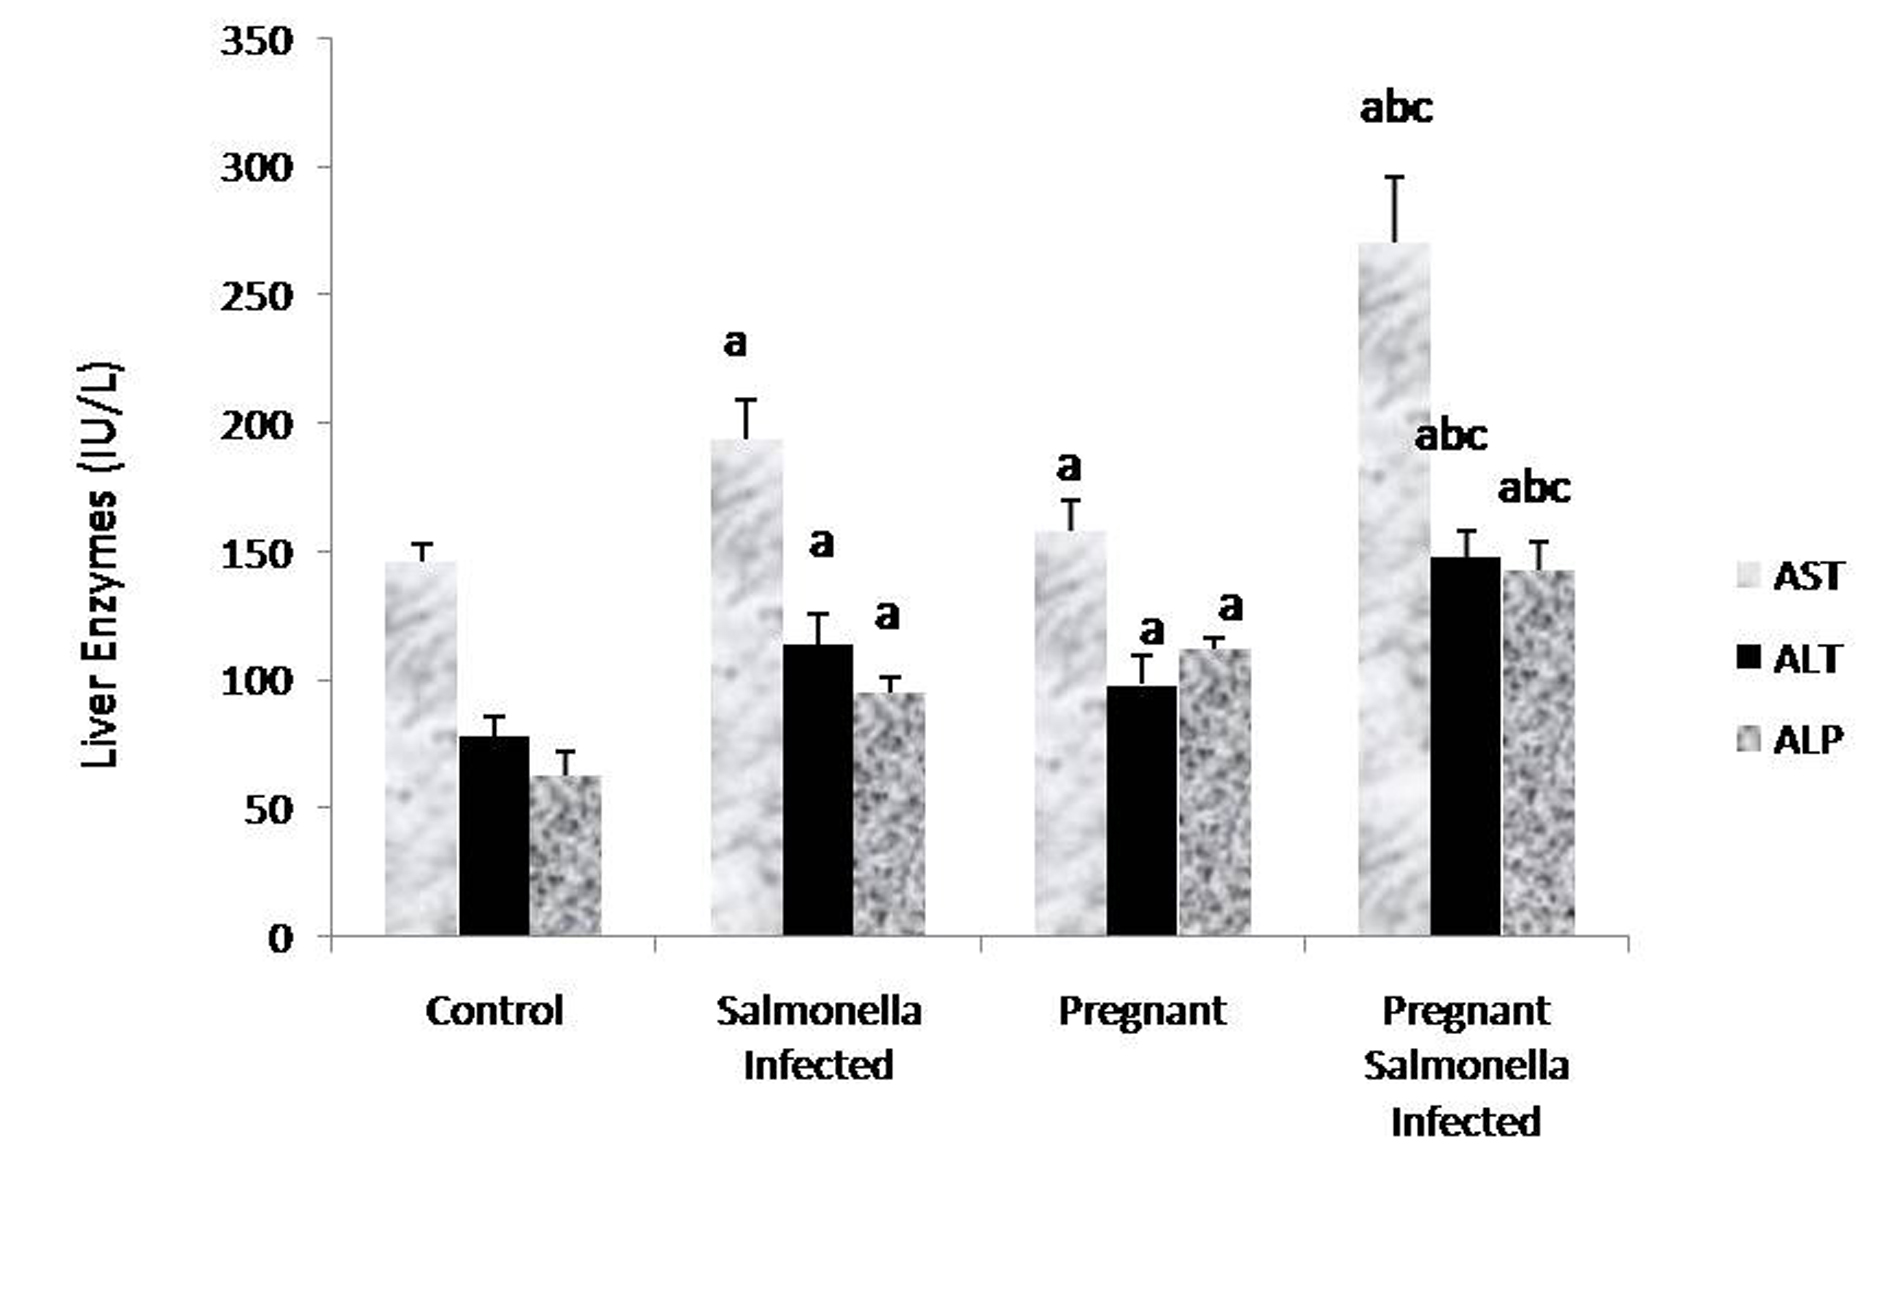
Figure 2. Liver enzymes (IU/L) in various groups. Values are expressed as Mean ± S.E. ‘a’ shows significant difference (P < 0.05) from control mice; ‘b’ shows significant difference (P < 0.05) from pregnant mice; ‘c’ shows significant difference (P < 0.05) from Salmonella-infected mice.
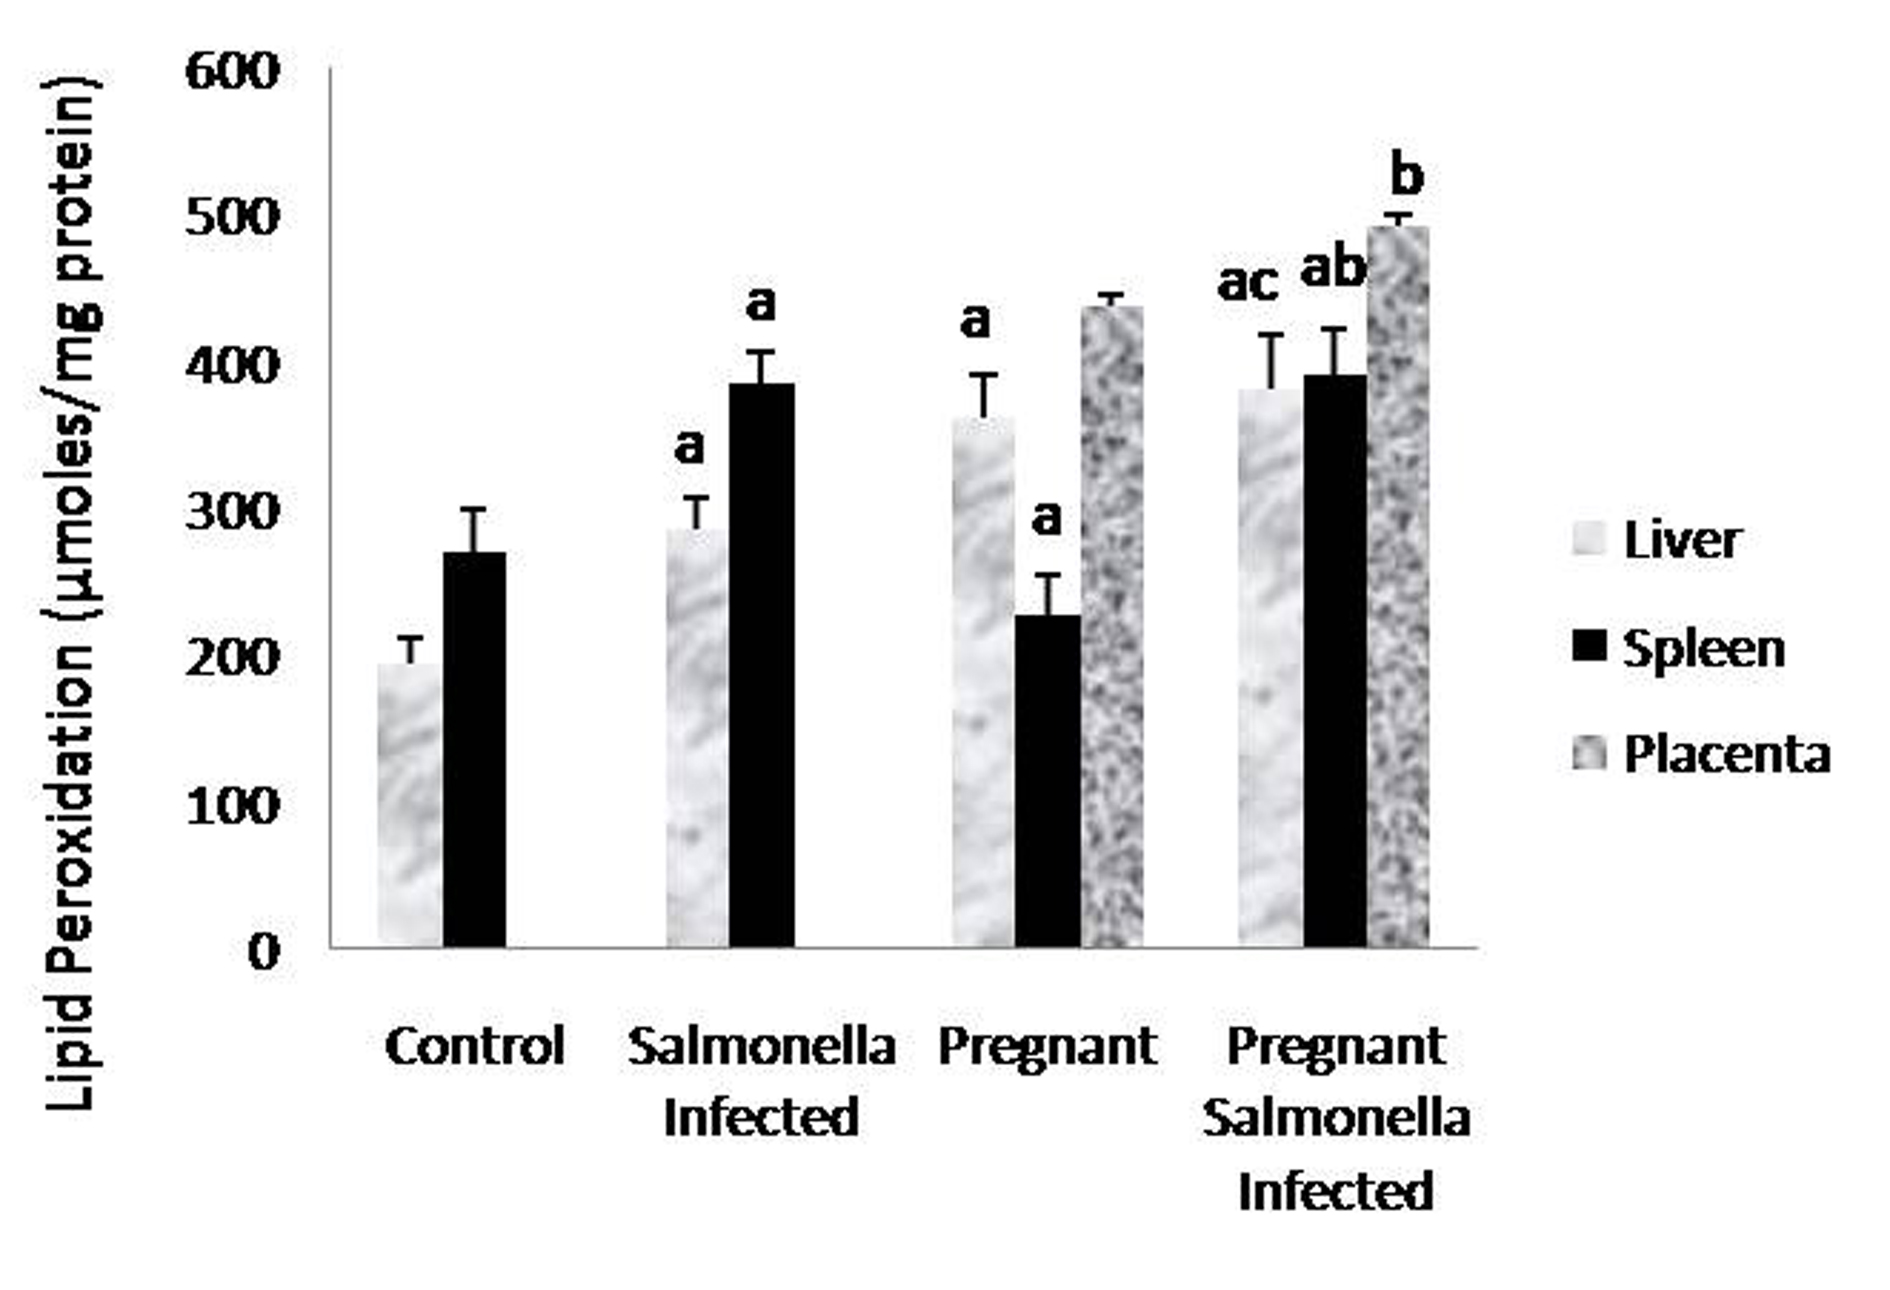
Figure 3. Lipid peroxidation (µmol/mg protein) in liver, spleen and placental homogenates of mice belonging to different groups. Values are expressed as Mean ± S.E. ‘a’ shows significant difference (P < 0.05) from control mice; ‘b’ shows significant difference (P < 0.05) from pregnant mice; ‘c’ shows significant difference (P < 0.05) from Salmonella-infected mice.
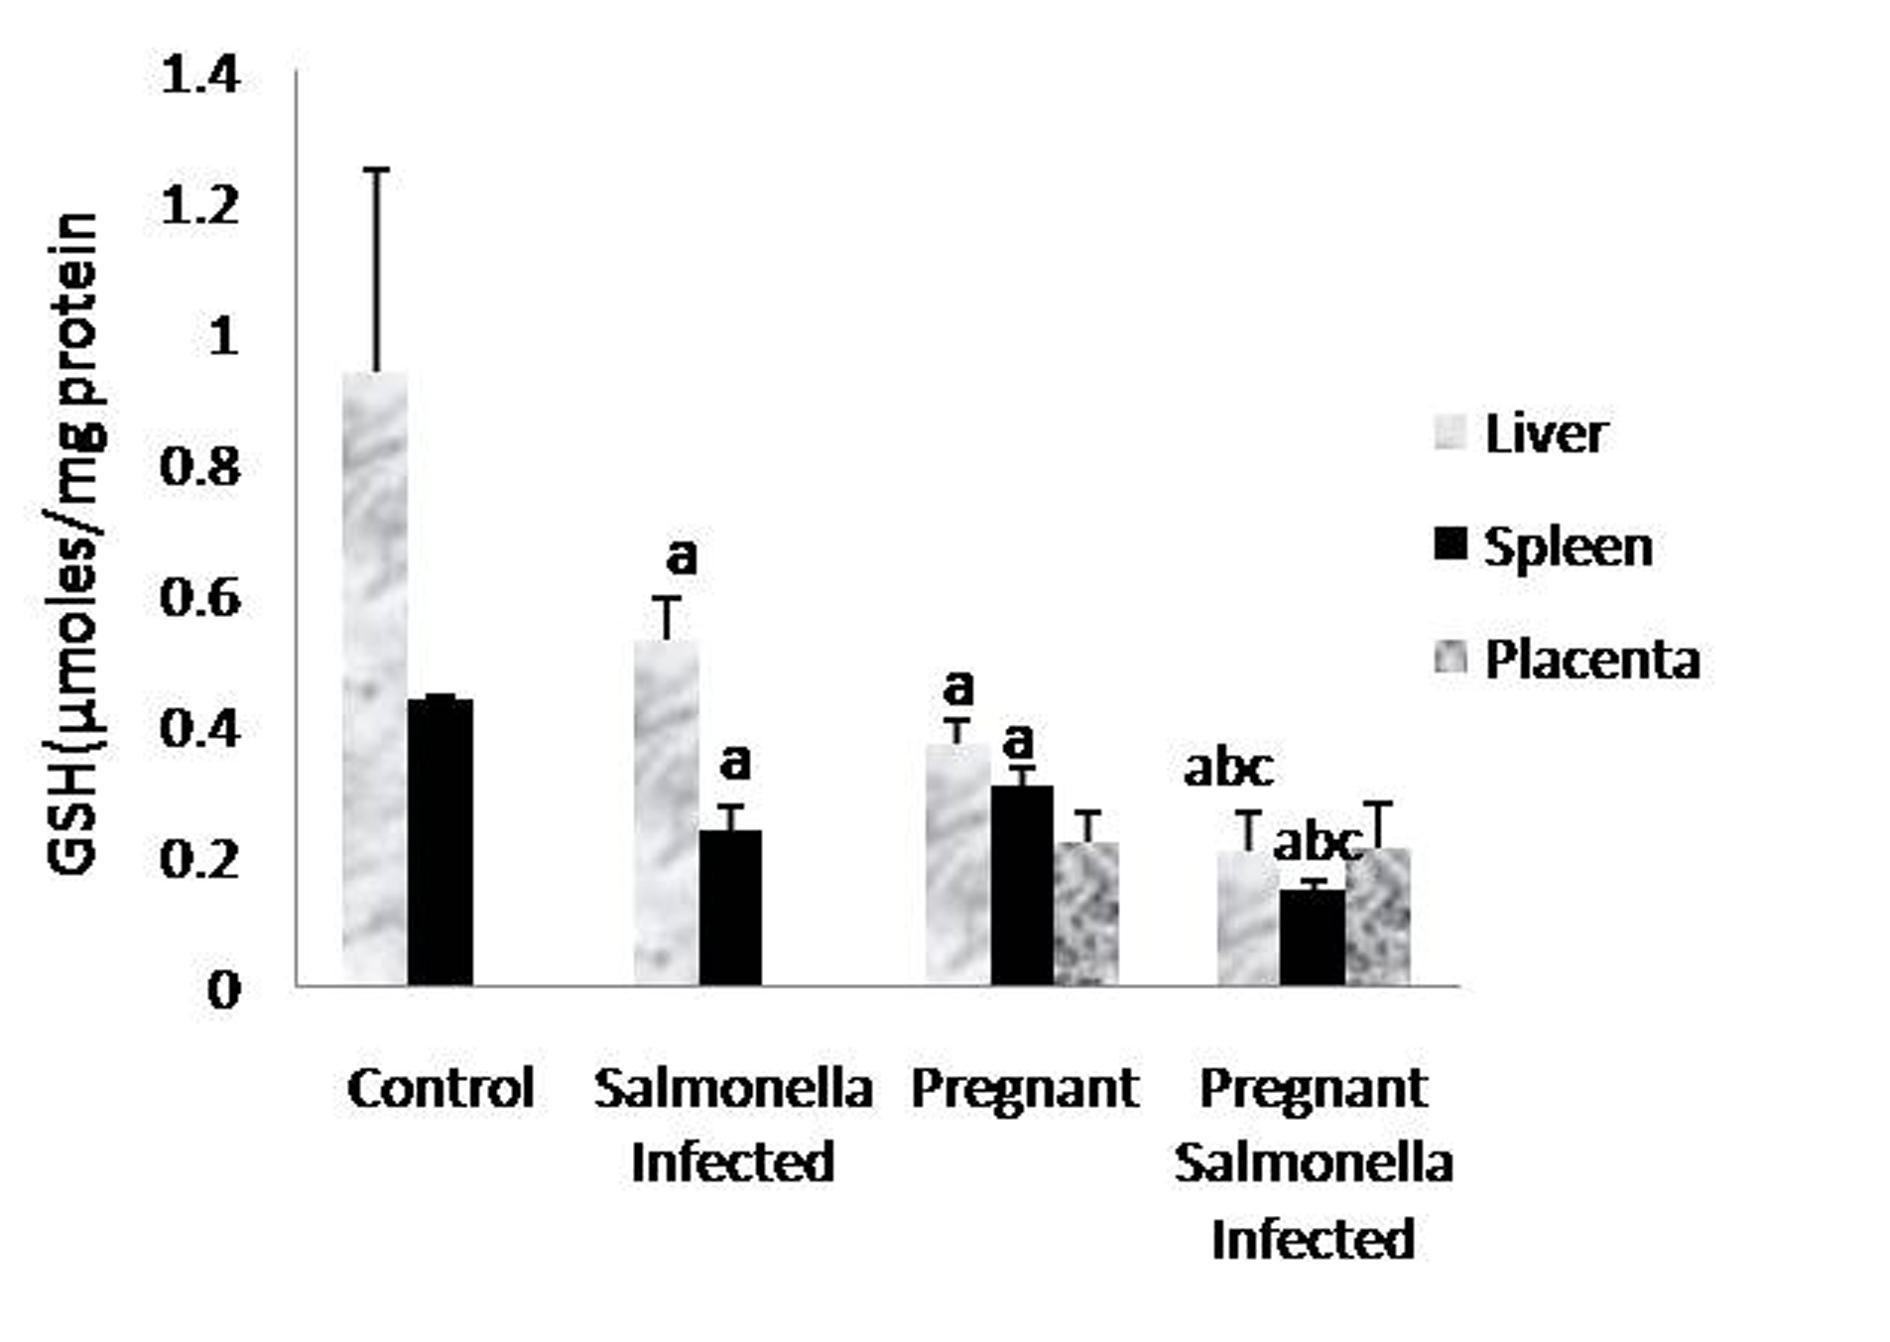
Figure 4. GSH levels (µmol/mg protein) in liver, spleen and placental homogenates of mice belonging to different groups. Values are expressed as Mean ± S.E. ‘a’ shows significant difference (P < 0.05) from control mice; ‘b’ shows significant difference (P < 0.05) from pregnant Salmonella-infected mice; ‘c’ shows significant difference (P < 0.05) from Salmonella-infected mice.
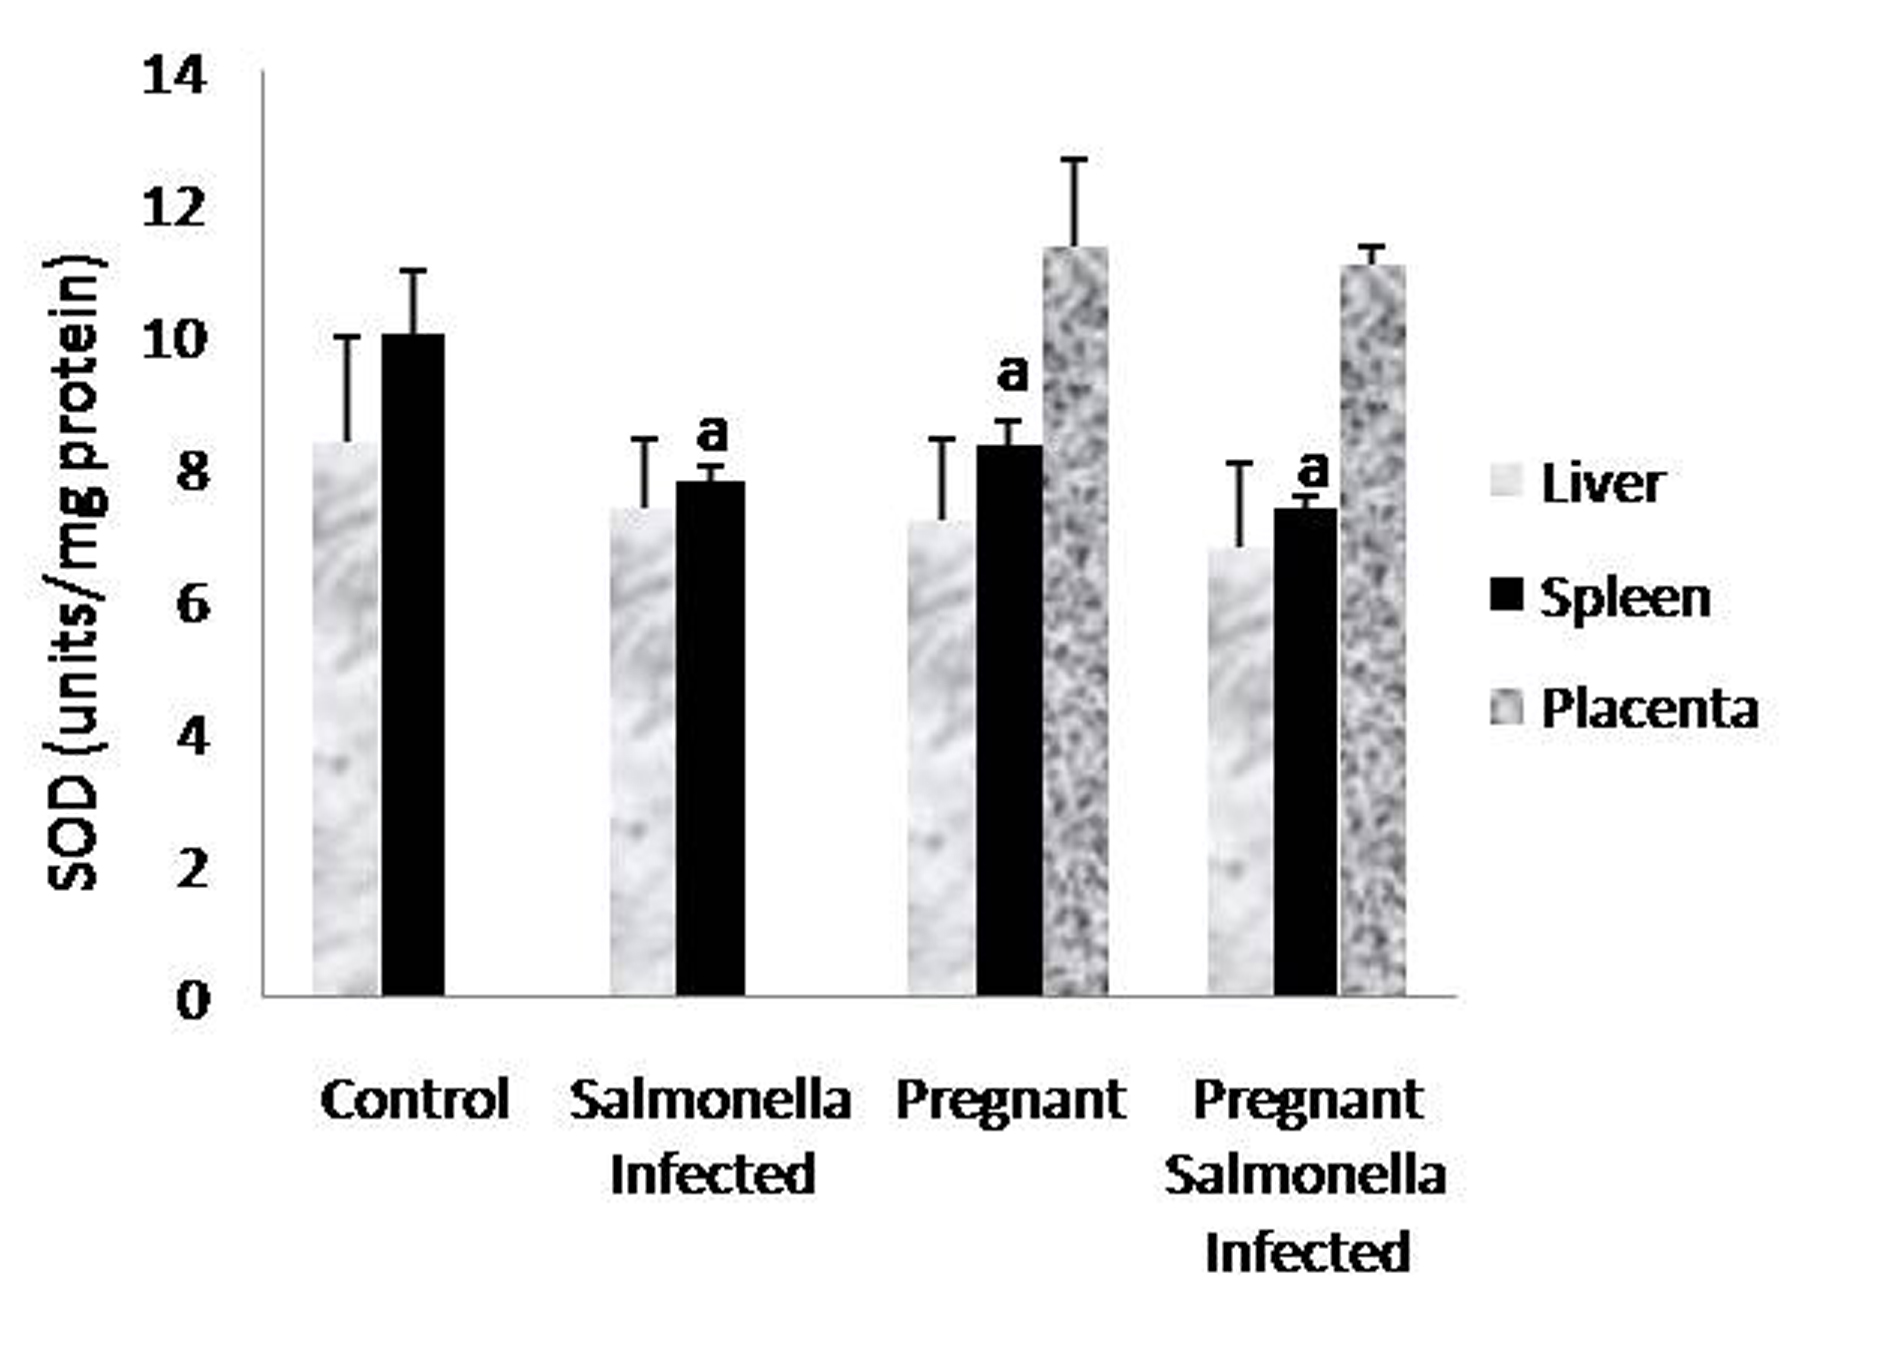
Figure 5. Activity of superoxide dismutase (units/mg protein) in liver, spleen and placental homogenates of mice belonging to different groups. Values are expressed as Mean ± S.E. ‘a’ shows significant difference (P < 0.05) from control mice.
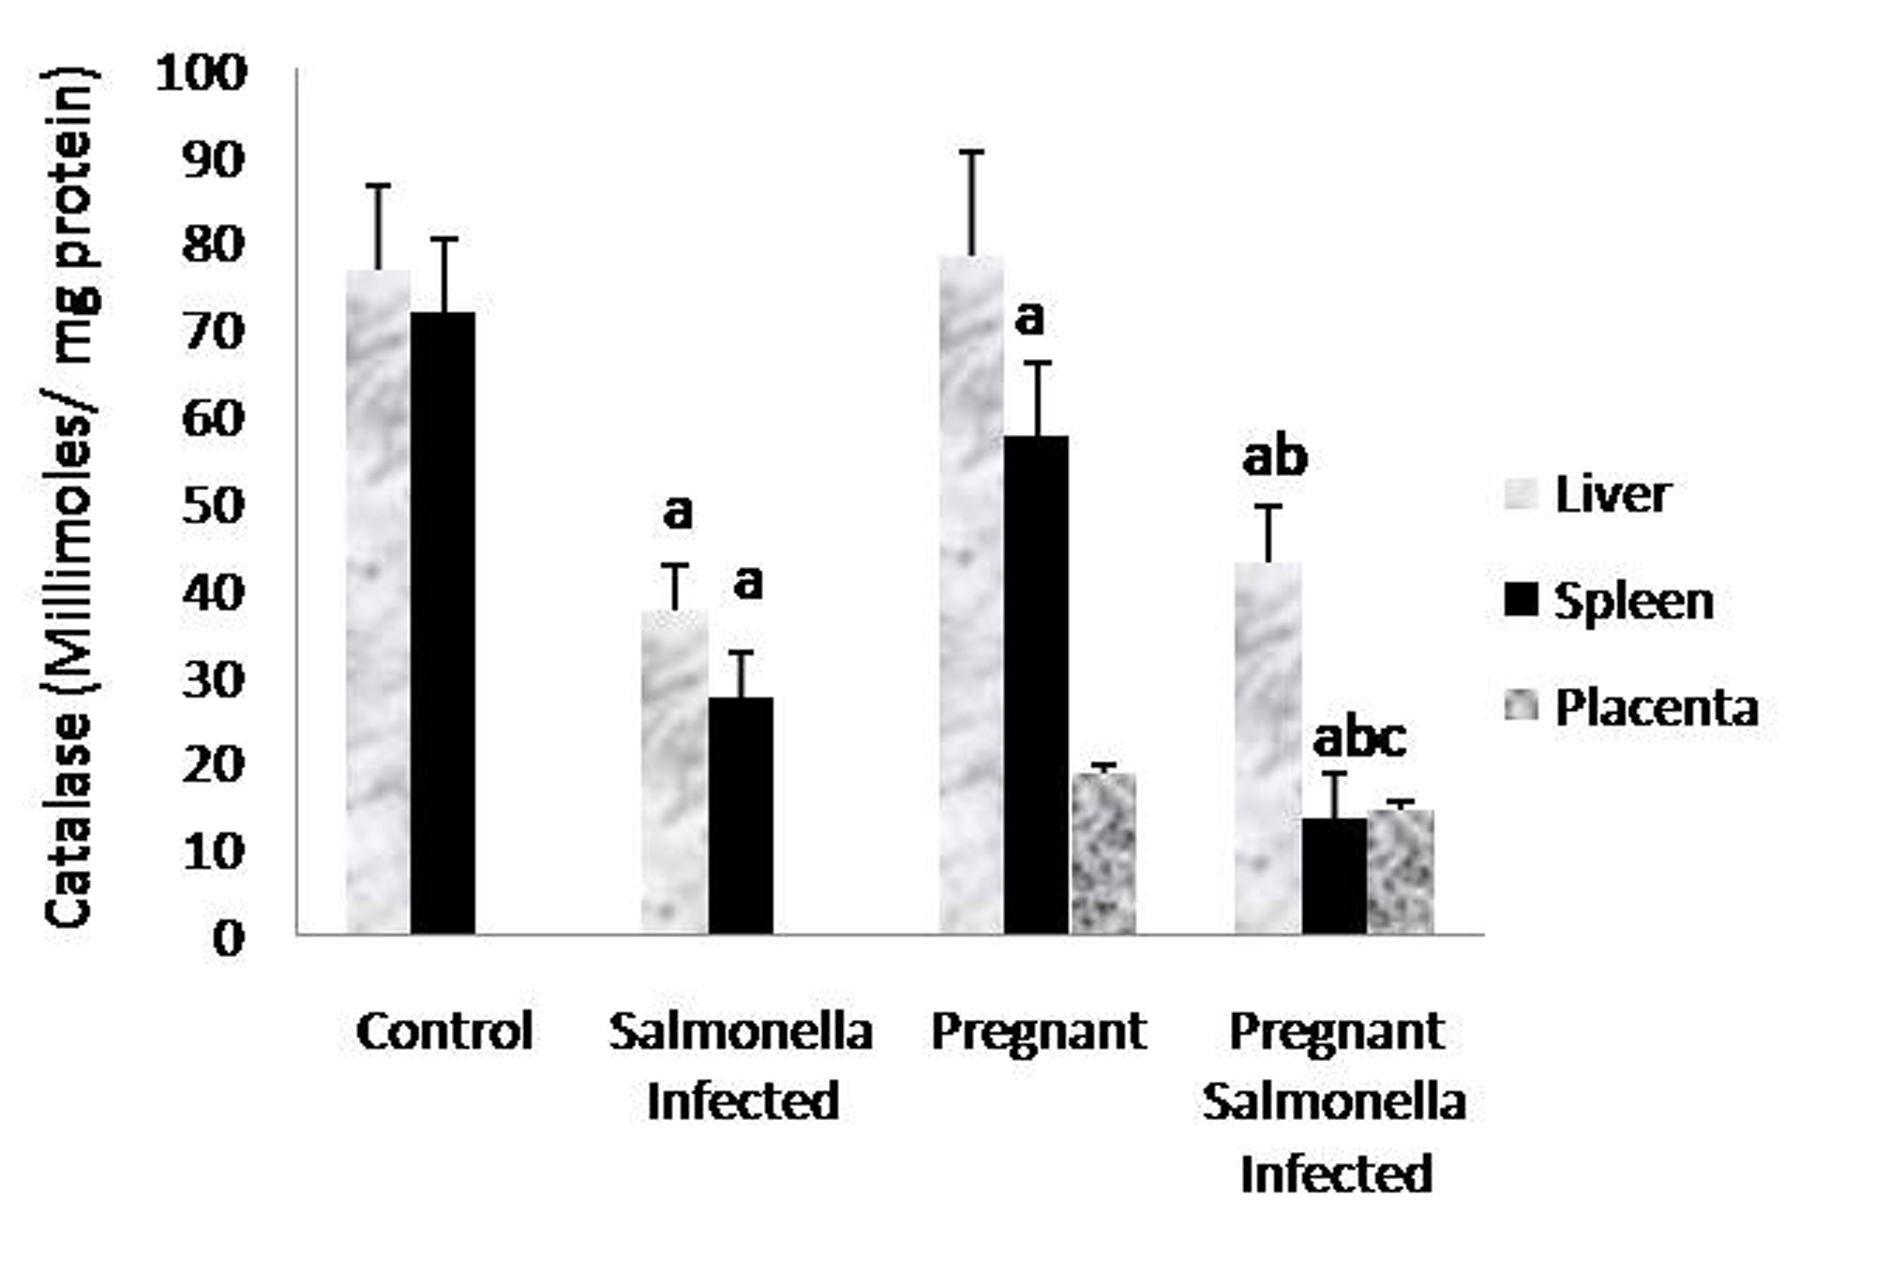
Figure 6. Catalase activity (Kmin-1) in liver, spleen and placental homogenates of mice belonging to different groups. Values are expressed as Mean ± S.E. ‘a’ shows significant difference (P < 0.05) from control; ‘b’ shows significant difference (P < 0.05) from pregnant mice; ‘c’ shows significant difference (P < 0.05) from Salmonella-infected mice.
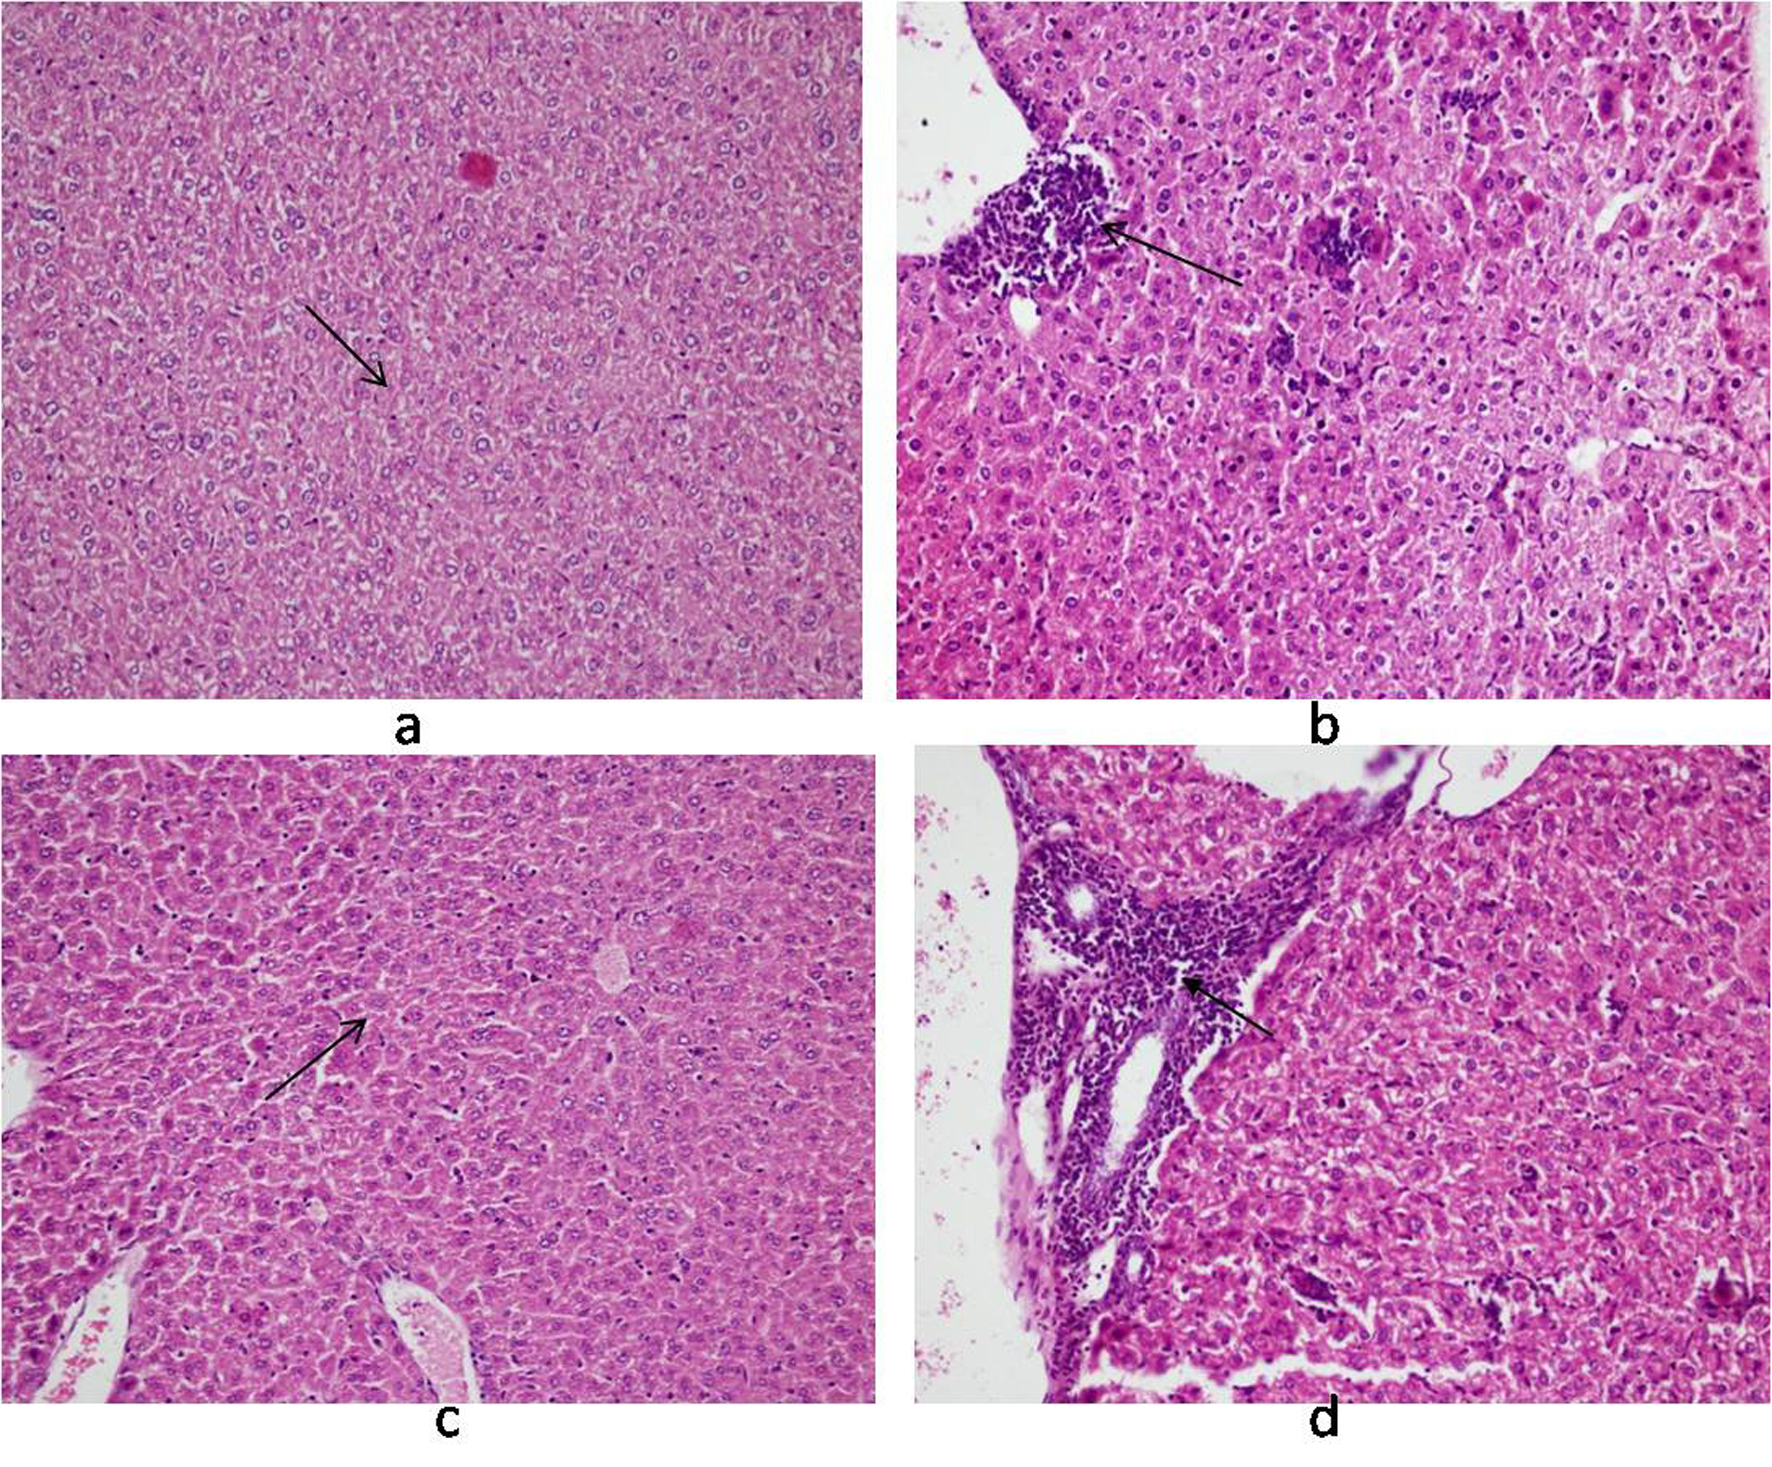
Figure 7. Photomicrograph of liver: (a) control mice (Group I) showing normal hepatocytes; (b) Salmonella-infected mice (Group II) showing lobular and inflammation of cells (arrow); (c) pregnant mice (Group III) showing Kupffer cells; (d) pregnant-Salmonella-infected mice (Group IV) showing portal tract inflammation (arrow). H and E stain, 100 x.
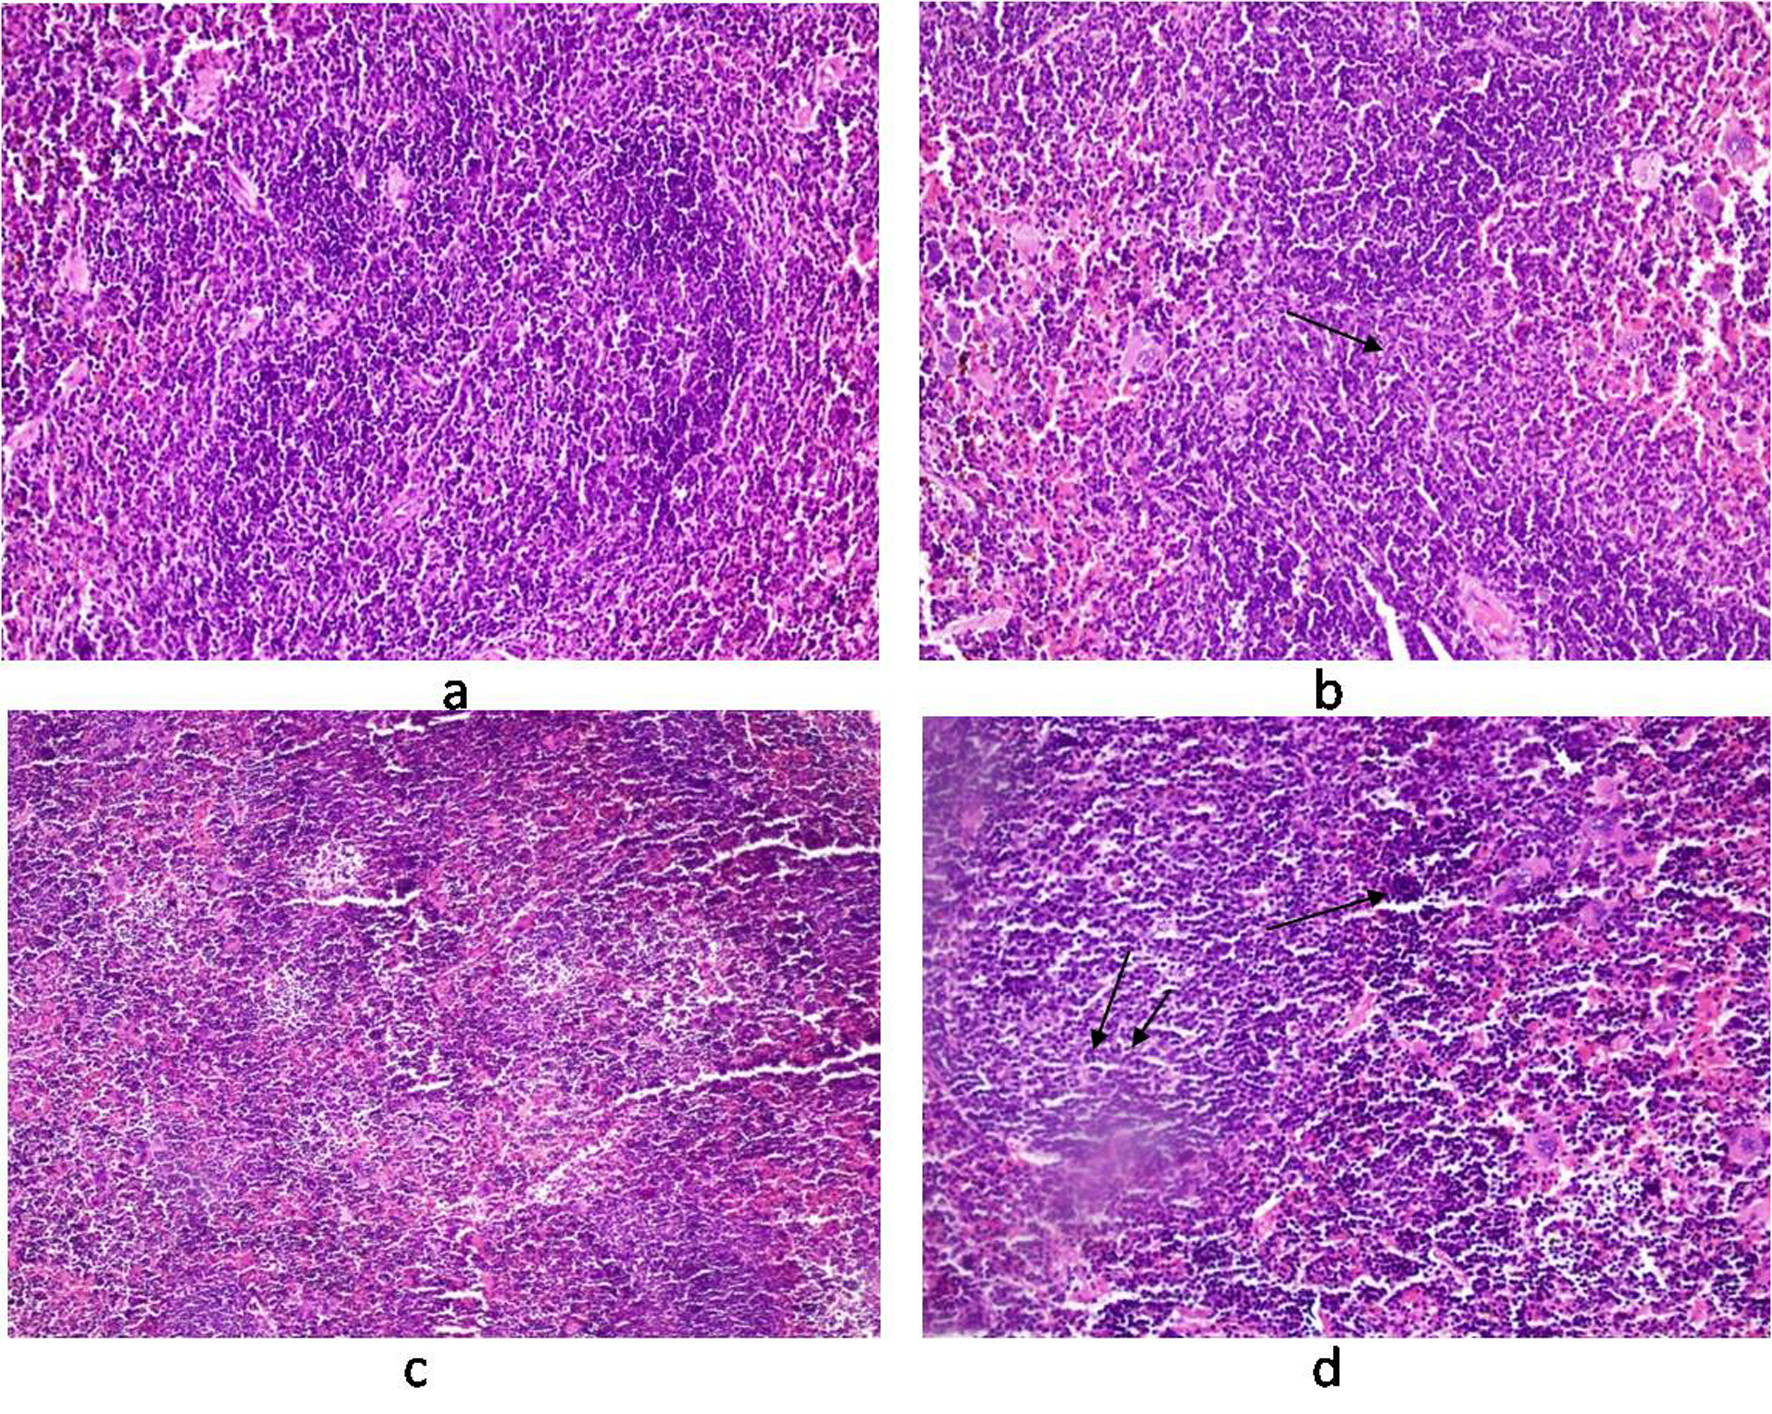
Figure 8. Photomicrograph of spleen. (a) control mice (Group I) showing normal texture of splenocytes; (b) Salmonella-infected mice (Group II) showing expansion of lymphoid tissue (arrow); (c) pregnant mice (Group III) showing normal structure of white cells with some expansion of red pulp; (d) pregnant-Salmonella-infected mice (Group IV) showing large lymphoid tissue (double arrow) and extramedullarly hematopoisis (single arrow) with mild excess of megakaryocytes. H and E stain, 50 x.
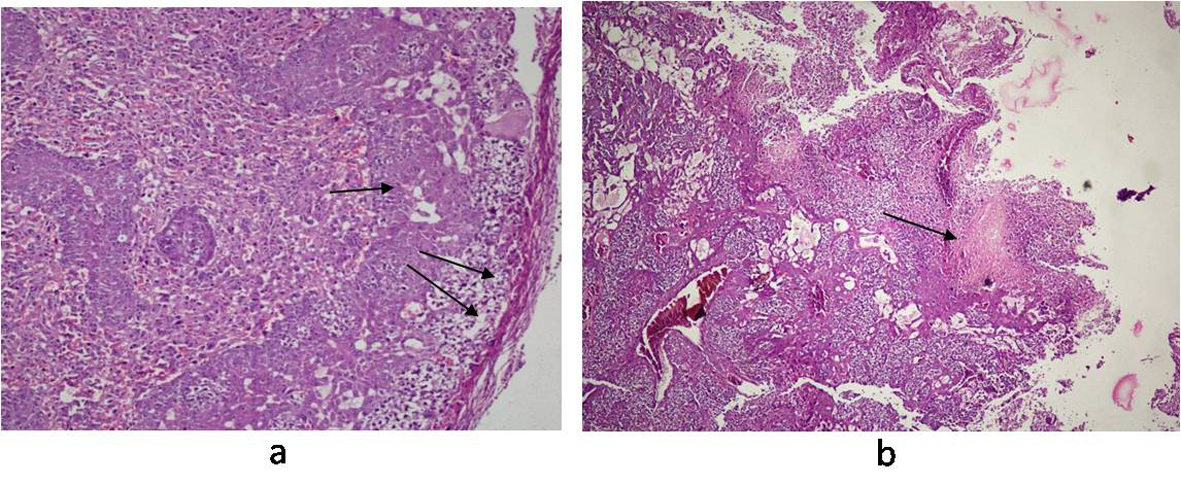
Figure 9. Photomicrograph of Placenta: (a) pregnant mice (Group III) showing normal structure of trophoblastic membrane (arrow) and syncytiotrophoblastic membrane (double arrow); (b) pregnant-Salmonella- infected mice (Group IV) showing altered structure and large foci of necrosis (arrow). H and E stain, 50 x.