Figures
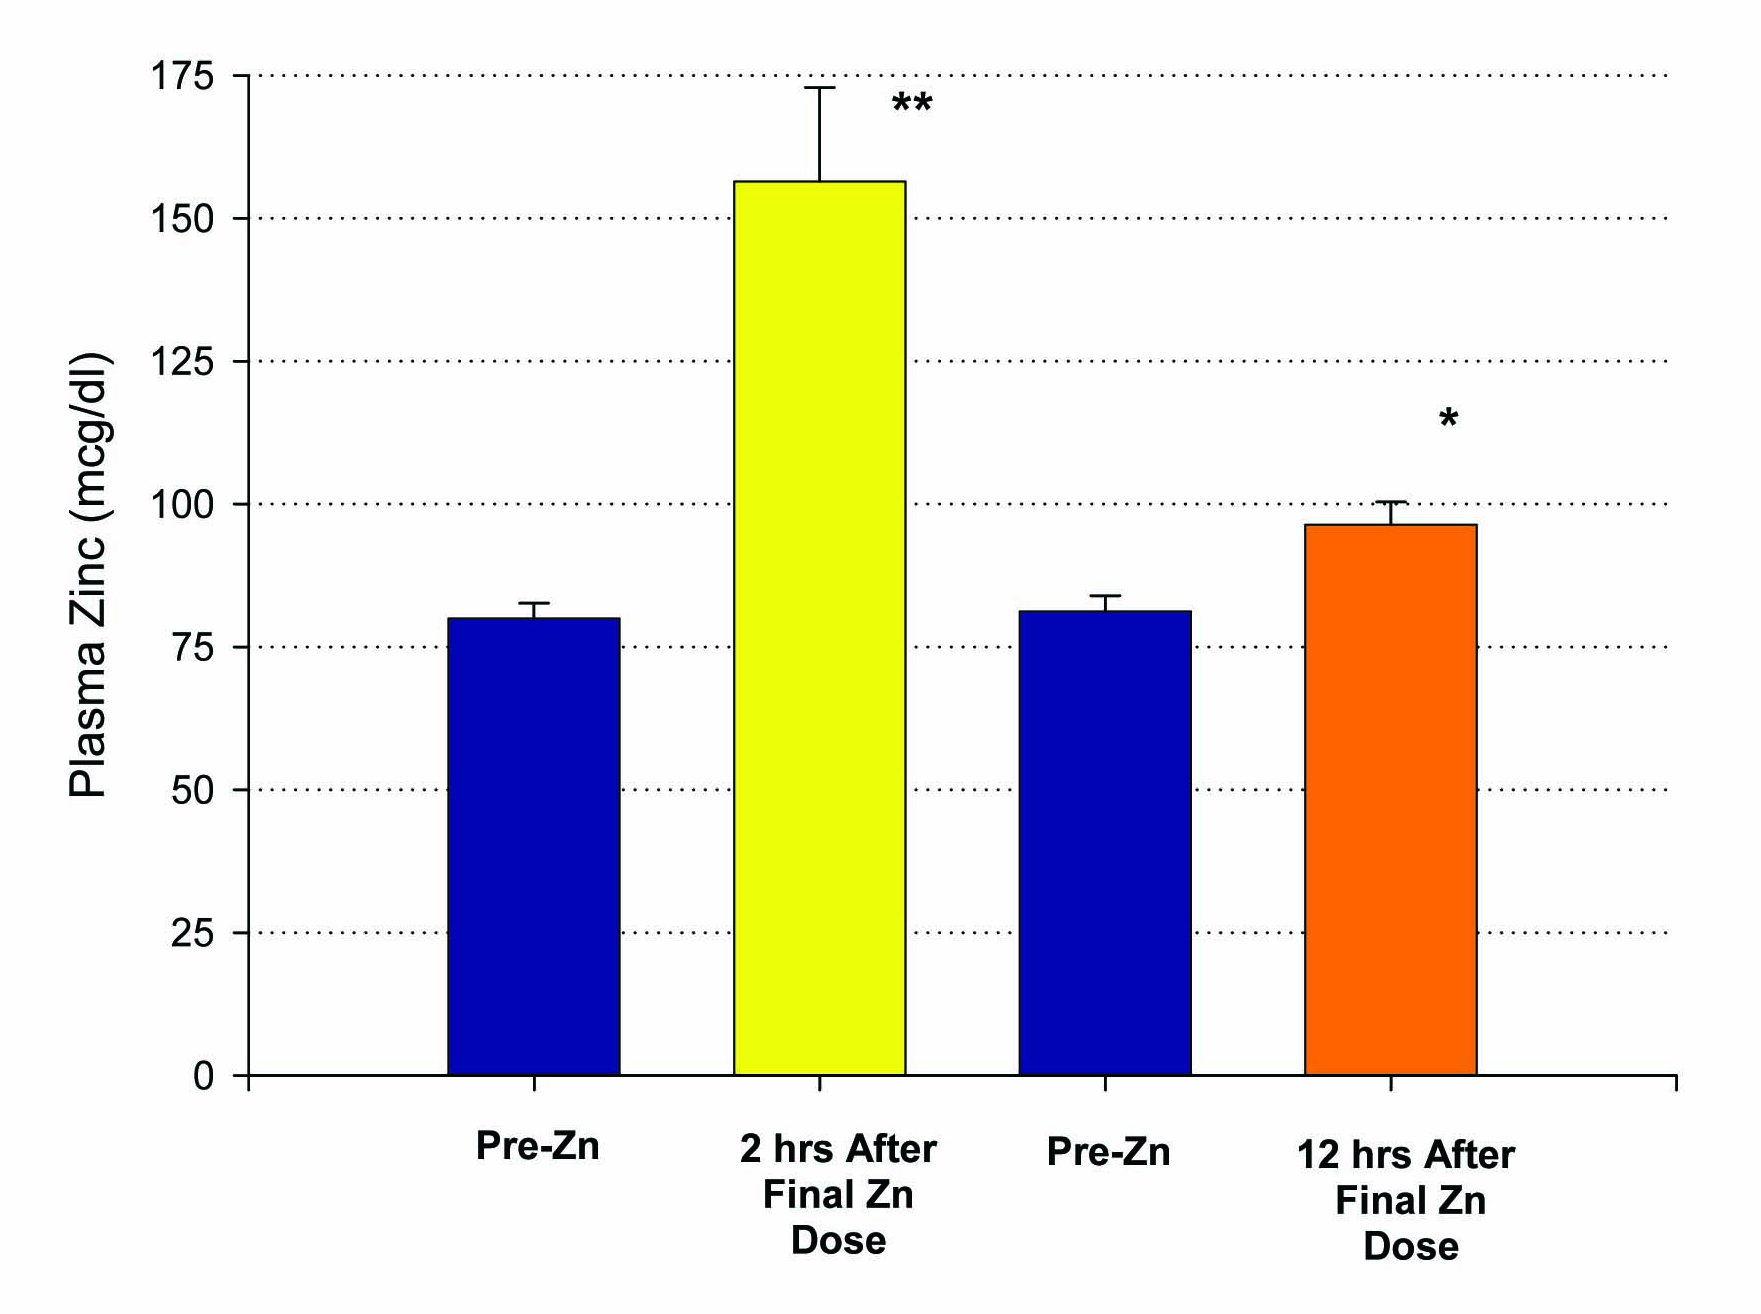
Figure 1. Elevation of plasma zinc after 14 days of 50 mg supplemental Zn per day. Results shown represent the mean ± standard error of the mean. A group of n = 10 healthy control, test subjects had a blood sample taken 12 hours after their final Zn dose. A second group (n = 5), also healthy controls, had their blood sample taken only 2 hours after their final Zn dose. *P < 0.005 (paired Student’s t test); **P < 0.01 against their own pre-zinc supplement plasma Zn values.
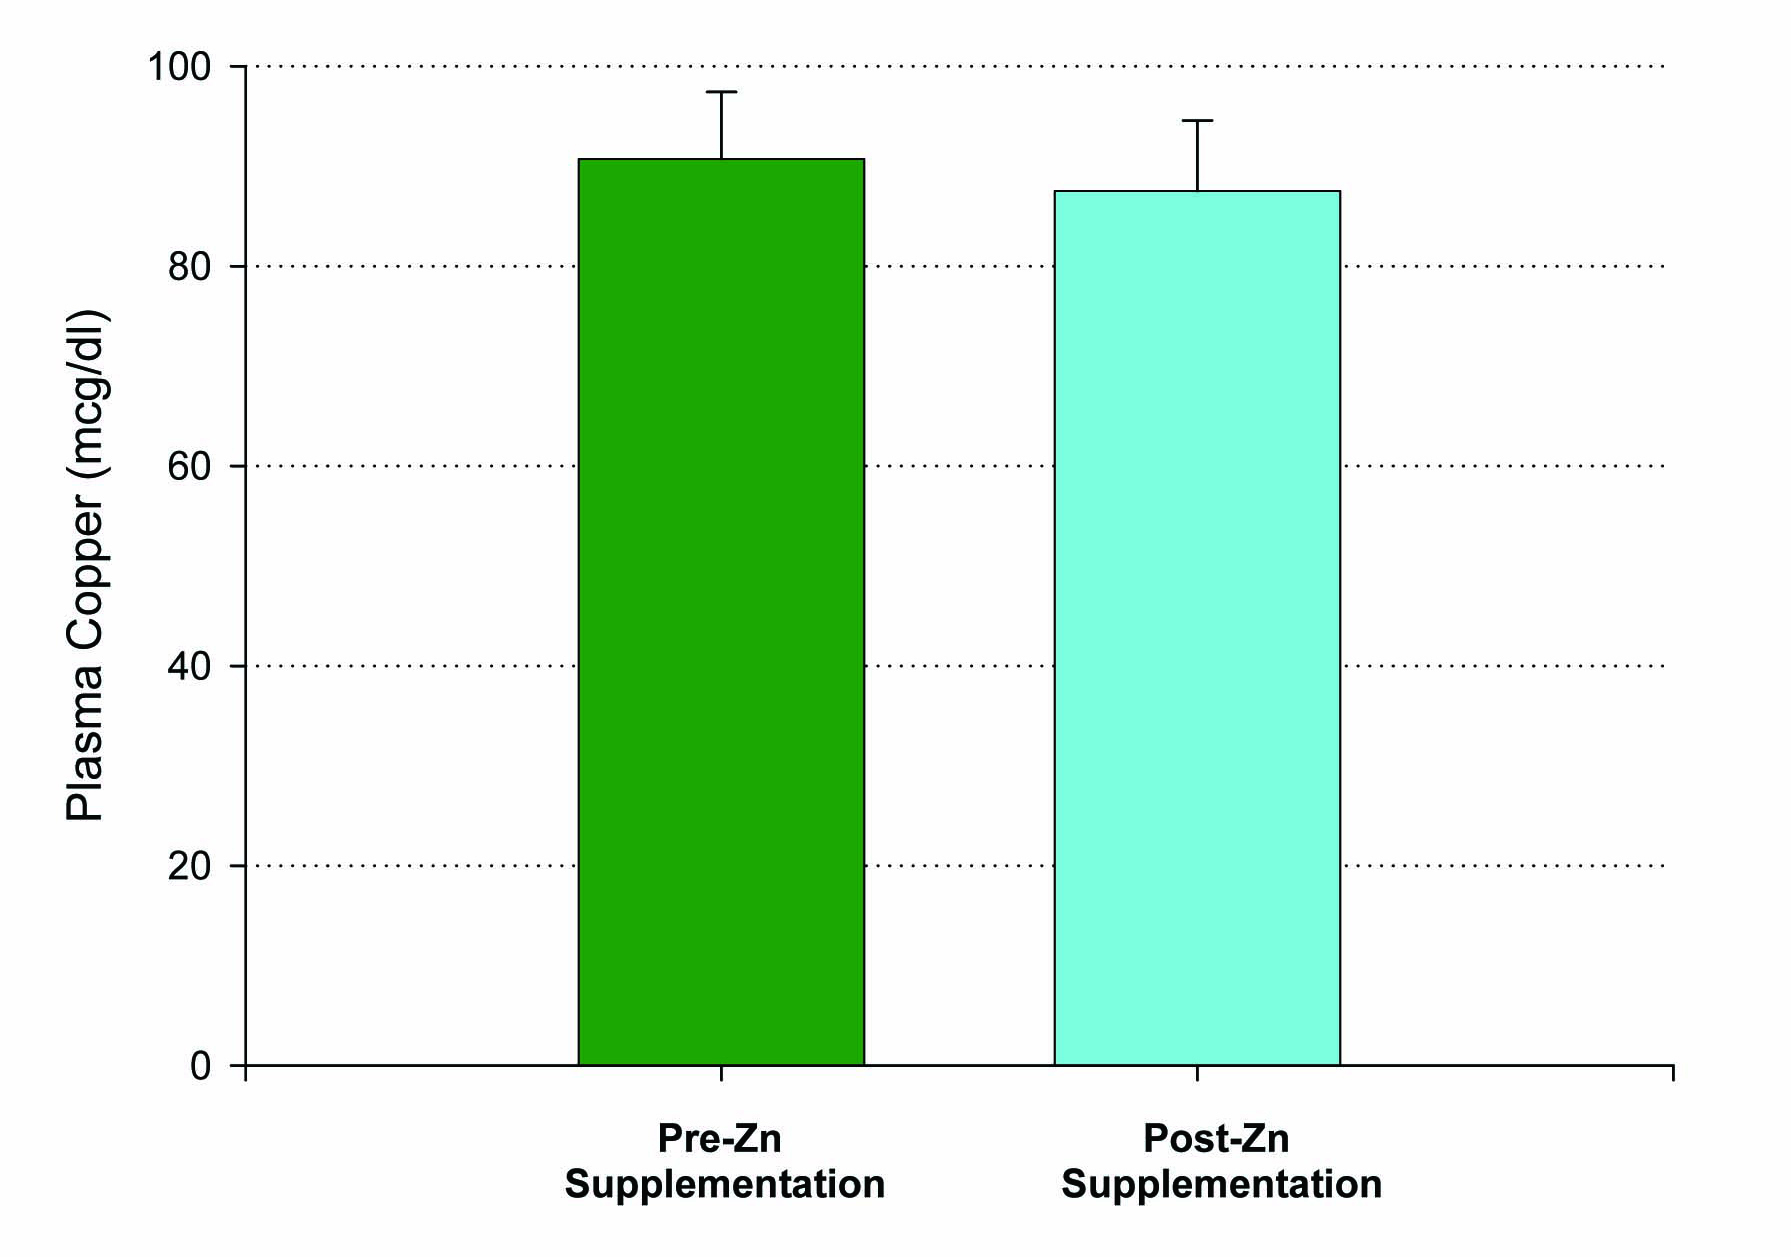
Figure 2. Lack of effect of Zn supplementation on plasma copper levels. A group of n = 10 healthy control, test subjects had their blood sample taken 12 hours after their final Zn dose. P = 0.35 (paired Student’s t). Not significant. Data shown represent mean ± standard error of the mean.
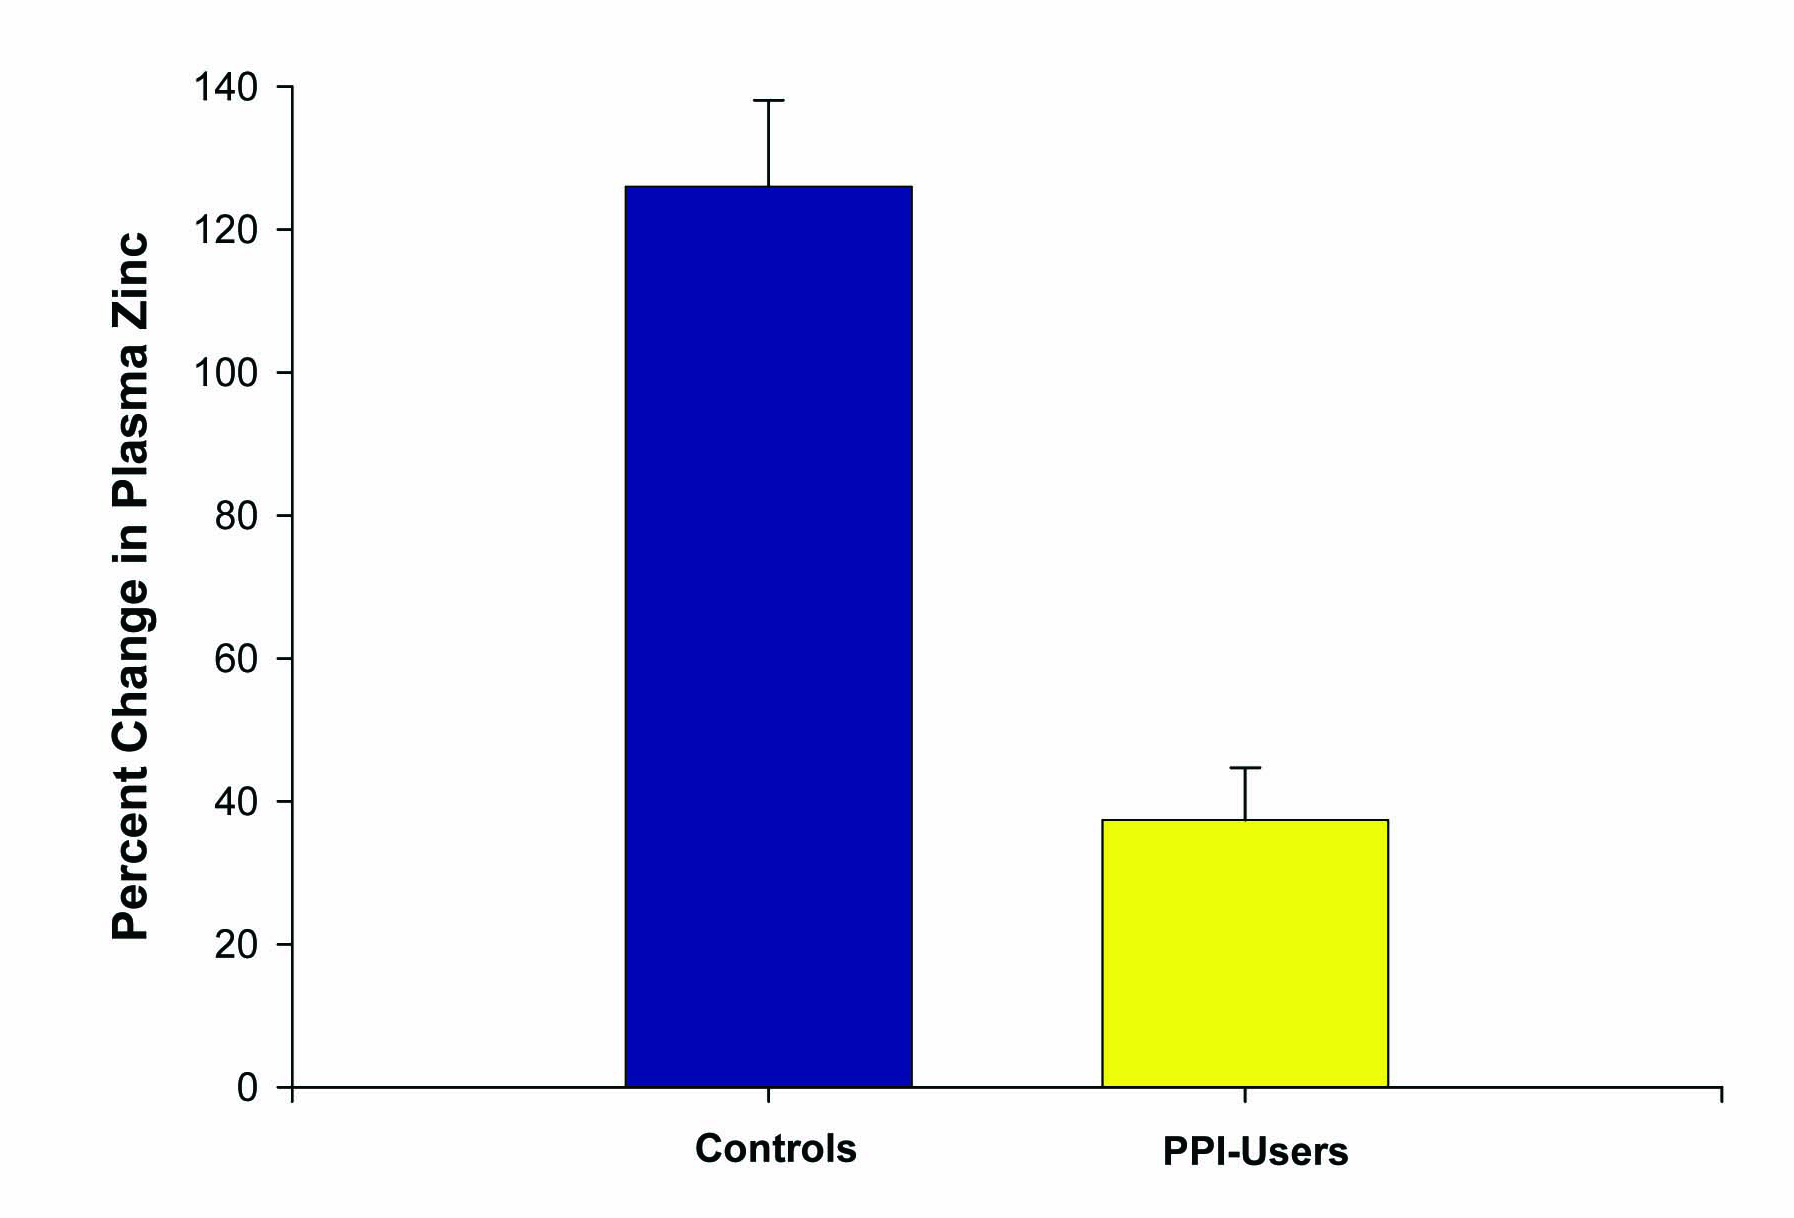
Figure 3. Effect of PPI use on percentage change in plasma zinc levels after zinc supplementation. The increase in plasma zinc levels after 14 days of 53.2 mg/day zinc supplementation was measured for n = 5 healthy control test subjects versus n = 5 reflux-disease patients on long-term PPI therapy. Data shown represent the mean percentage increase ± the standard error of the mean. P < 0.01 (paired Student’s t test).
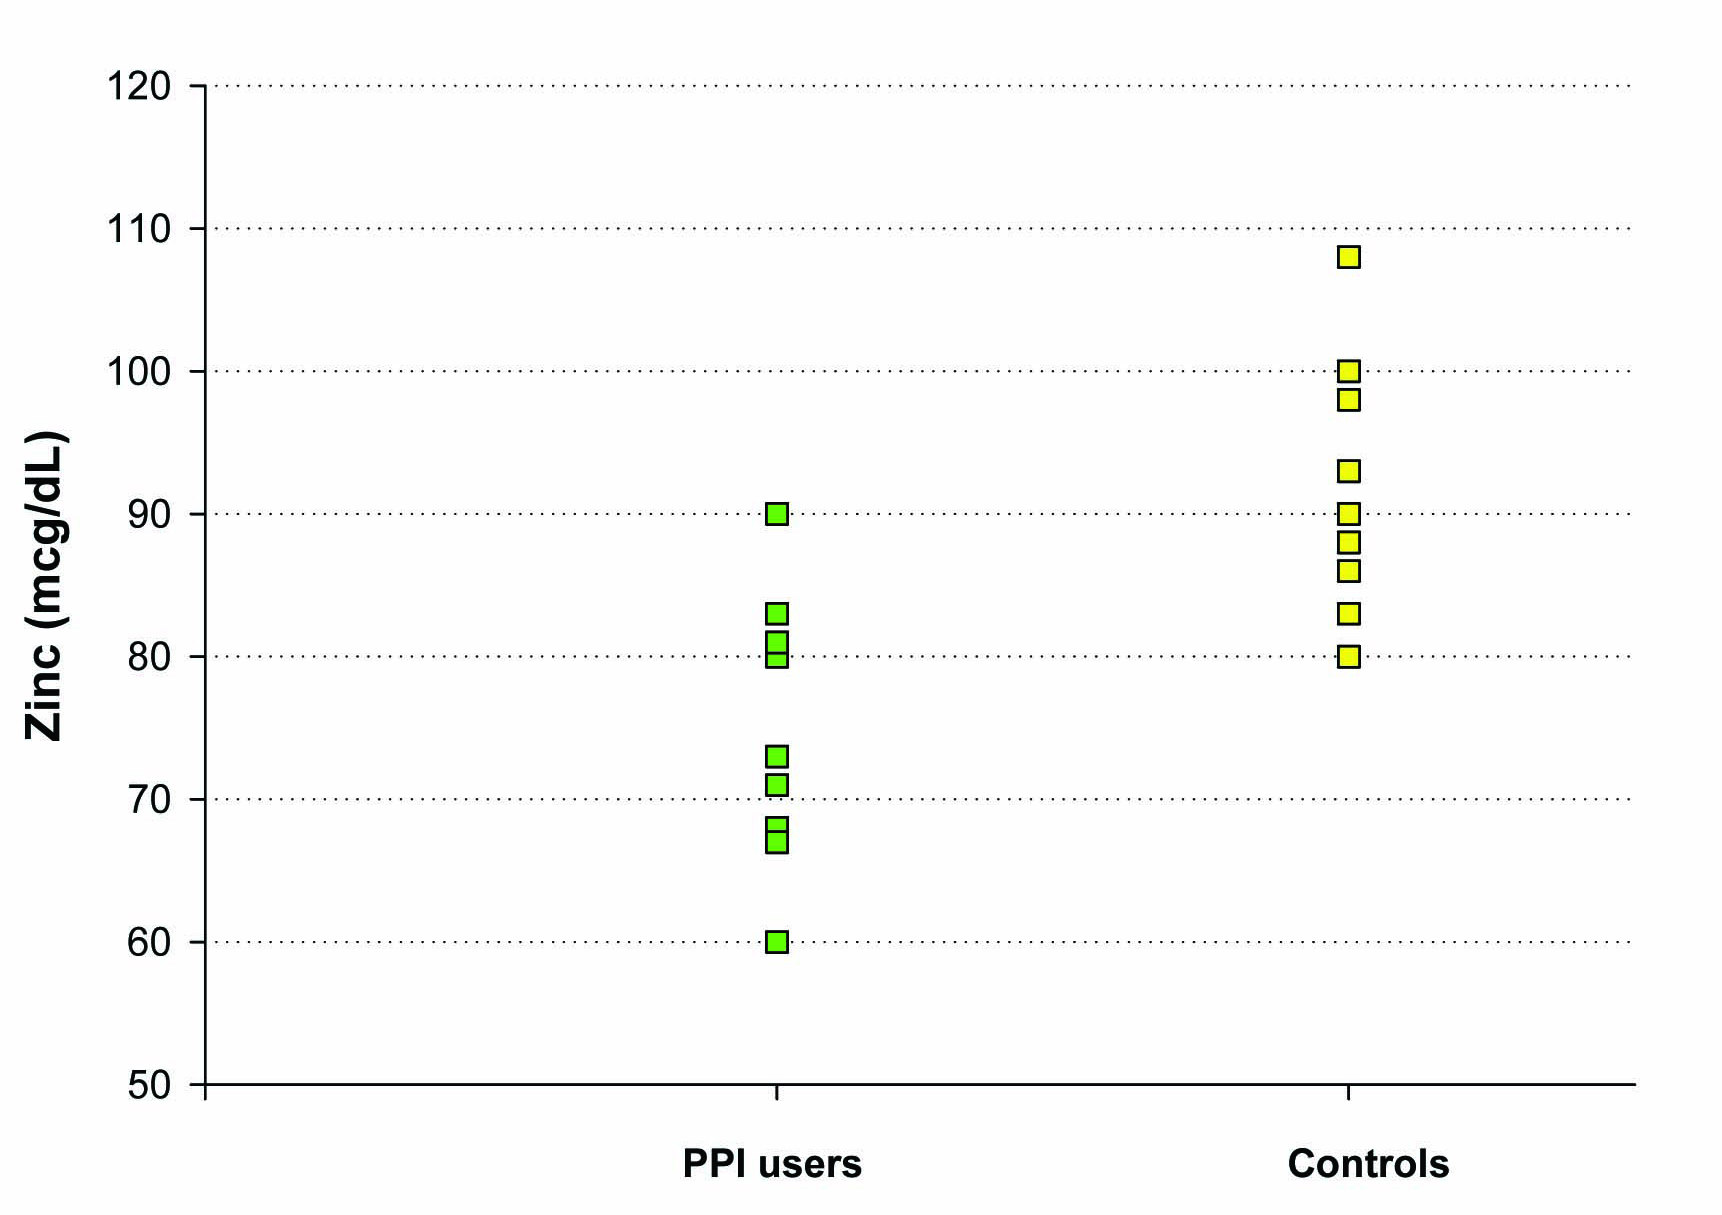
Figure 4. The effect of chronic PPI use on plasma zinc levels. Plasma zinc levels (mcg/dL) were measured in a group of 10 test subjects on long-term PPI medication (as described in Methods) and a matched group of 10 healthy control test subjects not taking PPI, antacid or H2 blocker medication. For the healthy control group, the mean (±standard error of the mean) was 91 mcg/dL ± 3 and the mean for the PPI-group was 75 mcg/dL ± 3 (Paired Student’s t test, P = 0.004).
Table
Table 1. Demographic Data
| Study 1 (n = 15) | Study 2 (n = 5) | Study 3 (n = 10) |
|---|
| Controls | Controls | PPI users | Controls | PPI Users |
|---|
| n | % | n | % | n | % | n | % | n | % |
|---|
| *Barretts, Hemochromatosis. |
| Age (years) | | | | | | | | | | |
| 18 – 30 | 5 | 33.3 | 3 | 60 | 3 | 60 | 6 | 60 | 2 | 20 |
| 31 - 40 | 2 | 13.3 | 1 | 20 | 1 | 20 | 2 | 20 | 1 | 10 |
| 41 – 50 | 4 | 26.7 | 0 | 0 | 1 | 20 | 0 | 0 | 4 | 40 |
| 51 – 60 | 2 | 13.3 | 1 | 20 | 0 | 0 | 2 | 20 | 3 | 30 |
| > 60 | 2 | 13.3 | 0 | 0 | 0 | 0 | 0 | 0 | 0 | 0 |
| Gender | | | | | | | | | | |
| Male | 5 | 33.3 | 1 | 20 | 1 | 20 | 5 | 50 | 4 | 40 |
| Female | 10 | 66.7 | 4 | 80 | 4 | 80 | 5 | 50 | 6 | 60 |
| Ethnicity | | | | | | | | | | |
| Caucasian | 13 | 86.7 | 4 | 80 | 5 | 100 | 7 | 70 | 9 | 90 |
| Asian | 2 | 13.3 | 1 | 20 | 0 | 0 | 3 | 30 | 0 | 0 |
| African American | 0 | 0 | 0 | 0 | 0 | 0 | 0 | 0 | 1 | 10 |
| Type of PPI | | | | | | | | | | |
| n/a | | | | | | | | | | |
| Protonix | | | | | 0 | 0 | | | 3 | 30 |
| Prilosec | | | | | 2 | 40 | | | 4 | 40 |
| Nexium | | | | | 1 | 20 | | | 1 | 10 |
| Aciphex | | | | | 1 | 20 | | | 2 | 20 |
| Prevacid | | | | | 1 | 20 | | | 0 | 0 |
| PPI Duration | | | | | | | | | | |
| n/a | | | | | | | | | | |
| 6 months-2 years | | | | | | | | | 4 | 40 |
| > 2 years | | | | | | | | | 6 | 60 |
| GI Disease | | | | | | | | | | |
| GERD | 3 | 20 | | | 5 | 100 | 0 | 0 | 9 | 90 |
| Other | 0 | 0 | | | 0 | 0 | 0 | 0 | 1* | 10 |
| None | 12 | 80 | | | 0 | 0 | 10 | 100 | | 0 |