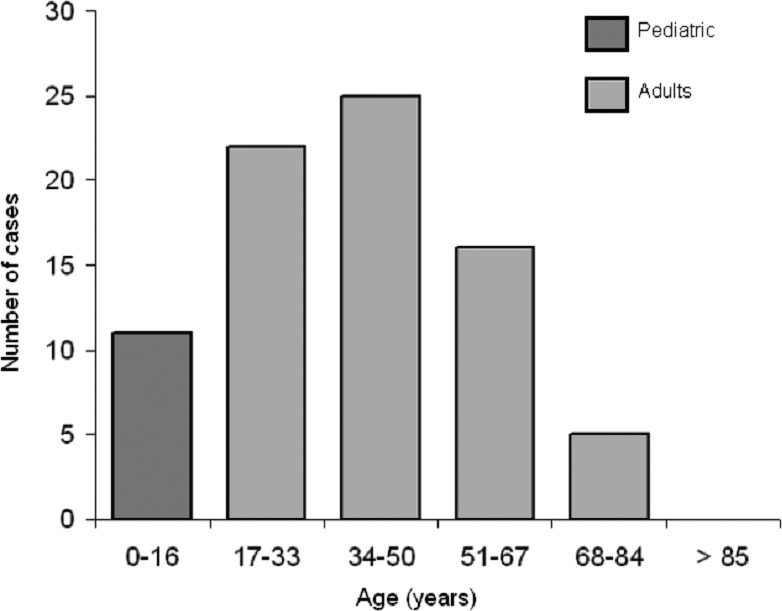
Figure 1. Age distribution of all celiac patients diagnosed in 2010 at two Spanish Hospitals; results show that CD predominates in adult patients between the 3rd and 5th decades of life.
| Gastroenterology Research, ISSN 1918-2805 print, 1918-2813 online, Open Access |
| Article copyright, the authors; Journal compilation copyright, Gastroenterol Res and Elmer Press Inc |
| Journal website http://www.gastrores.org |
Original Article
Volume 4, Number 6, December 2011, pages 268-276
Coeliac Disease in the 21st Century: No Longer “Kids’ Stuff”
Figure

Tables
| Adult CD patients | Paediatric CD patients | |||||
|---|---|---|---|---|---|---|
| Hospital #1 | Hospital #2 | p | Hospital #1 | Hospital #2 | p | |
| tTGA: anti-tissue transglutaminase antibodies; BMI: body mass index. | ||||||
| Number or patients (%) | 20 (80%) | 48 (88%) | 0.29 | 5 (20%) | 6 (11%) | 0.29 |
| Female / Male (%) | 19/1 (95%) | 31/17 (64.58%) | 0.01 | 4/1 (80%) | 3/3 (50%) | 0.30 |
| Mean age ± SD (years) | 43.50 (13.89) | 43.15 (15.90) | 0.93 | 4.03 (5.02) | 3.33 (2.94) | 0.77 |
| Positive tTGA (%) | 5 (25%) | 8 (16.7%) | 0.50 | 4 (80%) | 5 (83.3%) | 0.89 |
| BMI (in adults) | 24.95 (6.38) | 24.56 (3.62) | 0.76 | - | - | - |
| Diagnostic delay | 127.53 (155.11) | 52.90 (53.74) | 0.39 | 15.20 (18.62) | 7 (3.46) | 0.66 |
| Classic symptoms (%) | 11 (55%) | 26 (54.16%) | 0.95 | 4 (80%) | 6 (100%) | 0.46 |
| Haemoglobin levels (g/dL) | 13.11 (1.52) | 12.971 (2.19) | 0.89 | 12.90 (0.85) | 11.283 (0.96) | 0.03 |
| Serum Iron (µg/dL) | 74.30 (29.95) | 71.38 (50.76) | 0.31 | 79.50 (24.20) | 44 (7.92) | 0.038 |
| Ferritin (ng/mL) | 62 (114.39) | 49.40 (52.96) | 0.65 | 25.20 (12.91) | 20.83 (7.28) | 0.66 |
| Familiar association (%) | 3 (15%) | 6 (12.5%) | 0.95 | 0 (0%) | 3 (50%) | 0.24 |
| Marsh I | 13 (65%) | 32 (66.7%) | 0.89 | 1 (20%) | 0 (0%) | 0.25 |
| Marsh II | 3 (15%) | 7 (14.6%) | 1 | 2 (40%) | 1 (16.7%) | 0.55 |
| Marsh III (a, b, c) | 4 (20%) | 9 (18.7%) | 1 | 2 (40%) | 5 (83.3%) | 0.24 |
| DQ2 haplotype | 15 (75%) | 43 (89.6%) | 0.14 | 4 (80%) | 5 (83.3%) | 1 |
| DQ8 haplotype | 2 (10%) | 2 (4.2%) | 0.58 | 1 (20%) | 1 (16.7%) | 1 |
| Non DQ2/DQ8 | 3 (15%) | 3 (6.2%) | 0.35 | 0 (0%) | 0 (0%) | 1 |
| Adult patients | Paediatric patients | p | |
|---|---|---|---|
| tTGA: anti-tissue transglutaminase antibodies; BMI: body mass index. | |||
| Number or patients (%) | 68 (86.1%) | 11 (13.9%) | - |
| Female / Male (%) | 50/18 (73.53%) | 7/4 (63.64%) | 0.49 |
| Familiar association (%) | 9 (13.2%) | 3 (27.3%) | 0.358 |
| Positive tTGA (%) | 13 (19.1%) | 9 (81.8%) | 0.004 |
| Diagnostic delay (months) | 70.67 ± 93 | 10.73 ± 12.77 | < 0.001 |
| Classic symptoms (%) | 37 (54.4%) | 10 (90.9%) | 0.024 |
| Haemoglobin levels (g/dL) | 13.01 ± 2 | 12.02 ± 1.21 | 0.025 |
| Serum Iron (µg/dL) | 72.24 ± 45.43 | 58.20 ± 23.79 | 0.398 |
| Ferritin (ng/mL) | 53.16 ± 75.87 | 22.82 ± 9.92 | 0.245 |
| Marsh I | 45 (66.2%) | 1 (9.1%) | < 0.001 |
| Marsh II | 10 (14.7%) | 3 (27.3%) | 0.38 |
| Marsh III (a, b, c) | 13 (19.1%) | 7 (63.7%) | 0.004 |
| DQ2 haplotype | 57 (85.1%) | 8 (80%) | 0.4 |
| DQ8 haplotype | 4 (6%) | 2 (20%) | 0.19 |
| Non DQ2/DQ8 | 6 (9%) | 0 (0%) | 0.59 |
| No (%) | |
|---|---|
| GORD: Gastroesophageal reflux disease. | |
| Abdominal pain | 29 (42.64 %) |
| Diarrhoea | 25 (36.76 %) |
| Anaemia | 16 (23.52 %) |
| Dyspepsia | 11 (16.17 %) |
| GORD-related symptoms | 10 (14.7 %) |
| Constipation | 10 (14.7 %) |
| Vomiting | 5 (7.35 %) |
| Weight loss | 3 (4.41 %) |
| Dysphagia | 3 (4.41 %) |
| Hypertransaminasemia | 2 (2.94 %) |
| Hypocalcemia | 1 (1.47 %) |
| Dermatitis | 1 (1.47 %) |