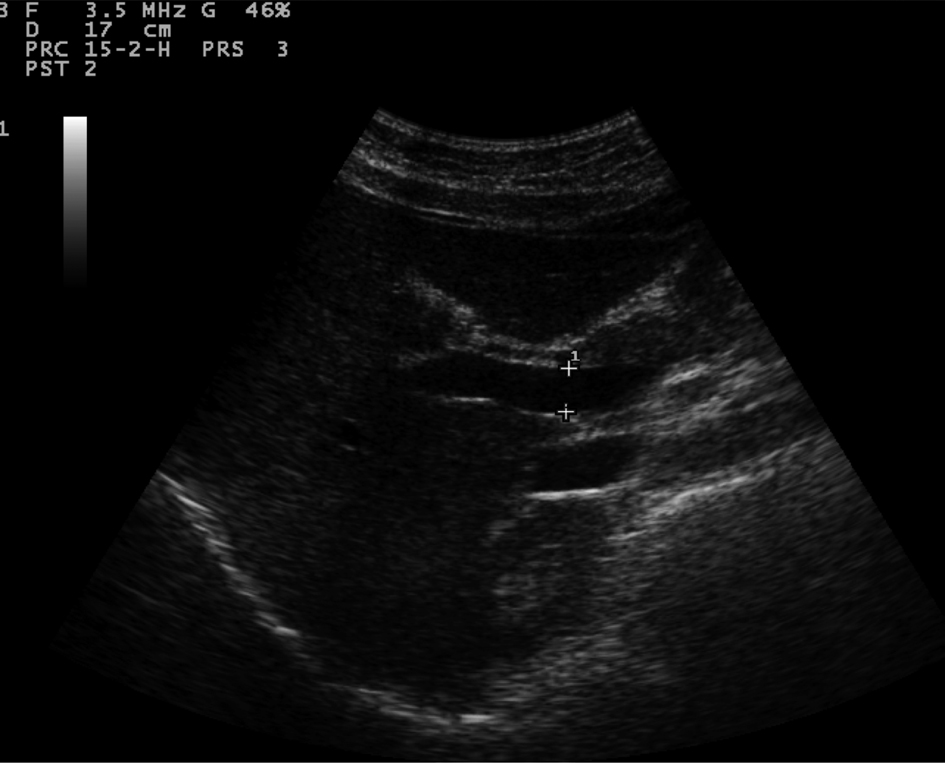
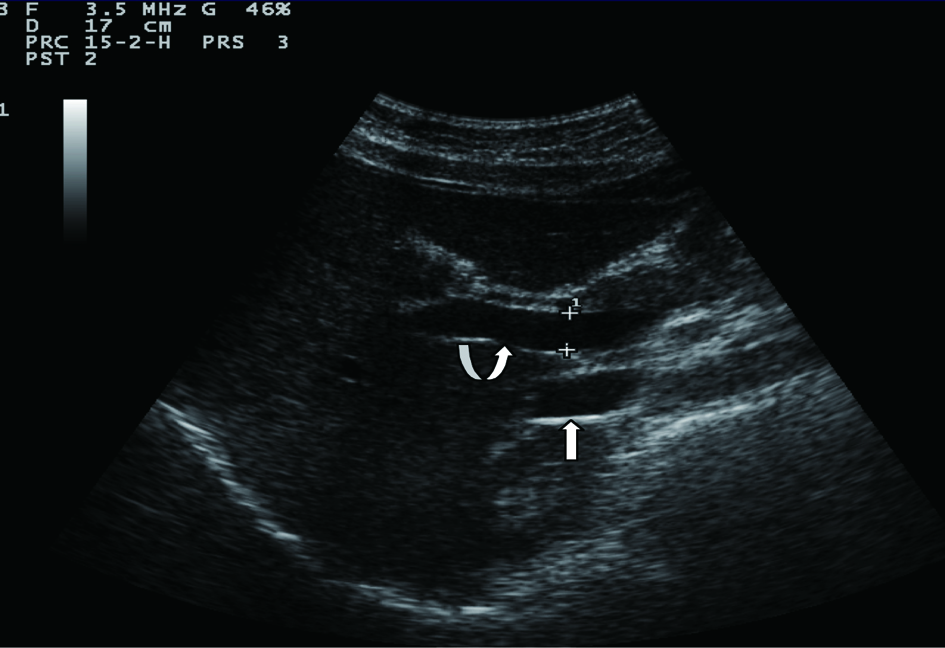
Figure 1. Portal vein diameter (curve arrow) is measured where it crosses anterior to IVC (arrow).
| Gastroenterology Research, ISSN 1918-2805 print, 1918-2813 online, Open Access |
| Article copyright, the authors; Journal compilation copyright, Gastroenterol Res and Elmer Press Inc |
| Journal website http://www.gastrores.org |
Original Article
Volume 5, Number 3, June 2012, pages 112-119
Correlation Between Sonographic Portal Vein Diameter and Flow Velocity With the Clinical Scoring Systems MELD and CTP in Cirrhotic Patients: Is There a Relationship?
Figures
Tables
| Clinical Characteristics | Data |
|---|---|
| CTP Score | No. of patients (%) |
| Class A (5 - 6) | 10 (9.3%) |
| Class B (7 - 9) | 58 (53.7%) |
| Class C (> 9) | 40 (37%) |
| Ascites | No. of patients (%) |
| No | 22 (20.4%) |
| Mild | 34 (31.5%) |
| Severe | 52 (48.1%) |
| Encephalopathy | No. of patients (%) |
| No | 89 (82.4%) |
| Mild | 19 (17.6%) |
| Severe | 0 |
| Mean ± SD (range) | |
|---|---|
| Serum albumin (g/dL) | 3.26 ± 0.83 (1.3 - 6) |
| Serum bilirubin (mg/dL) | 4.61 ± 7.68 (0.2 - 21.1) |
| Serum creatinine (mg/dL) | 1.29 ± 0.95 (0.3 - 5.4) |
| PT (sec) | 16.73 ± 3.94 (11.6 - 34.8) |
| INR | 1.93 ± 1.02 (0.9 - 7.25) |
| Sonographic Measures | Data |
|---|---|
| PVD (mm) | |
| Mean ± SD (range) | 12.11 ± 3.24 (5 - 20) |
| < 13 (No. of patients - %) | 66 (61.1%) |
| > 13 (No. of patients - %) | 42 (38.9%) |
| PFV (cm/sec) | No. of patients (%) |
| Normal (19 - 23) | 66 (61.1%) |
| Decreased < 19 | 19 (17.6%) |
| Increased > 23 | 23 (21.3%) |
| No. of patients with their corresponding (MELD score ± SD) | |
| Normal (19 - 23) | 67 (17.96 ± 9.05) |
| Decreased < 19 | 22 (17.97 ± 10.05) |
| Increased > 23 | 19 (15.88 ± 7.50) |
| CTP Grade A | CTP Grade B | CTP Grade C | |
|---|---|---|---|
| Serum Albumin (g/dL) | 28 (25.9%) | 54 (50%) | 26 (24.1%) |
| Serum Bilirubin (mg/dL) | 53 (49.1%) | 13(12%) | 42 (38.9% |
| INR | 59 (54.6%) | 25 (23.1%) | 24 (22.2%) |