Figures
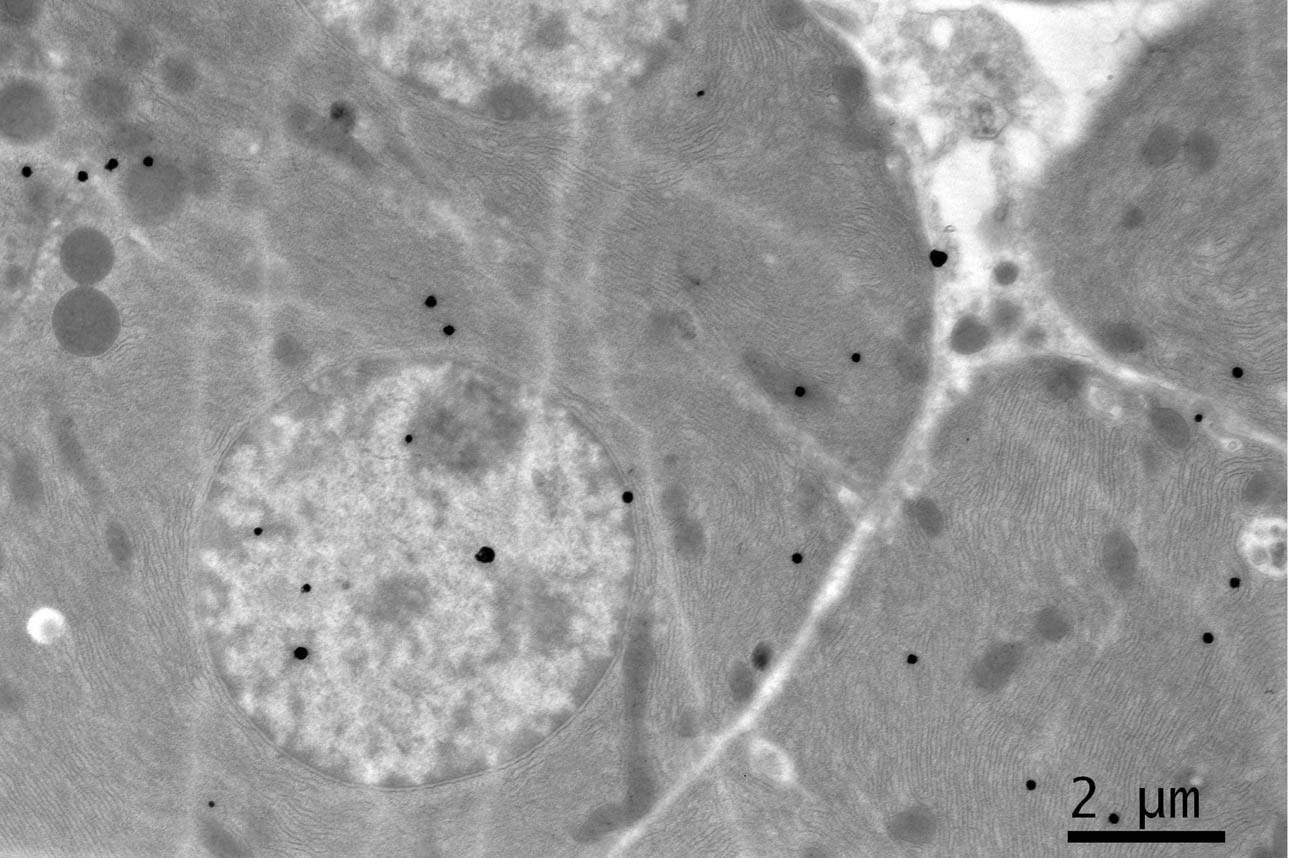
Figure 1. EM RAG of 2 pancreatic acinar cells of a newborn day 1 mouse labeled with 3H-leucine, showing a few silver grains in the nucleus and cytoplasm (× 3,000).
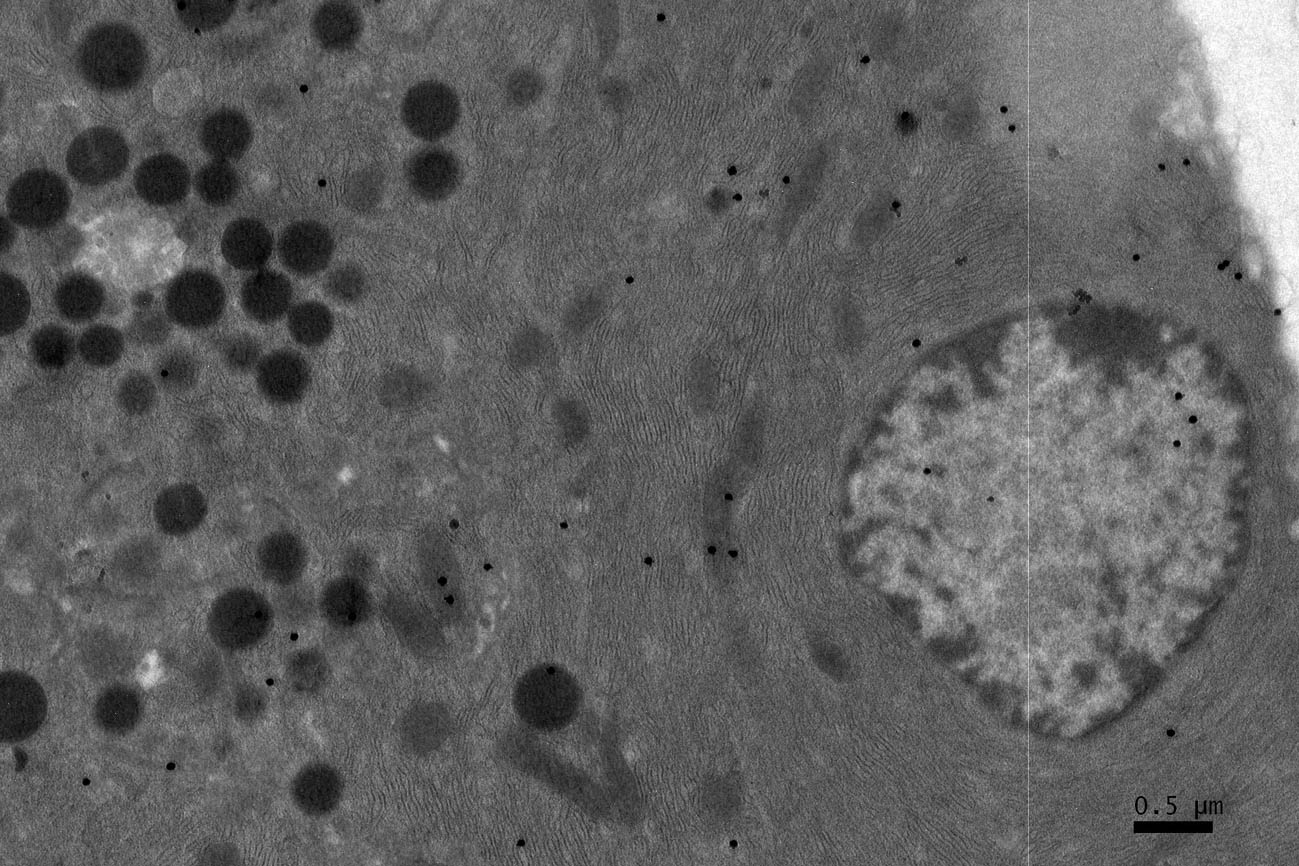
Figure 2. EM RAG of a pancreatic acinar cell of a postnatal day 7 mouse labeled with 3H-leucine (× 3,000).
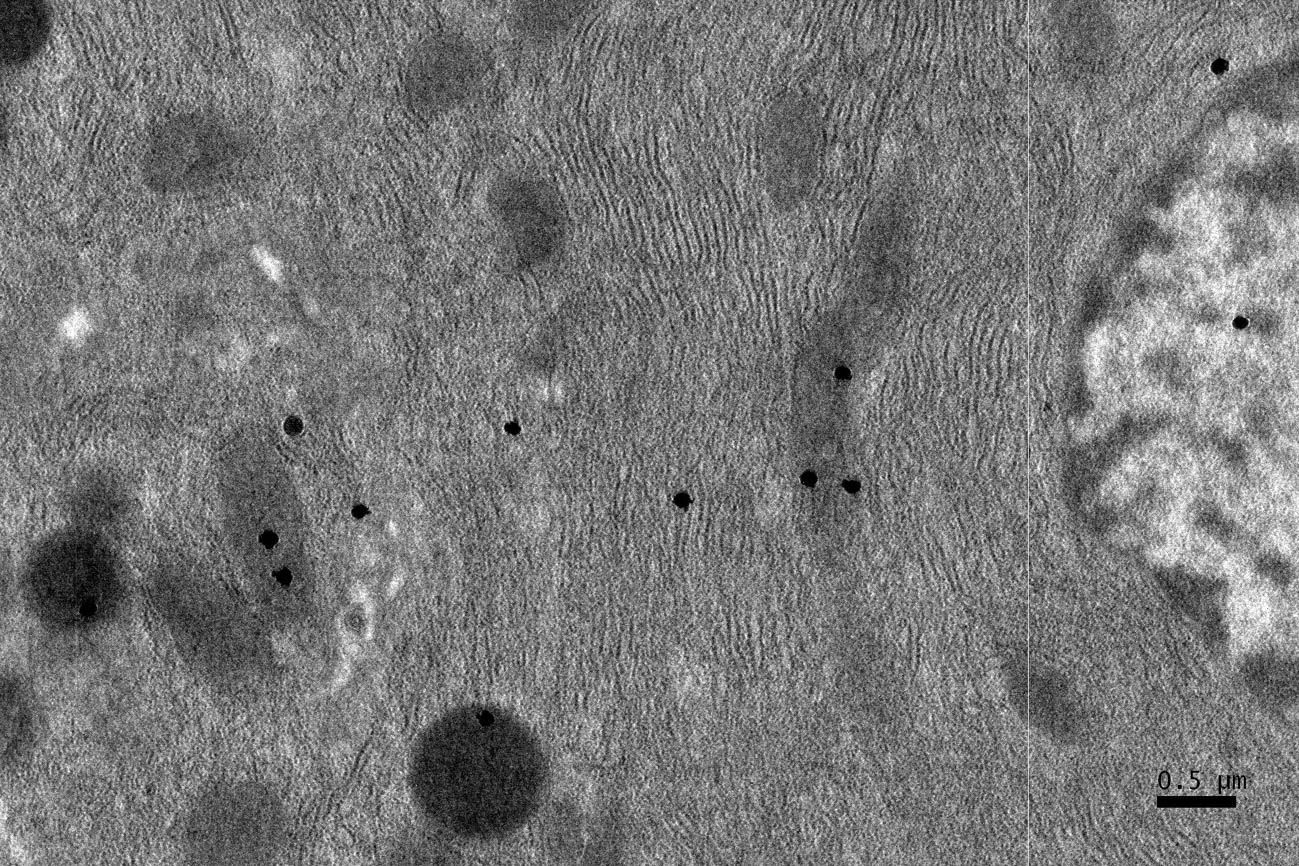
Figure 3. A high power magnification EM RAG of a pancreatic acinar cell of a postnatal day 14 mouse containing a nucleus and several mitochondria labeled with 3H-leucine, showing several silver grains in a few mitochondria (× 6,000).
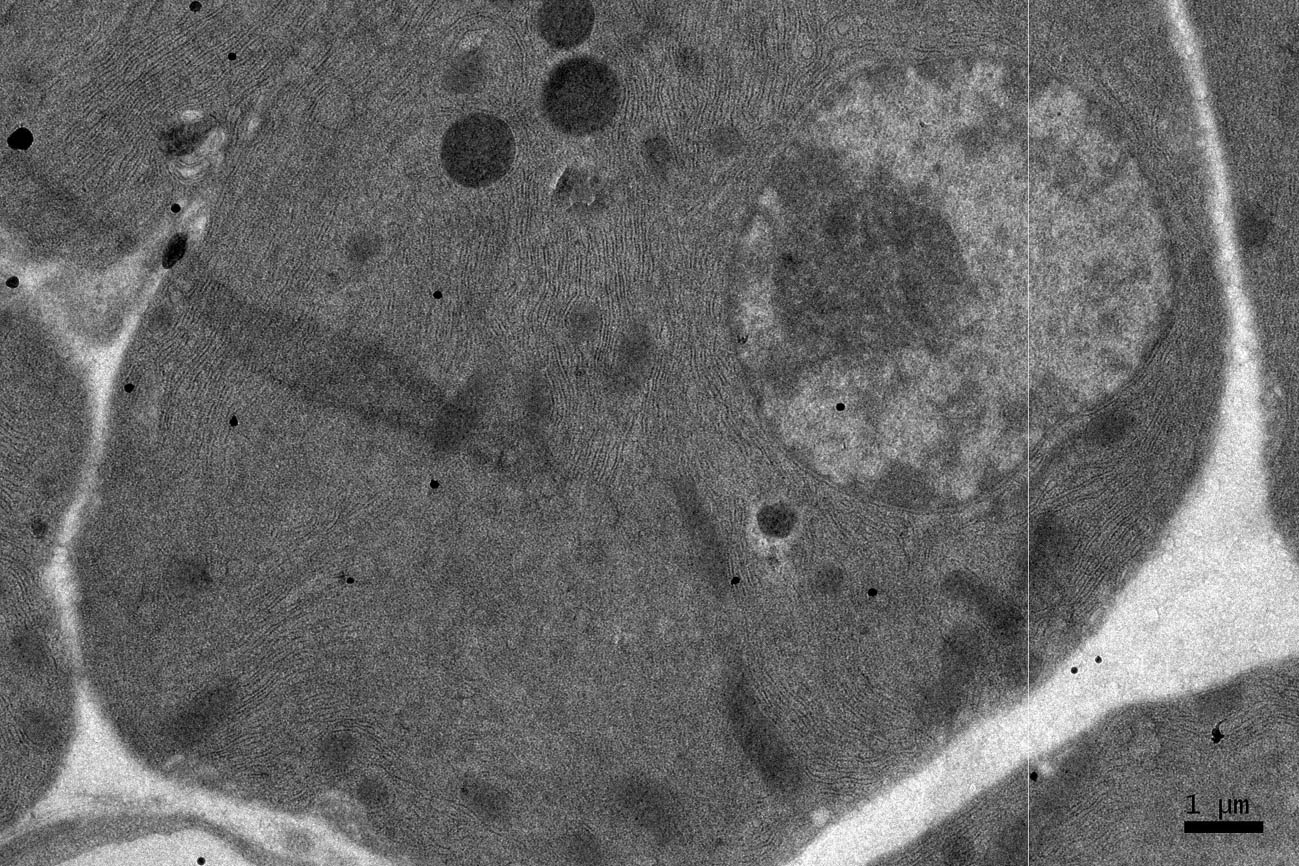
Figure 4. EM RAG of a pancreatic acinar cell of a postnatal month 6 mouse labeled with 3H-leucine, showing several silver grains on several mitochondria and cytoplasmic matrix (× 6,000).
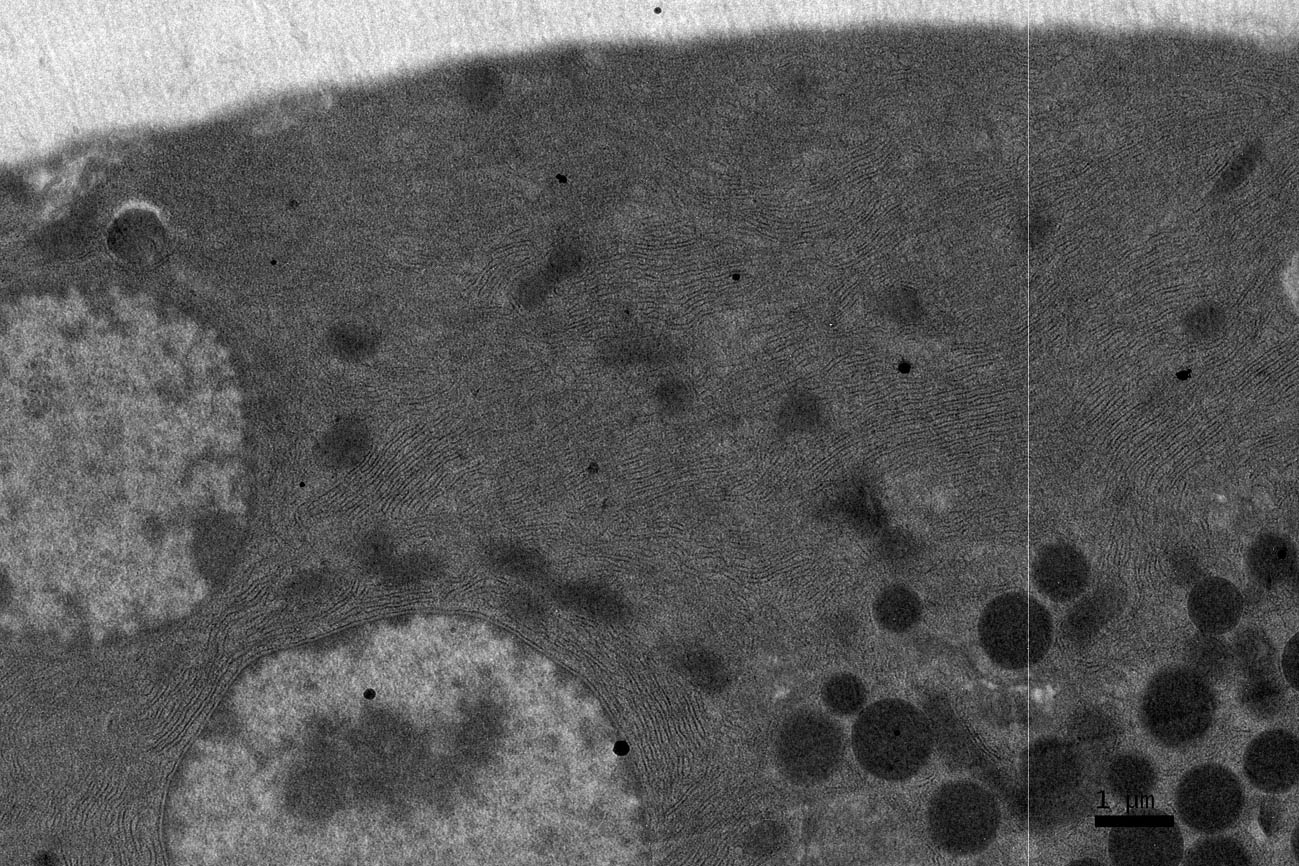
Figure 5. EM RAG of a pancreatic acinar cell of a postnatal month 24 mouse labeled with 3H-leucine, showing several silver grains over one of the 2 nuclei as well as over a few mitochondria and endoplasmic reticulum (× 6,000).
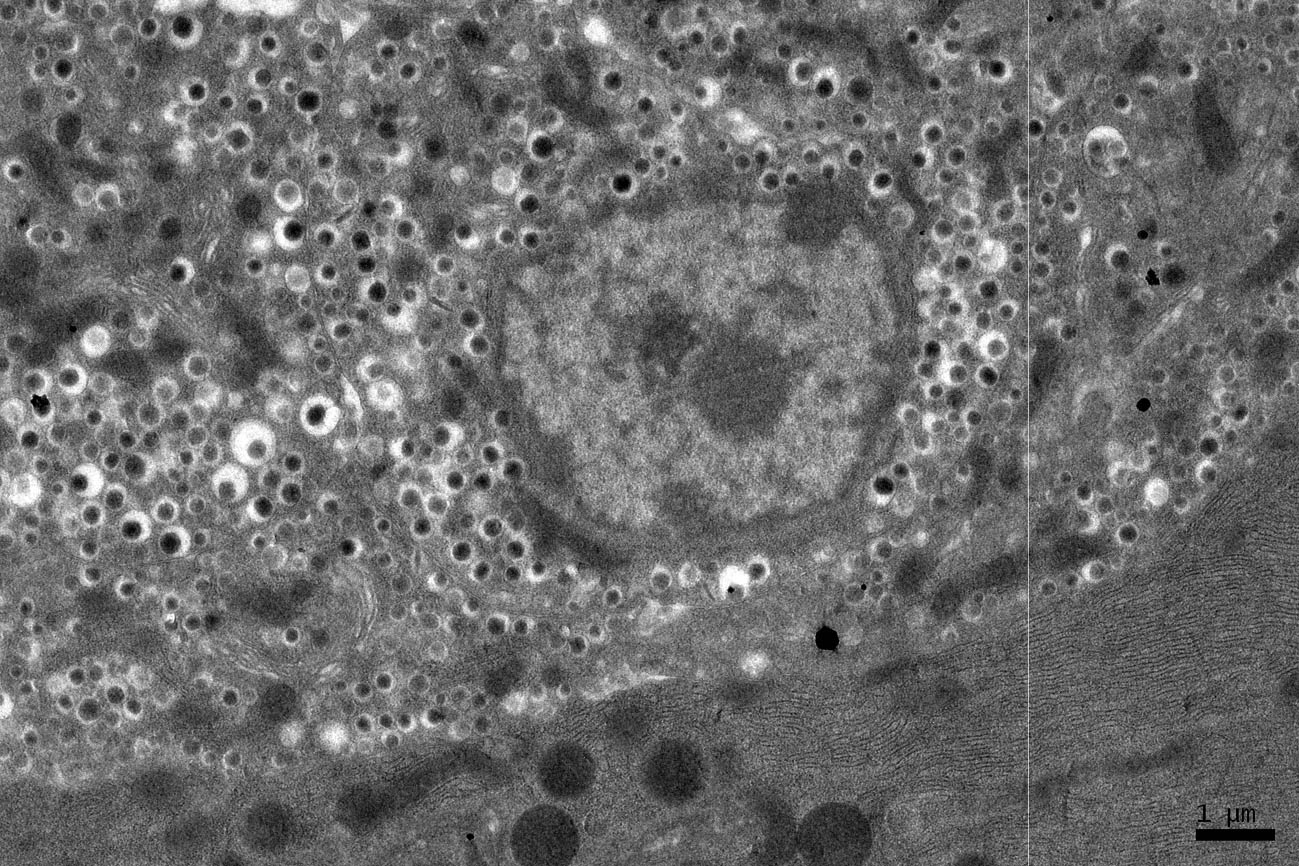
Figure 6. EM RAG of an endocrine cell (the islet of Langerhans) and a pancreatic acinar cell of a postnatal month 24 mouse labeled with 3H-leucine, showing less silver grains in the endocrine cell than the exocrine cell (× 3,000).
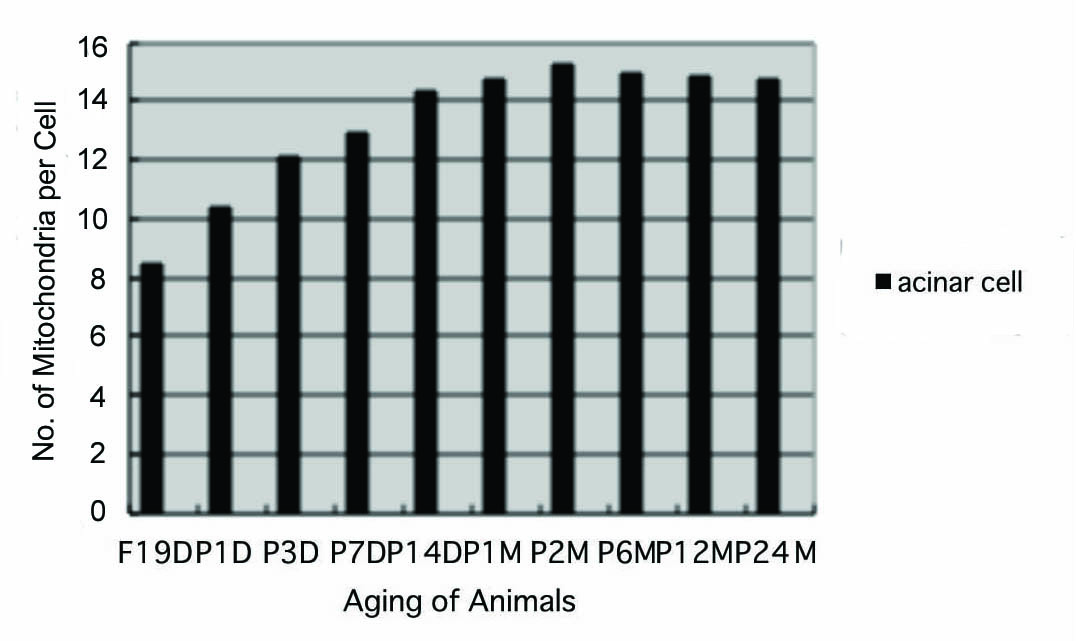
Figure 7. Histogram showing the number of mitochondria per cell in respective aging groups labeled with 3H-leucine.
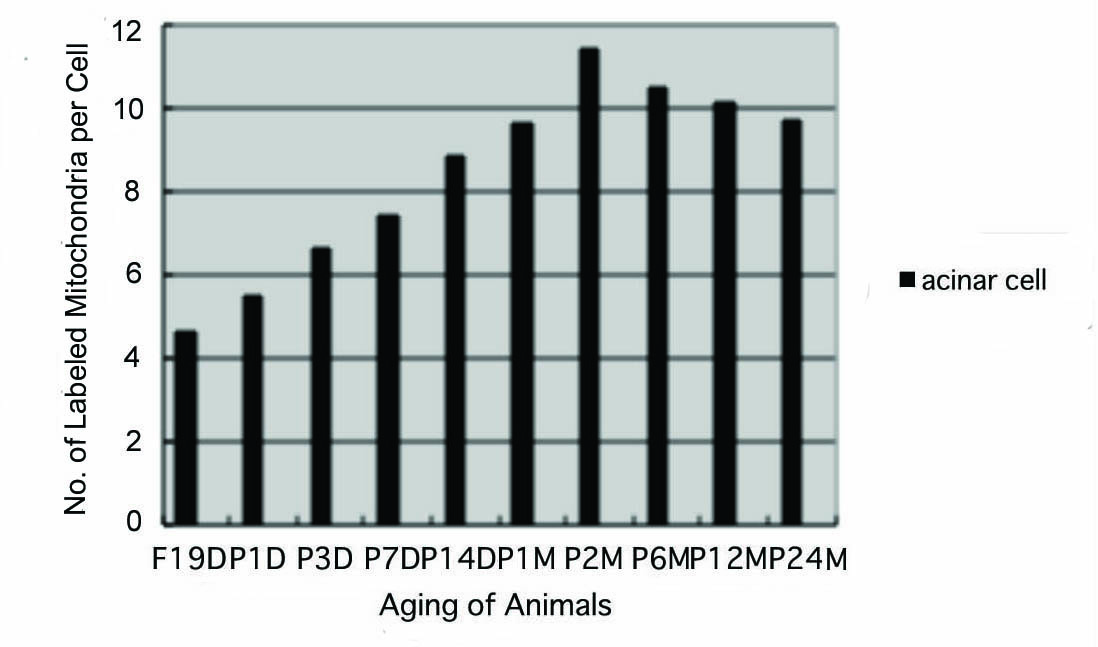
Figure 8. Histogram showing the number of labeled mitochondria per cell in respective aging groups labeled with 3H-leucine.
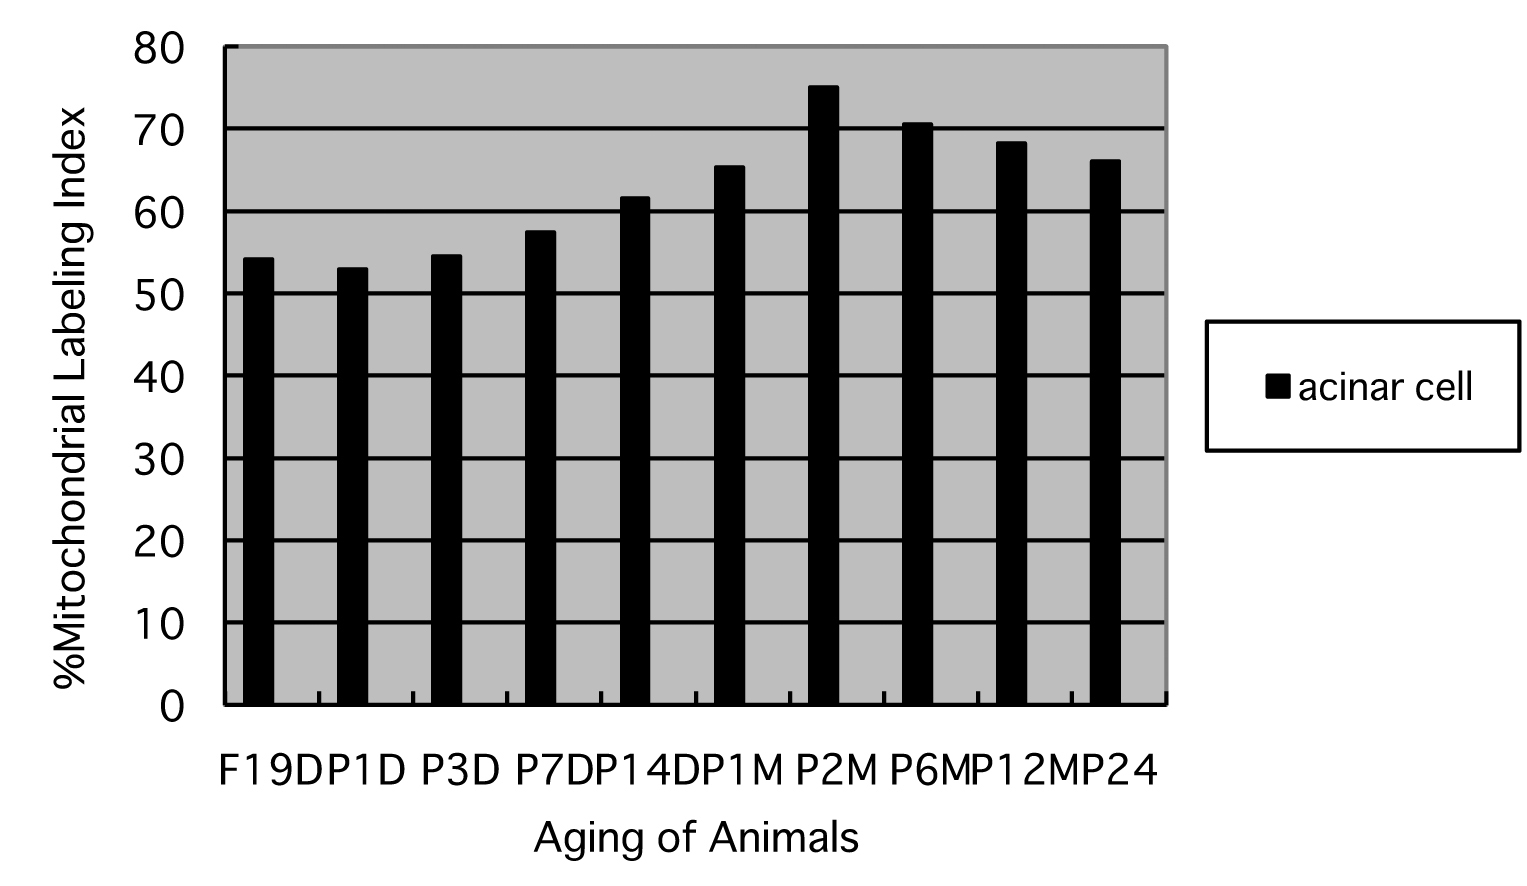
Figure 9. Histogram showing the average labeling indices in respective aging groups labeled with 3H-leucine.