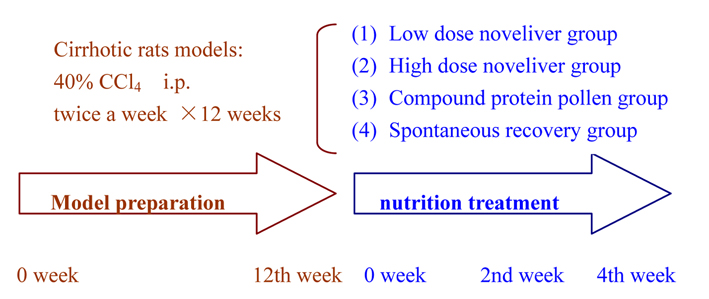
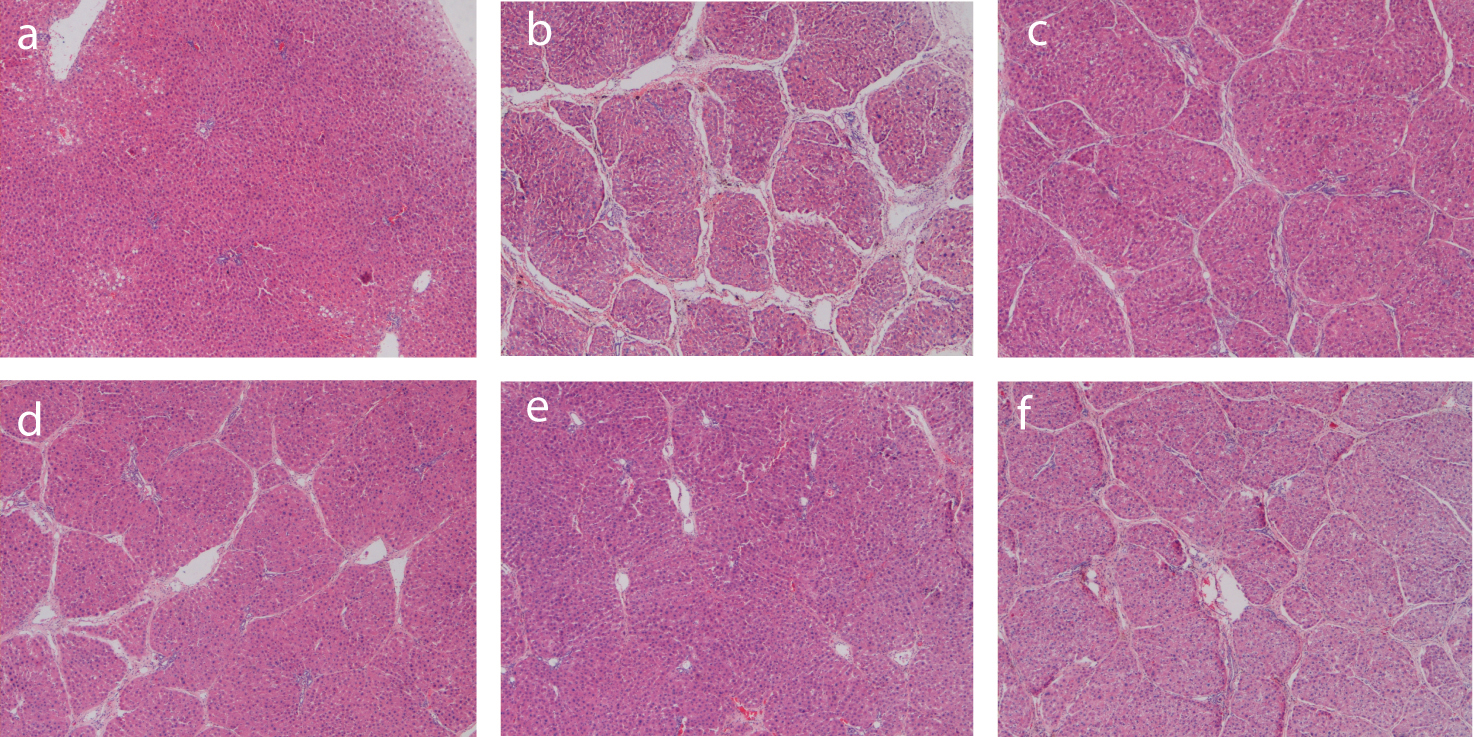
Figure 1. Illustration of rat model preparation and nutrition Treatment.
| Gastroenterology Research, ISSN 1918-2805 print, 1918-2813 online, Open Access |
| Article copyright, the authors; Journal compilation copyright, Gastroenterol Res and Elmer Press Inc |
| Journal website http://www.gastrores.org |
Original Article
Volume 3, Number 6, December 2010, pages 253-261
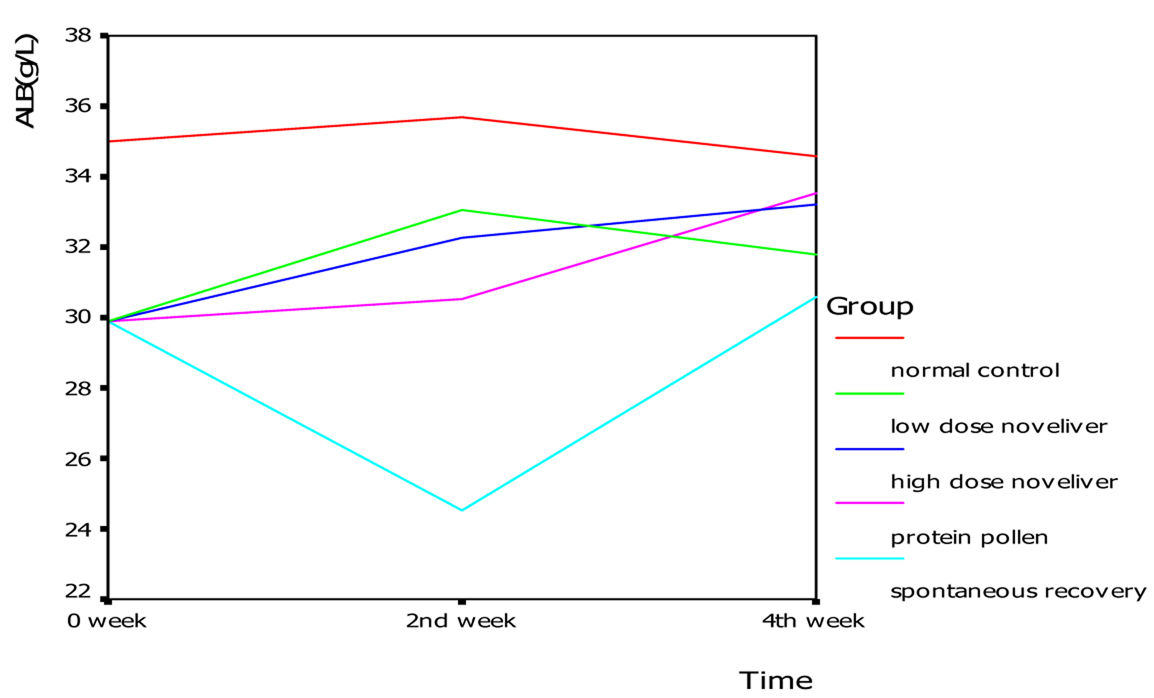
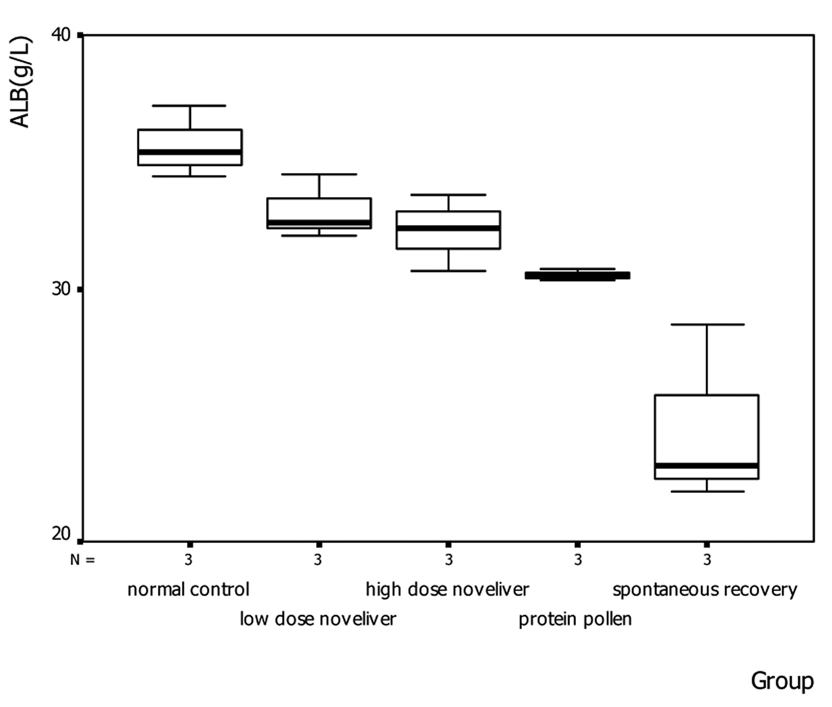
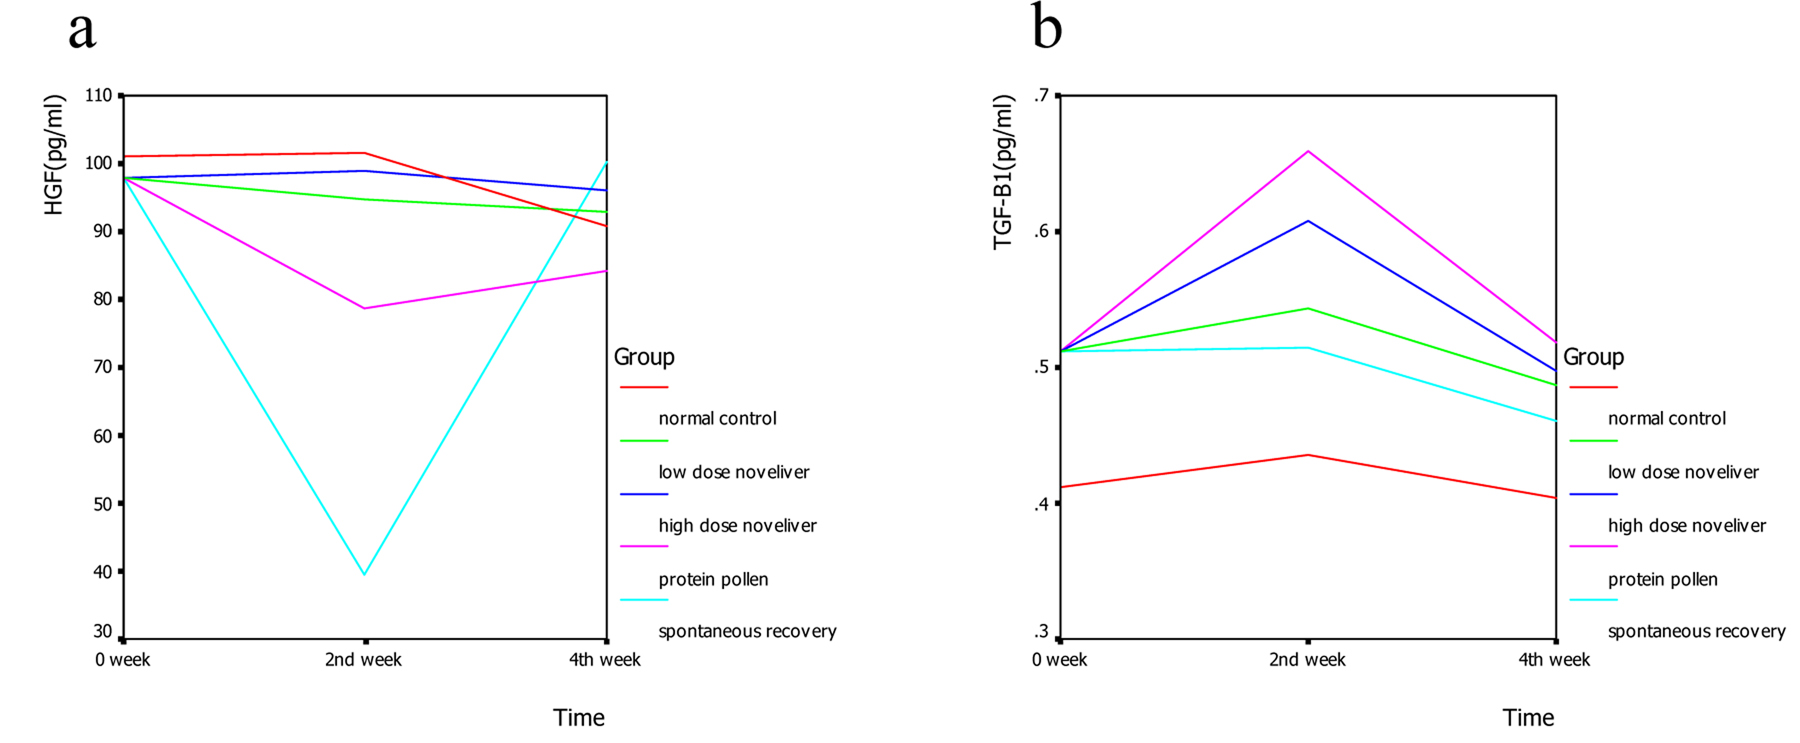
Compound Pollen Protein Nutrient Increases Serum Albumin in Cirrhotic Rats
Figures
Tables
| ALT (U/L) | AST (U/L) | TBil (µmol/L) | DBil (µmol/L) | |
|---|---|---|---|---|
| Normal control group | 65.4 ± 11.57 | 209.78 ± 38.69 | 3.25 ± 2.96 | 0.8 ± 0.42 |
| Cirrhotic model group | 156.35 ± 61.19 | 446.2 ± 182.65 | 5.57 ± 2.83 | 1.88 ± 0.82 |
| ALT (U/L) | AST (U/L) | TBil (µmol/L) | DBil (µmol/L) | |
|---|---|---|---|---|
| Normal control group | 61.17 ± 7.47 | 178.5 ± 41.27 | 1.7 ± 0.36 | 0.63 ± 0.15 |
| Low dose noveliver group | 63.80 ± 15.39 | 167.93 ± 14.75 | 2.47 ± 0.21 | 1.1 ± 0.4 |
| High dose noveliver group | 57.30 ± 10.15 | 173.23 ± 26.23 | 2.53 ± 0.74 | 0.8 ± 0.26 |
| Compound protein pollen group | 77.87 ± 11.05 | 189.6 ± 33.47 | 3 ± 0.17 | 0.7 ± 0.2 |
| Spontaneous recovery group | 71.28 ± 24.72 | 174.23 ± 35.32 | 7.48 ± 4.32 | 3.81 ± 2.7 |
| ALT (U/L) | AST (U/L) | TBil (µmol/L) | DBil (µmol/L) | |
|---|---|---|---|---|
| Normal control group | 54.83 ± 15.02 | 223.57 ± 32.71 | 2 ± 0.36 | 1.13 ± 0.21 |
| Low dose noveliver group | 52.23 ± 6.50 | 161.9 ± 27.54 | 3.35 ± 1.77 | 1.5 ± 0.58 |
| High dose noveliver group | 58.7 ± 7.67 | 161.65 ± 41.35 | 2.0 ± 0.36 | 0.68 ± 0.10 |
| Compound protein pollen group | 74.2 ± 15.44 | 194.5 ± 41.06 | 2.2 ± 0.95 | 0.97 ± 0.12 |
| Spontaneous recovery group | 75.6 ± 22.97 | 205 ± 56.90 | 2.53 ± 0.38 | 0.93 ± 0.12 |