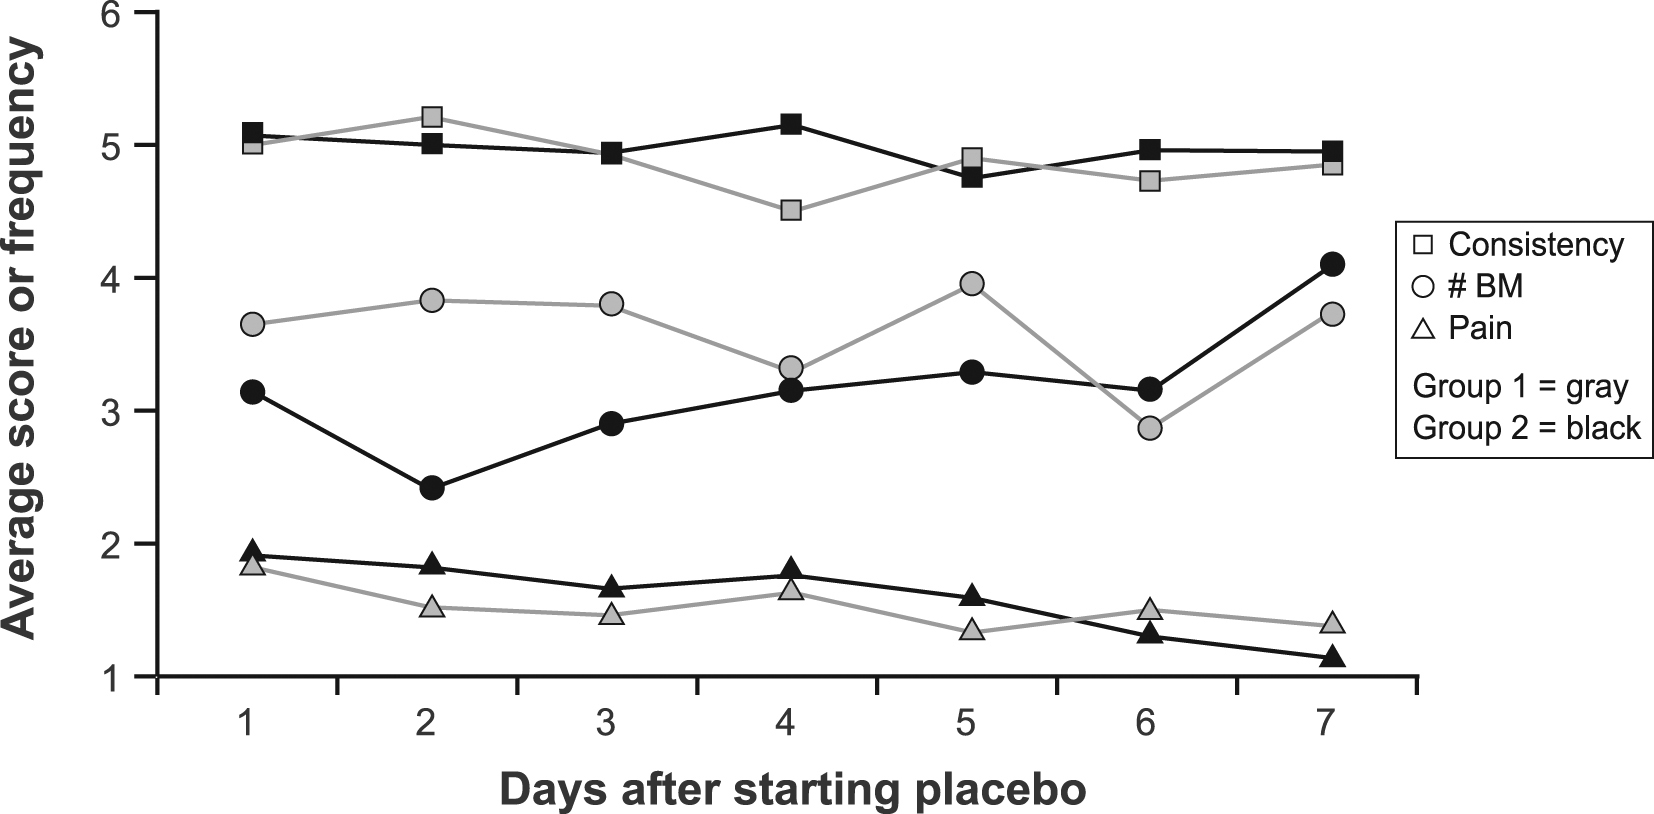
Figure 1. Average daily stool consistency score, frequency and pain score by group during the first 7 days of treatment. Abbreviations: BM, bowel movement.
| Gastroenterology Research, ISSN 1918-2805 print, 1918-2813 online, Open Access |
| Article copyright, the authors; Journal compilation copyright, Gastroenterol Res and Elmer Press Inc |
| Journal website http://www.gastrores.org |
Original Article
Volume 3, Number 5, October 2010, pages 185-190
Does Timing of Colon Procedures Affect Outcomes in D-IBS Trials?
Figures
Tables
| Characteristic | Group 1 (n = 28) | Group 2 (n = 24) |
|---|---|---|
| Age (year), mean (sd) | 46.9 (14.9) | 49.7 (14.1) |
| Race (% white), n (%) | 27 (96%) | 22 (91%) |
| Gender (% female), n (%) | 19 (68%) | 18 (75%) |
| Height (cm), mean (sd) | 167.7 (8.2) | 166.0 (9.0) |
| Weight (kg), mean (sd) | 76.2 (13.6) | 77.9 (16.2) |
| Years since onset of IBS symptoms, mean (sd) | 13.9 (12.7) | 13.2 (14.9) |
| Years since IBS diagnosis, mean (sd) | 2.3 (2.4) | 4.2 (9.0) |
| Full colonoscopy (instead of sigmoidoscopy), n (%) | 25 (89%) | 23 (96%) |
| Days between colon procedure and first dose of placebo, mean (sd) | 4.9 (2.2) Range: 1 - 3 | 506 (329) Range: 35 - 1160 |
| Symptom | Group 1 (n = 28) Mean (sd) | Group 2 (n = 24 ) Mean (sd) | P Value |
|---|---|---|---|
| Pain score | 2.07 (0.39) | 2.12 (0.46) | 0.327 |
| Number of bowel movements | 3.15 (1.25) | 3.95 (2.33) | 0.100 |
| Consistency | 5.07 (0.85) | 5.28 (1.00) | 0.371 |
| Percentage of screening days with urgency | 80.6 (22.7) | 80.8 (19.9) | > 0.999 |
| Symptom | Week | Group 1 (n = 28) | Group 2 (n = 24) | P Valueb |
|---|---|---|---|---|
| aValues shown are group mean changes from the screening period in unadjusted symptom scores. | ||||
| bP value from test of group difference at each week from repeated measures model adjusted for baseline value. | ||||
| Mean change from baseline in pain score | 1 | -0.528 | -0.544 | 0.966 |
| 2 | -0.703 | -0.619 | 0.968 | |
| 3 | -0.767 | -0.805 | 0.488 | |
| 4 | -0.644 | -0.767 | 0.150 | |
| 5 | -0.789 | -0.639 | 0.860 | |
| 6 | -0.895 | -0.571 | 0.662 | |
| 7 | -0.948 | -0.872 | 0.506 | |
| 8 | -0.845 | -0.881 | 0.361 | |
| 9 | -0.923 | -0.916 | 0.431 | |
| 10 | -1.055 | -0.834 | 0.901 | |
| 11 | -0.991 | -0.909 | 0.659 | |
| 12 | -0.948 | -0.874 | 0.973 | |
| Mean change from baseline in number of bowel movements | 1 | -0.084 | -0.428 | 0.379 |
| 2 | -0.192 | -0.650 | 0.299 | |
| 3 | -0.138 | -0.583 | 0.187 | |
| 4 | -0.264 | -0.751 | 0.122 | |
| 5 | -0.309 | -0.280 | 0.765 | |
| 6 | -0.338 | -0.390 | 0.686 | |
| 7 | -0.161 | -1.072 | 0.014 | |
| 8 | -0.308 | -0.517 | 0.628 | |
| 9 | -0.078 | -0.686 | 0.127 | |
| 10 | -0.114 | -0.450 | 0.403 | |
| 11 | -0.294 | -0.641 | 0.290 | |
| 12 | -0.276 | -0.111 | 0.577 | |
| Mean change from baseline in consistency | 1 | -0.118 | -0.492 | 0.173 |
| 2 | -0.400 | -0.254 | 0.377 | |
| 3 | -0.370 | -0.539 | 0.507 | |
| 4 | -0.142 | -0.506 | 0.086 | |
| 5 | -0.284 | -0.149 | 0.833 | |
| 6 | -0.422 | -0.444 | 0.487 | |
| 7 | -0.278 | -0.710 | 0.047 | |
| 8 | -0.139 | -0.607 | 0.049 | |
| 9 | -0.178 | -0.772 | 0.010 | |
| 10 | -0.558 | -0.573 | 0.706 | |
| 11 | -0.301 | -0.476 | 0.238 | |
| 12 | -0.474 | -0.305 | 0.661 | |
| Mean change from baseline in percentage of days with urgency | 1 | -0.102 | -0.126 | 0.8194 |
| 2 | -0.147 | -0.174 | 0.6878 | |
| 3 | -0.150 | -0.250 | 0.6348 | |
| 4 | -0.199 | -0.227 | 0.6007 | |
| 5 | -0.166 | -0.176 | 0.8077 | |
| 6 | -0.211 | -0.198 | 0.8531 | |
| 7 | -0.162 | -0.266 | 0.0571 | |
| 8 | -0.129 | -0.299 | 0.1459 | |
| 9 | -0.226 | -0.321 | 0.2236 | |
| 10 | -0.254 | -0.303 | 0.3325 | |
| 11 | -0.263 | -0.289 | 0.8031 | |
| 12 | -0.210 | -0.318 | 0.1737 | |