Figures
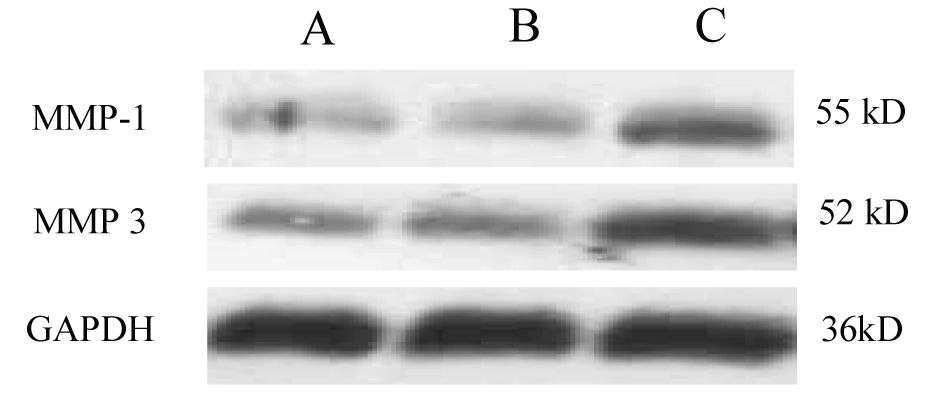
Figure 1. Western blot of MMP-1 and MMP-3 protein expression. Compared with control, MMP-1 and MMP-3 protein expression showed slight increase in non-SDUC patients, but significantly increased in the SDUC group. A, Control; B, non-SDUC group; C, SDUC group.
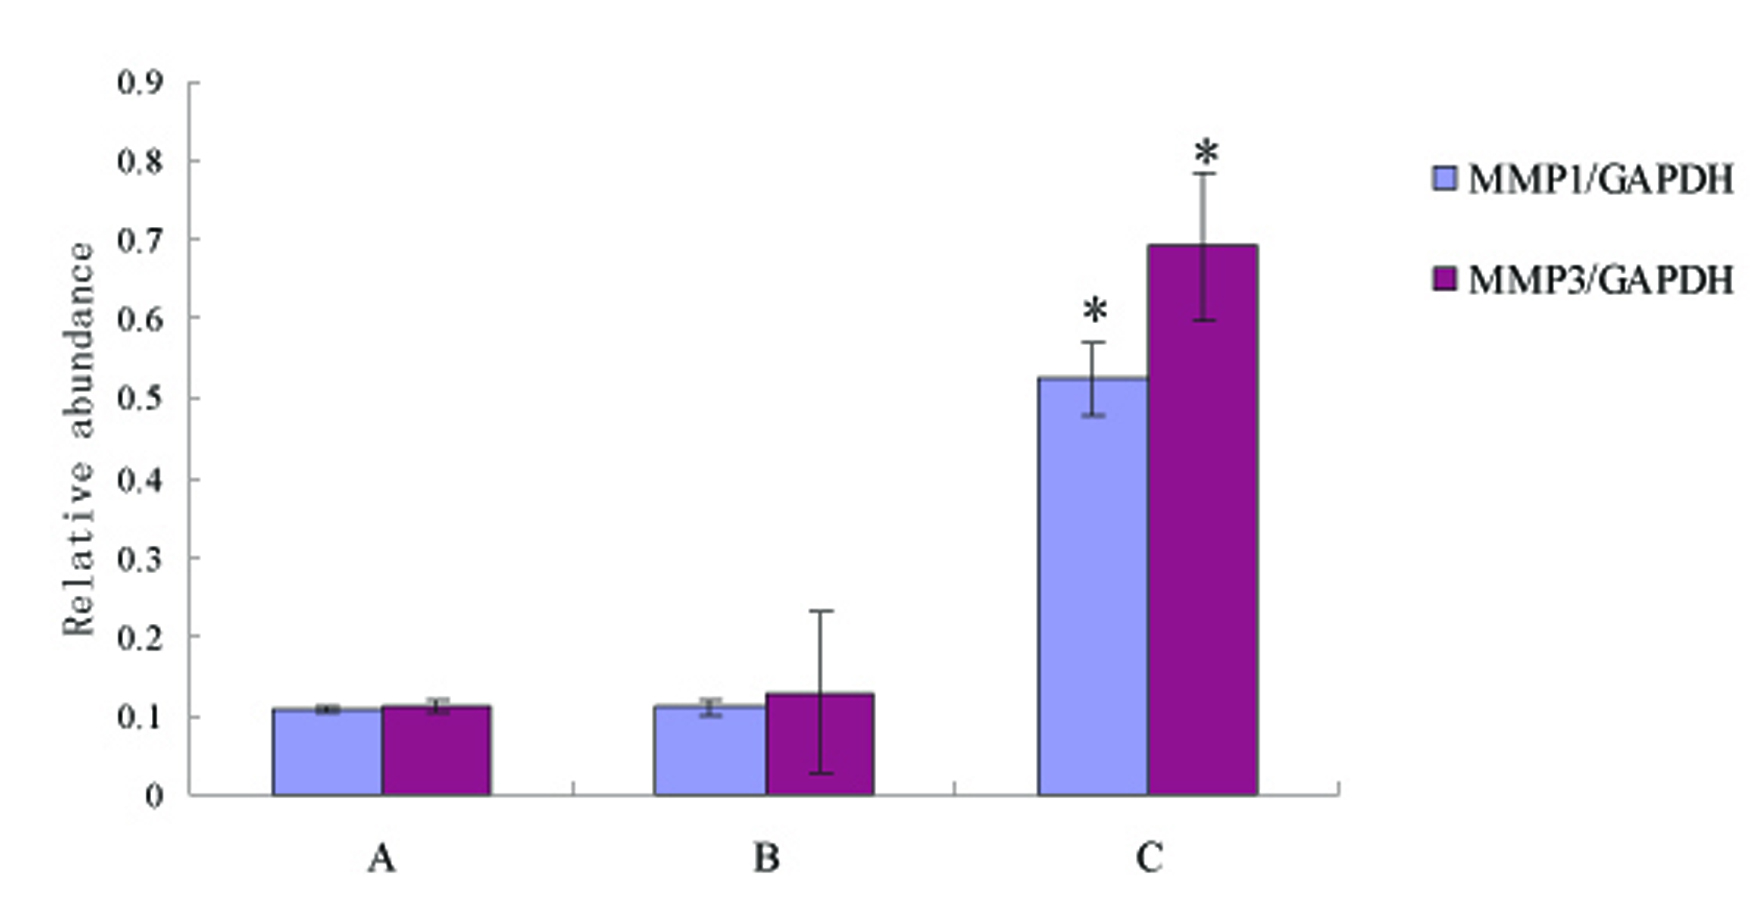
Figure 2. Compared with control, MMP-1 and MMP-3 protein expression showed slight increase in non-SDUC patients (p > 0.05), but significantly increased in the SDUC group (p < 0.01). A, Control; B, non-SDUC group; C, SDUC group. * P < 0.01.
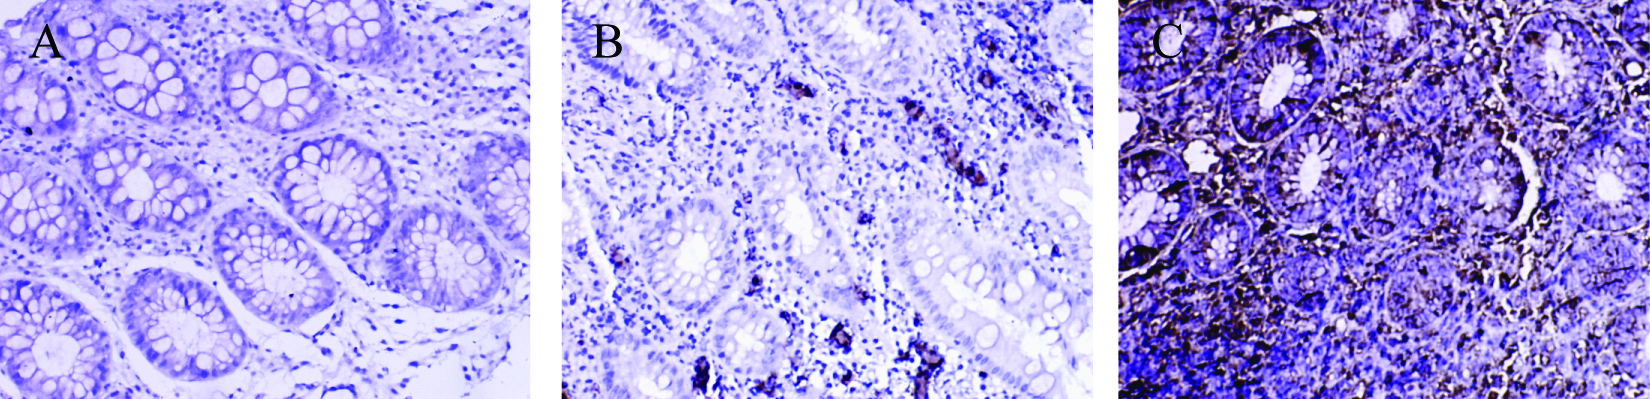
Figure 3. Immunohistochemical staining of MMP-1 protein in colonic tissue. There were no MMP-1 positive staining cells were found in control group; a small amount of MMP-1 positive staining cells were presented in non-SDUC group and were mainly located in glandular regions of colon; a large number of MMP-1 positive staining cells were shown in the SDUC group. A, Control; B, non-SDUC group; C, SDUC group. Original ×400.
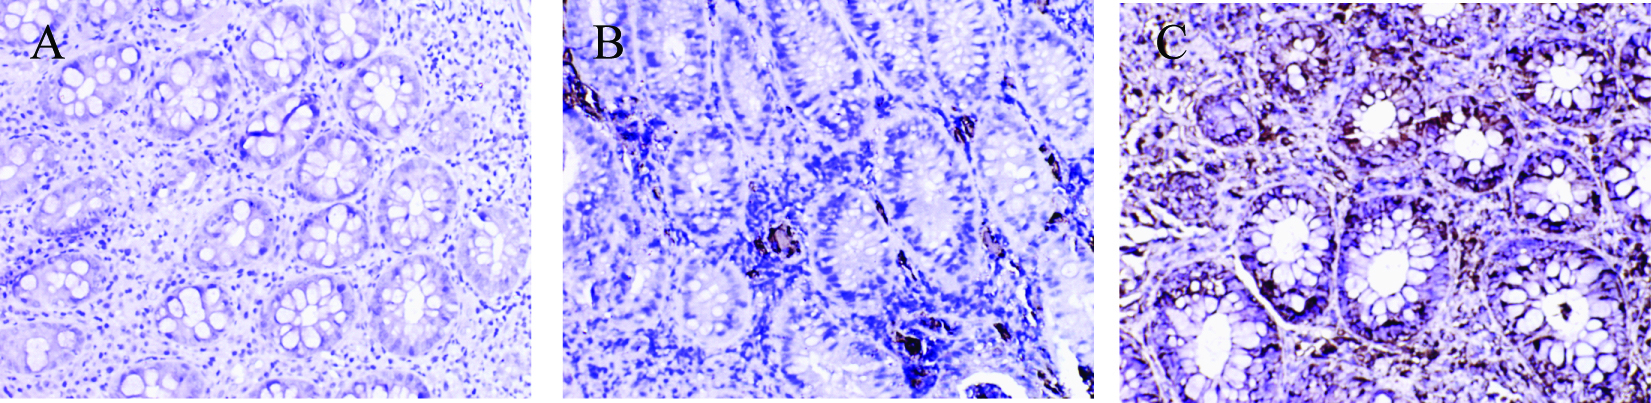
Figure 4. Immunohistochemical staining of MMP-3 protein in colonic tissue. There were no MMP-3 positive staining cells were found in control group; a small amount of MMP-3 positive staining cells were presented in non-SDUC group and were mainly located in glandular regions of colon; a large number of MMP-3 positive staining cells were shown in the SDUC group. A, Control; B, non-SDUC group; C, SDUC group. Original ×400.