Figures
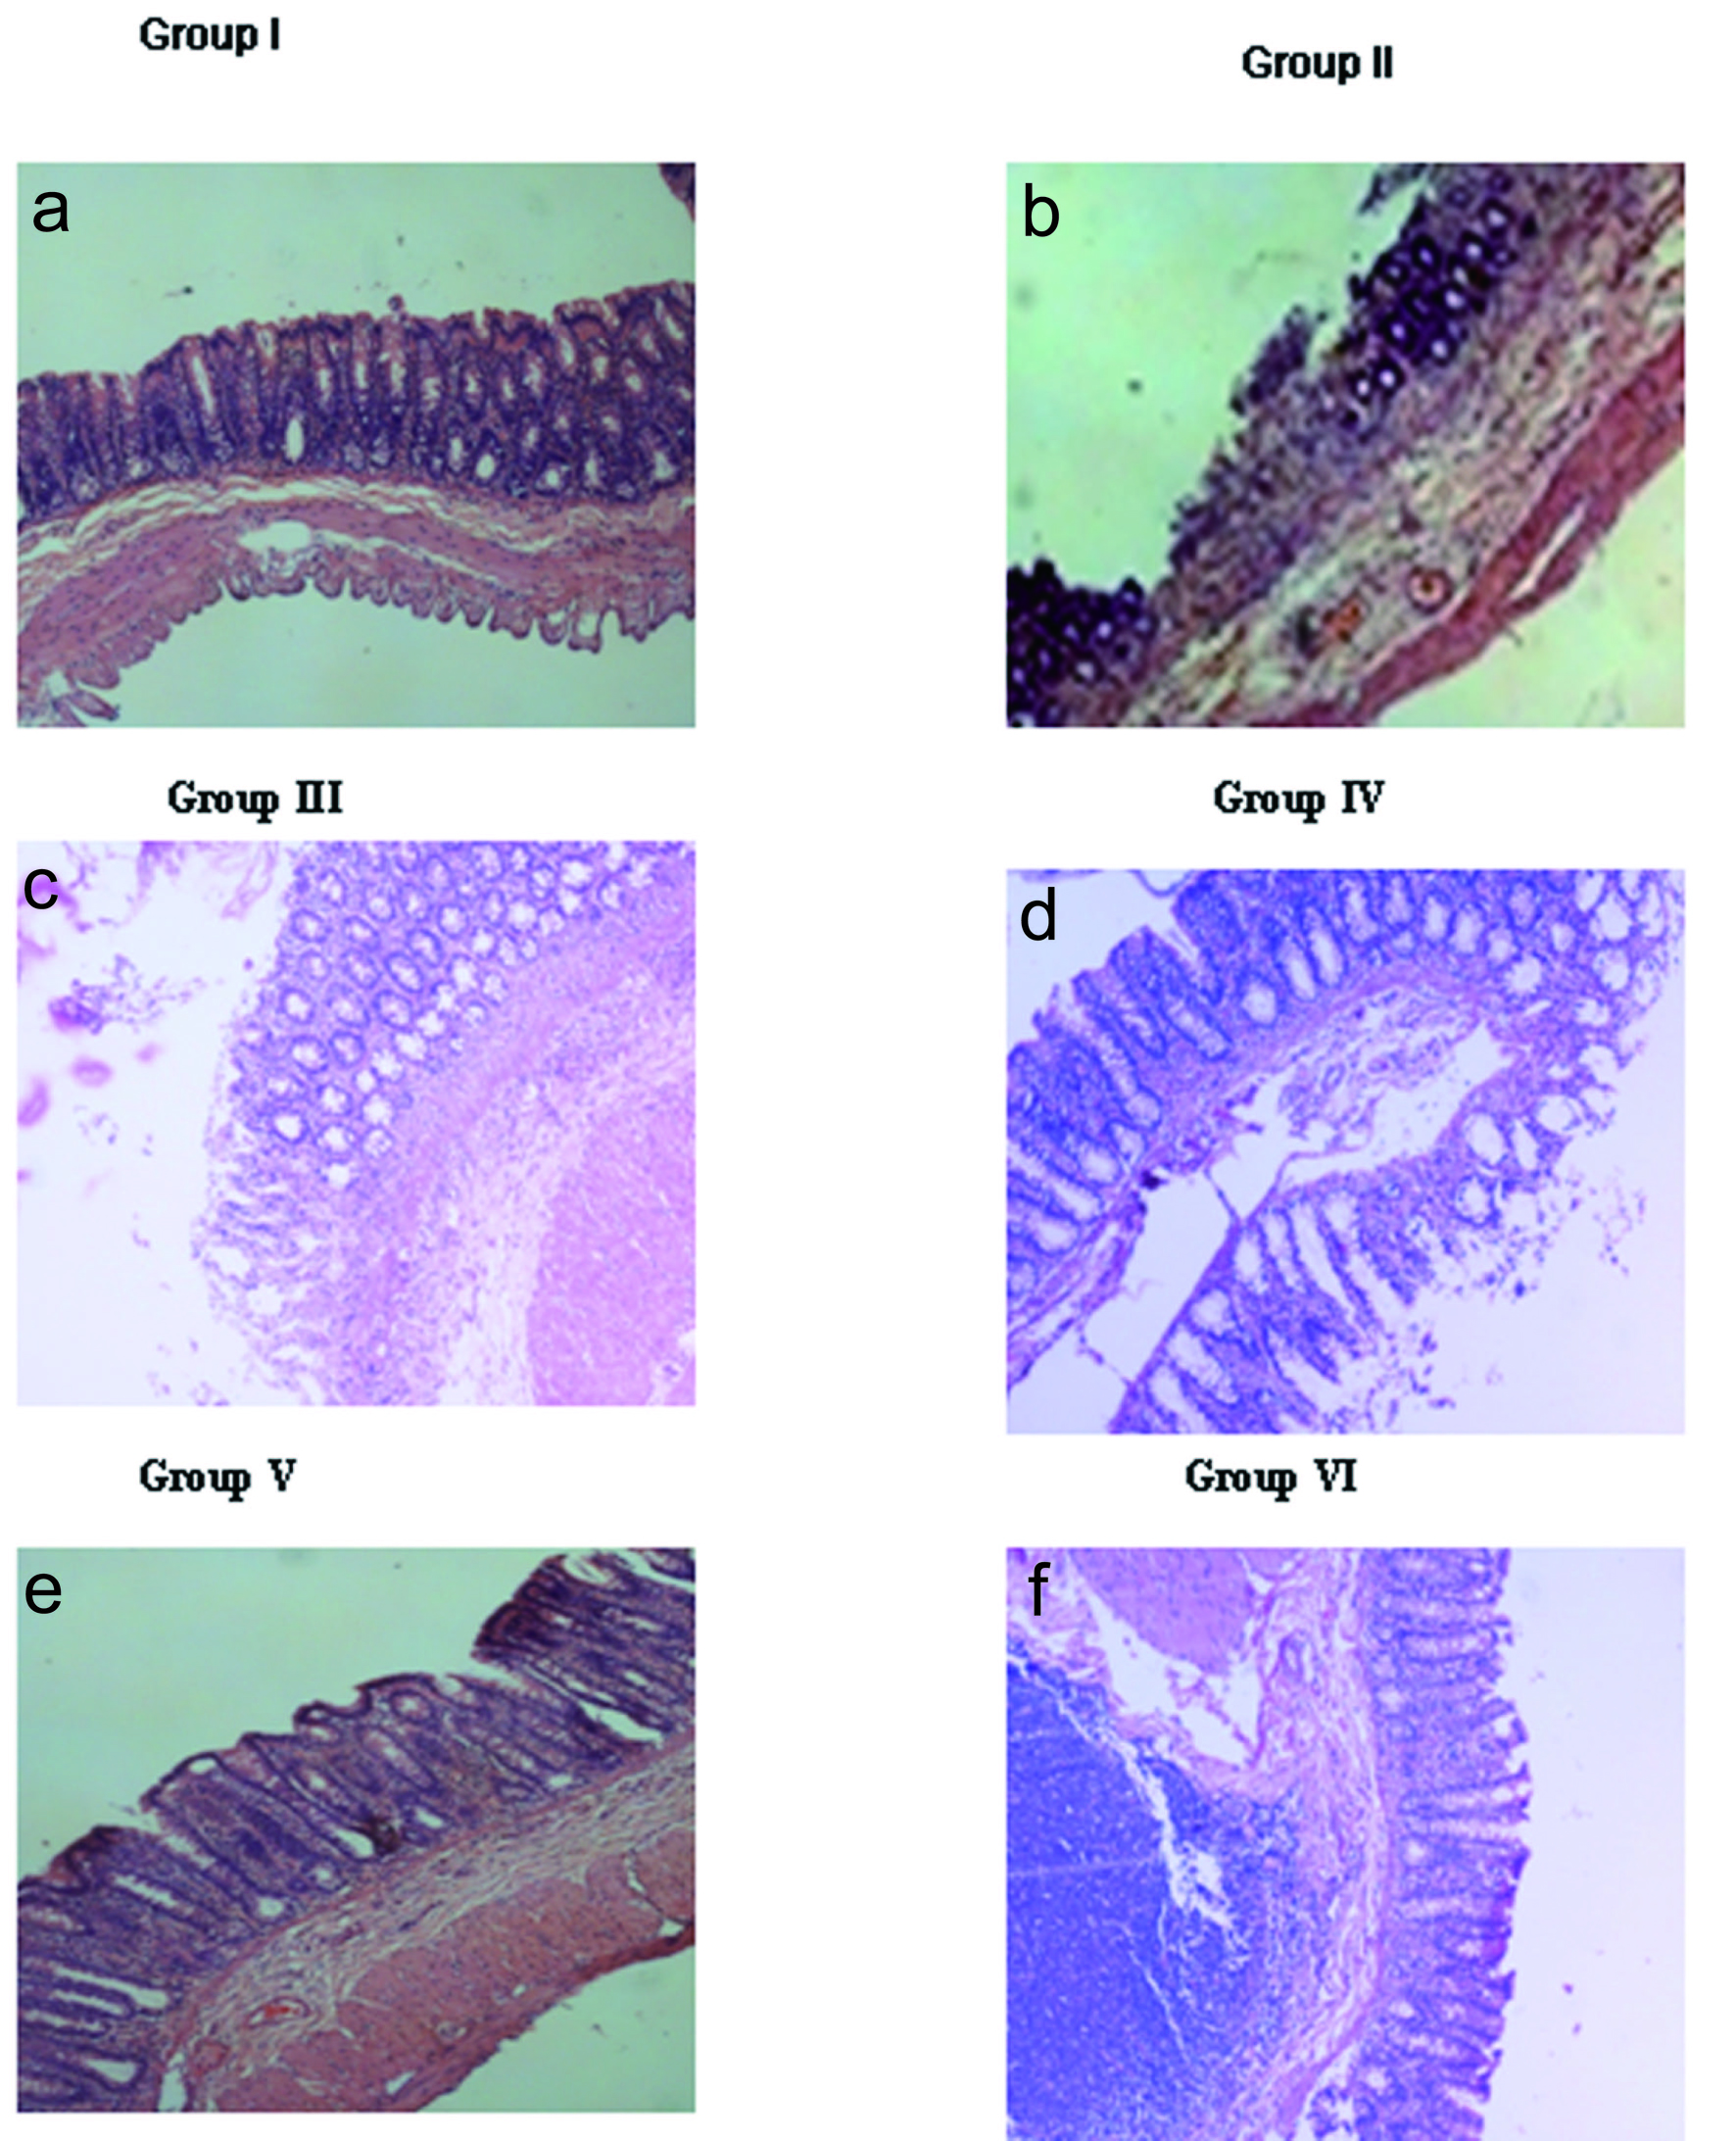
Figure 1. Histopathology. a) Normal mucosa seen in Group I animals; b) Ulceration (arrow) with inflammatory exudates and denudation of mucosal glands induced with only naproxen in Group II; c) Denudation of epithelial lining (arrow) with inflammatory cells in mucosa and submucosal layer in Group III animals (7 days); d) Mucosa of rhEGF treated animals, Group IV (7 days); e) Incomplete regeneration of mucosa (arrow) seen along with lymphoid hyperplasia in Group V animals (14 days); f) Complete regeneration of mucosa seen in the rhEGF treated animals, Group VI (14 days). Magnification is 100 x for all the images. The data represented are from three independent identical experiments.
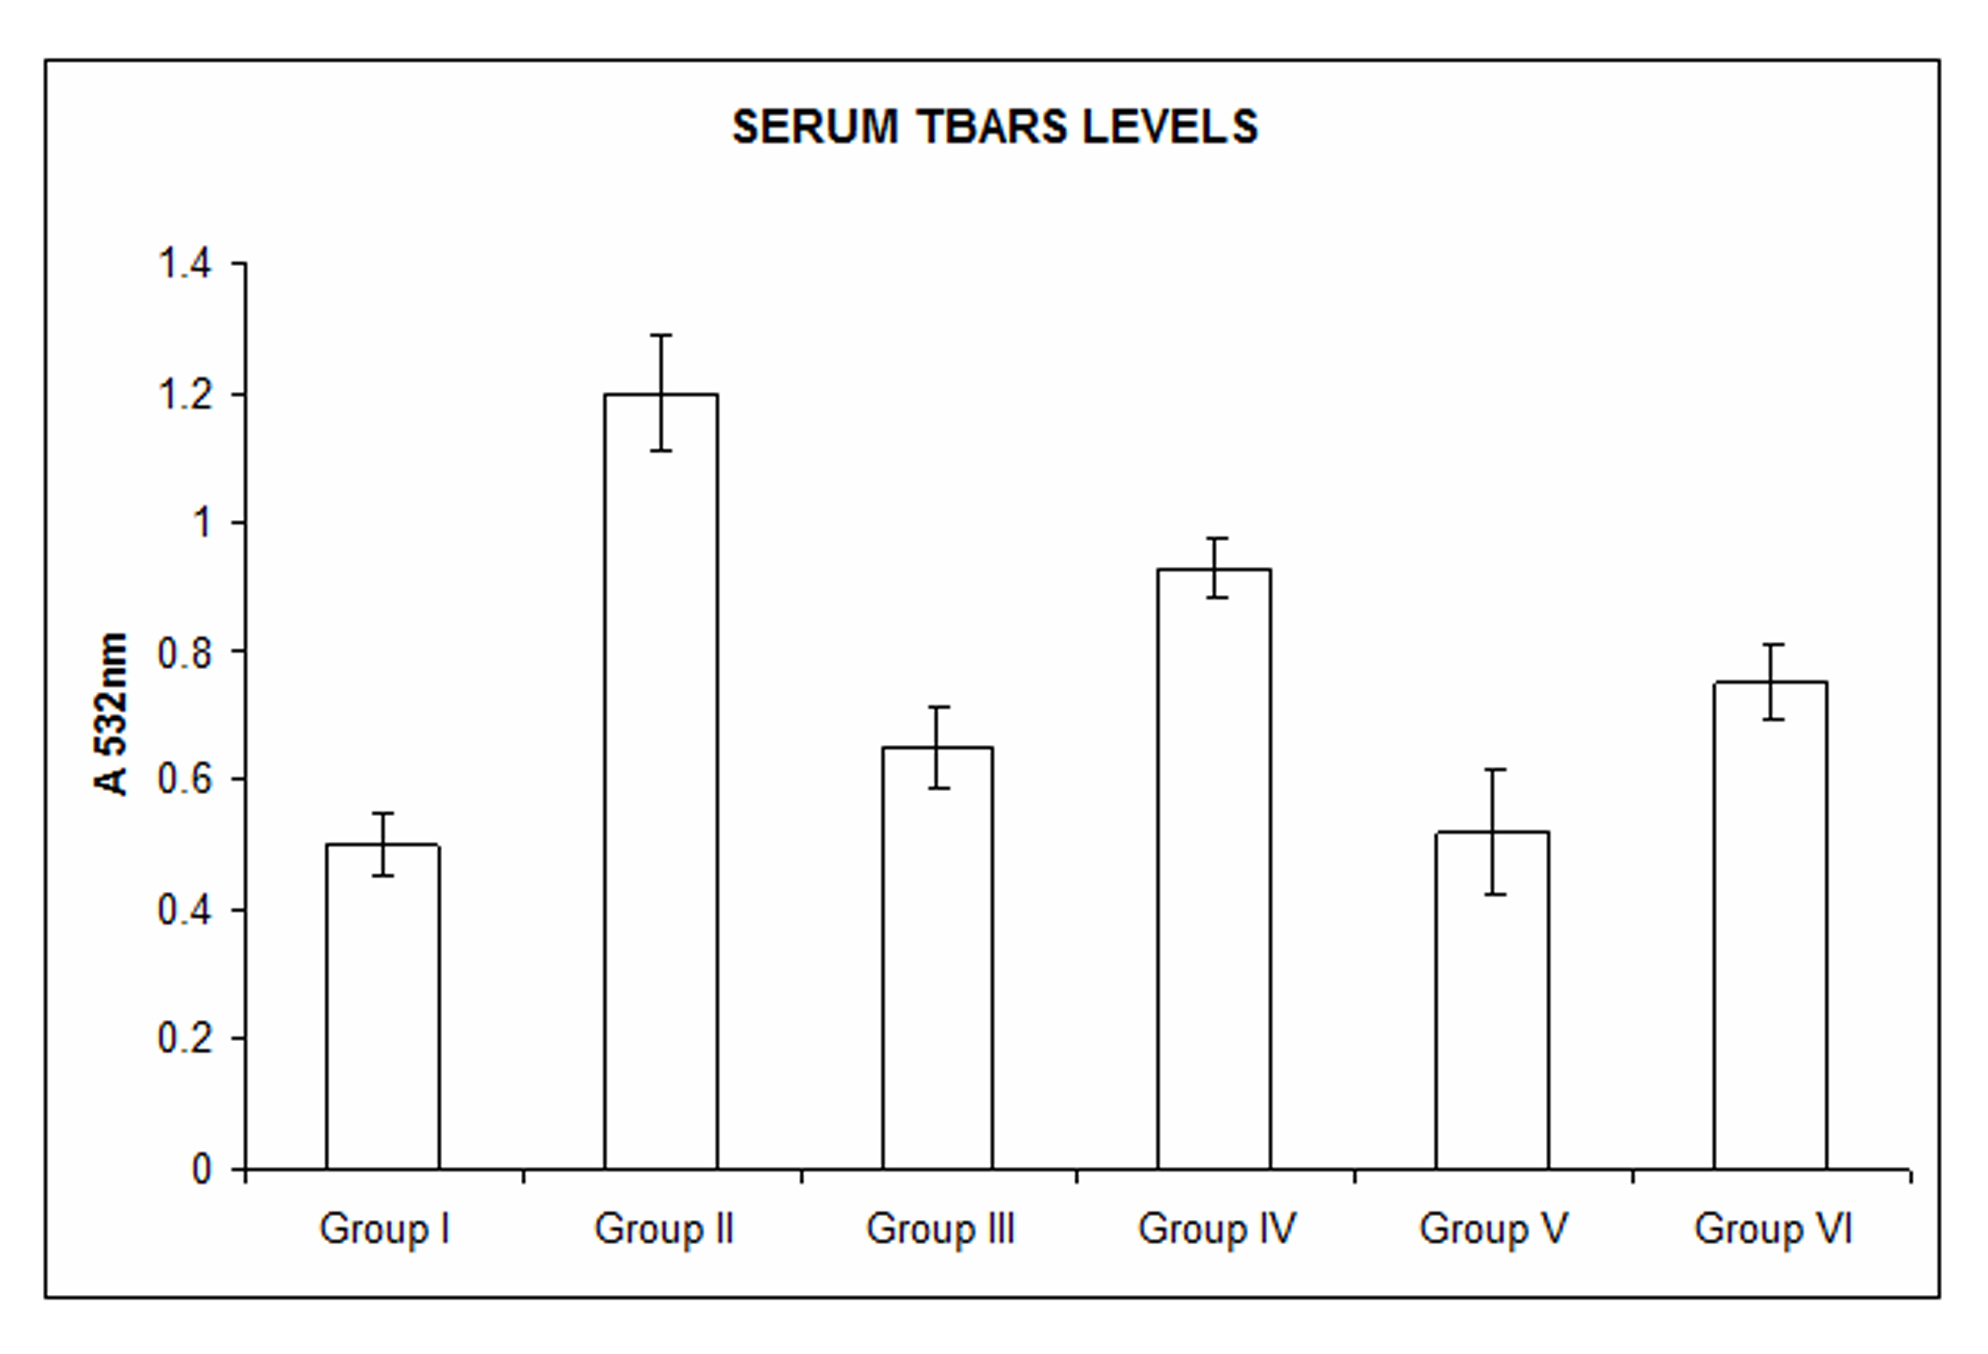
Figure 2. Measurement of serum TBARS. Serum TBARS levels were significantly increased with naproxen treatment in Group II, Group III and Group V animals. TBARS levels were decreased with rhEGF treatment in Group IV and Group VI animals which were comparable to the Group I (controls). Data are the means ± SE for three independent experiments. (P < 0.05 compared to Group I, Group IV and Group VI by one way ANOVA).
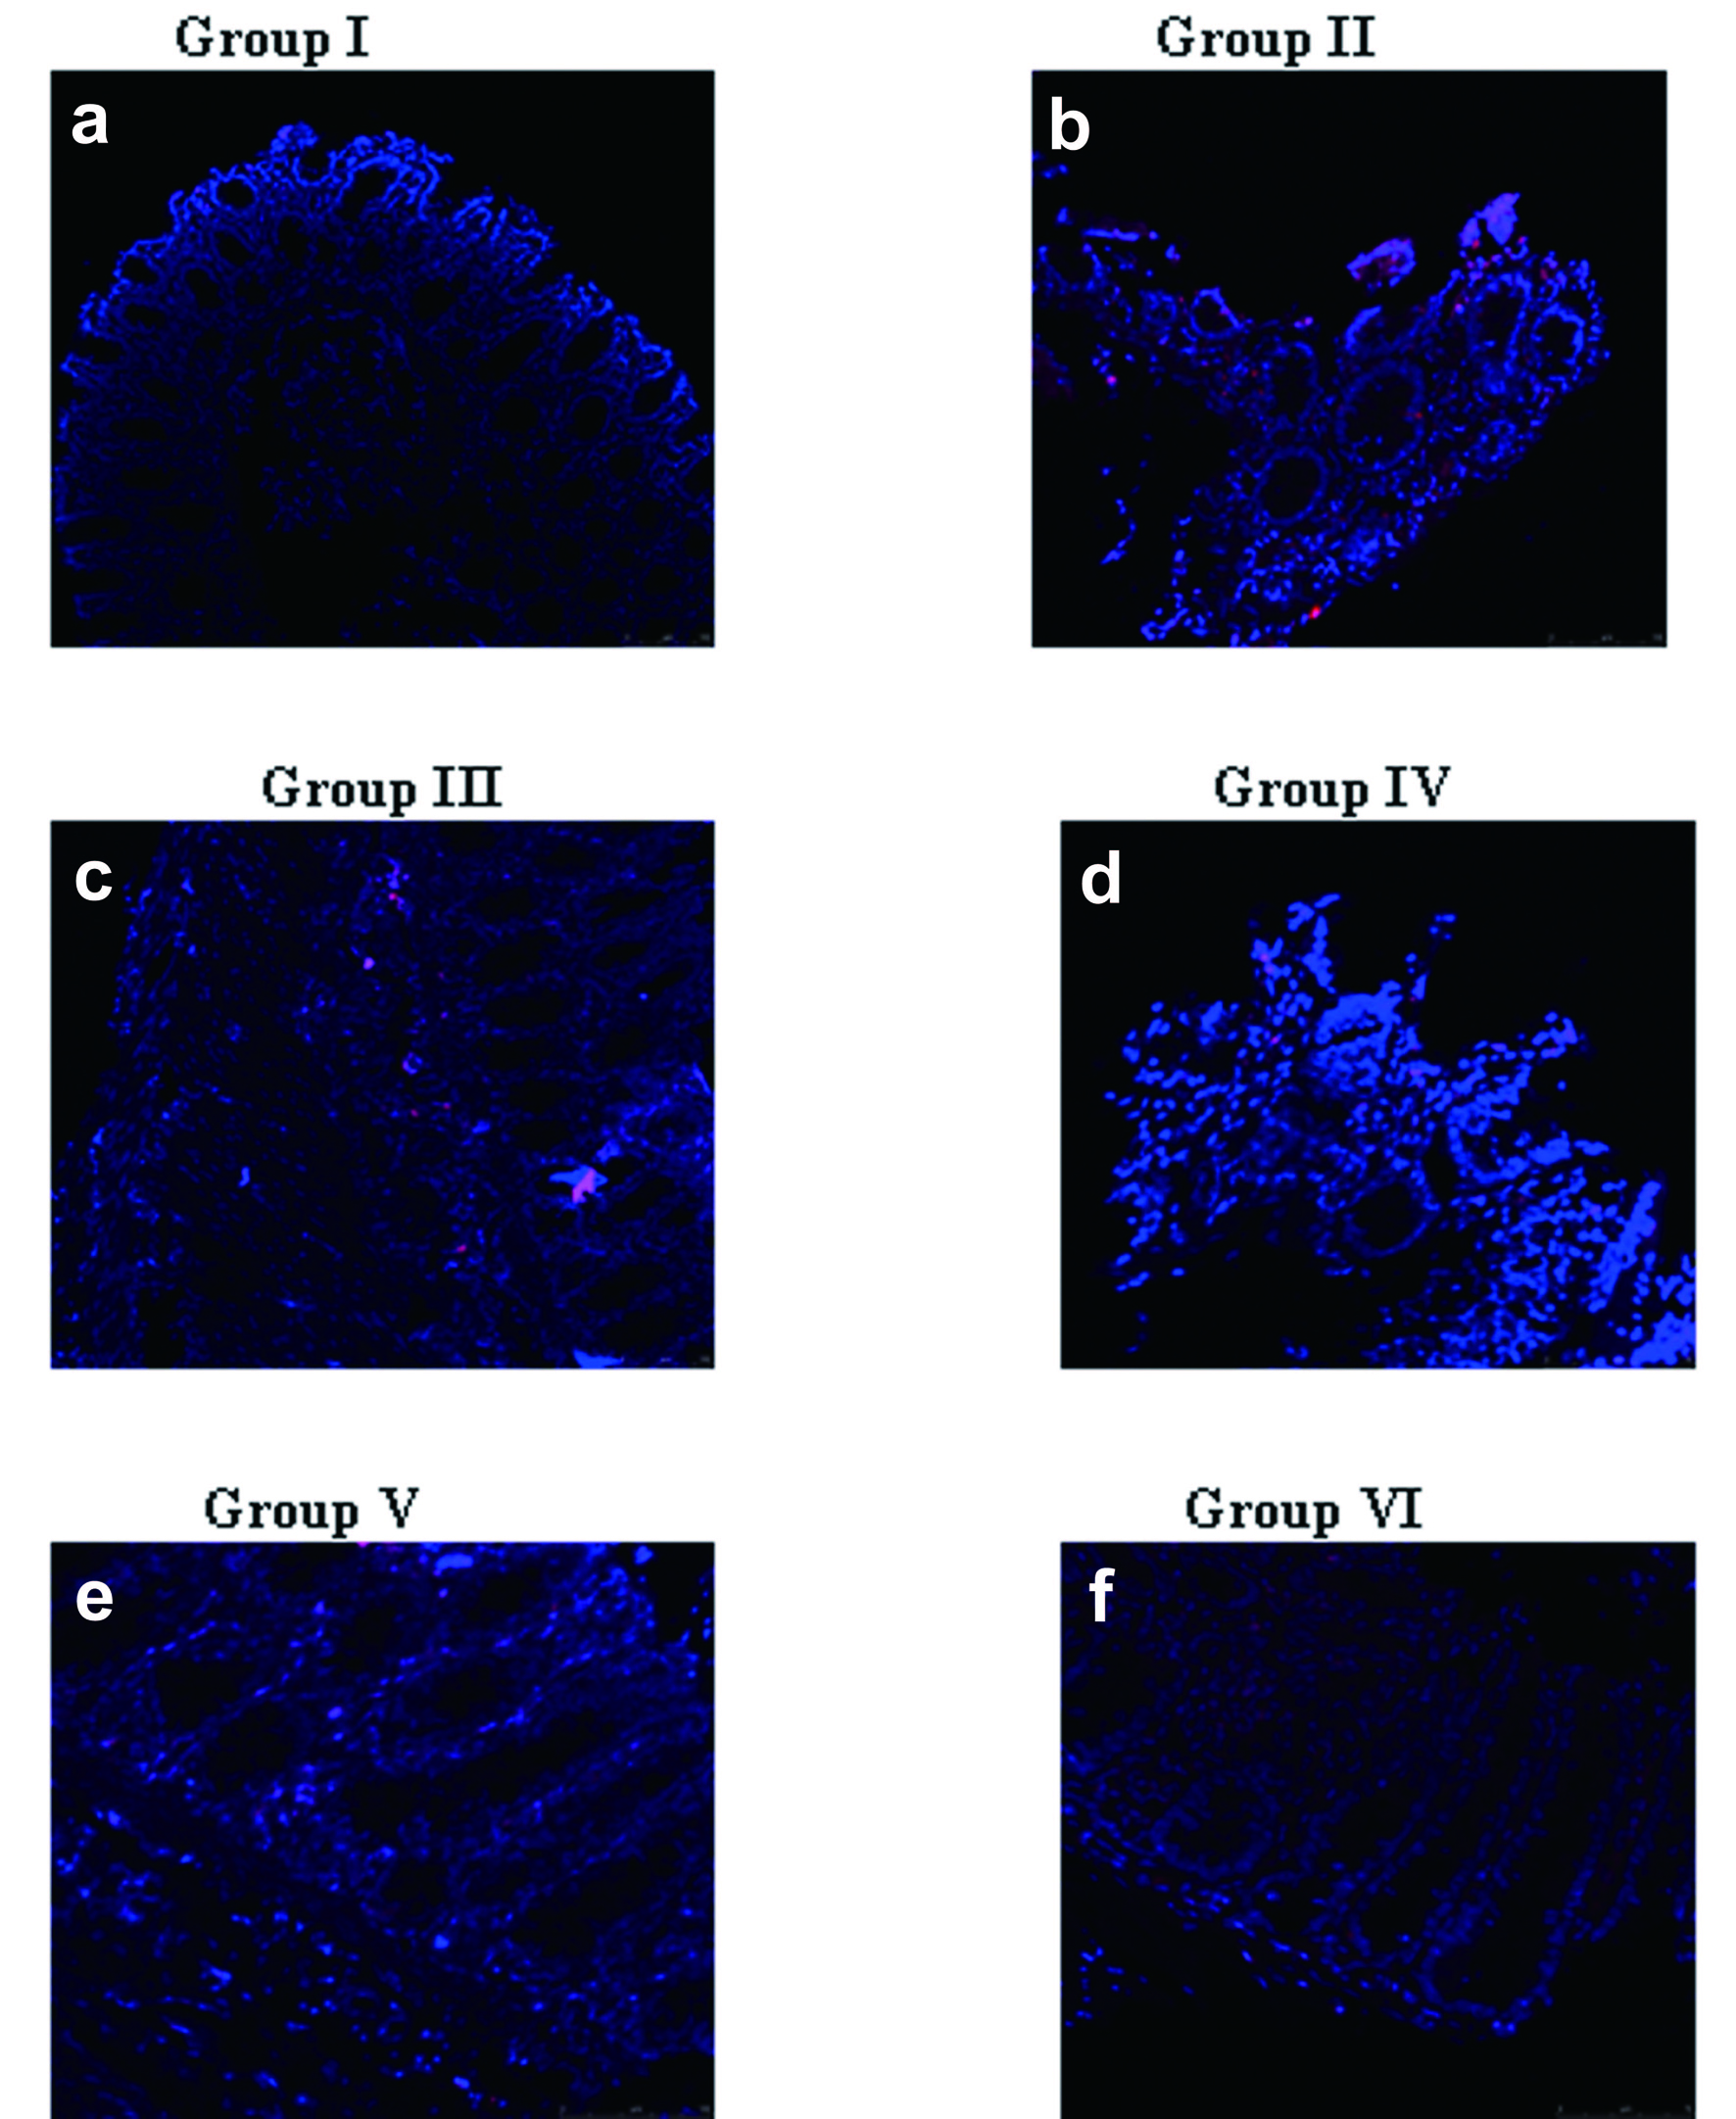
Figure 3. Immunolocalization of Cox-2. Cox-2 localization was weak in: a) Group I animals; d) rhEGF treated Group IV (7days); f) rhEGF treated Group VI (14days). However, a predominant localization was seen in naproxen treated animals such as: b) Group II; c) Group III; e) Group V. The data represented are from three independent identical experiments and the images have been captured with Nikon Inverted fluorescence microscope TE 2000-S series.
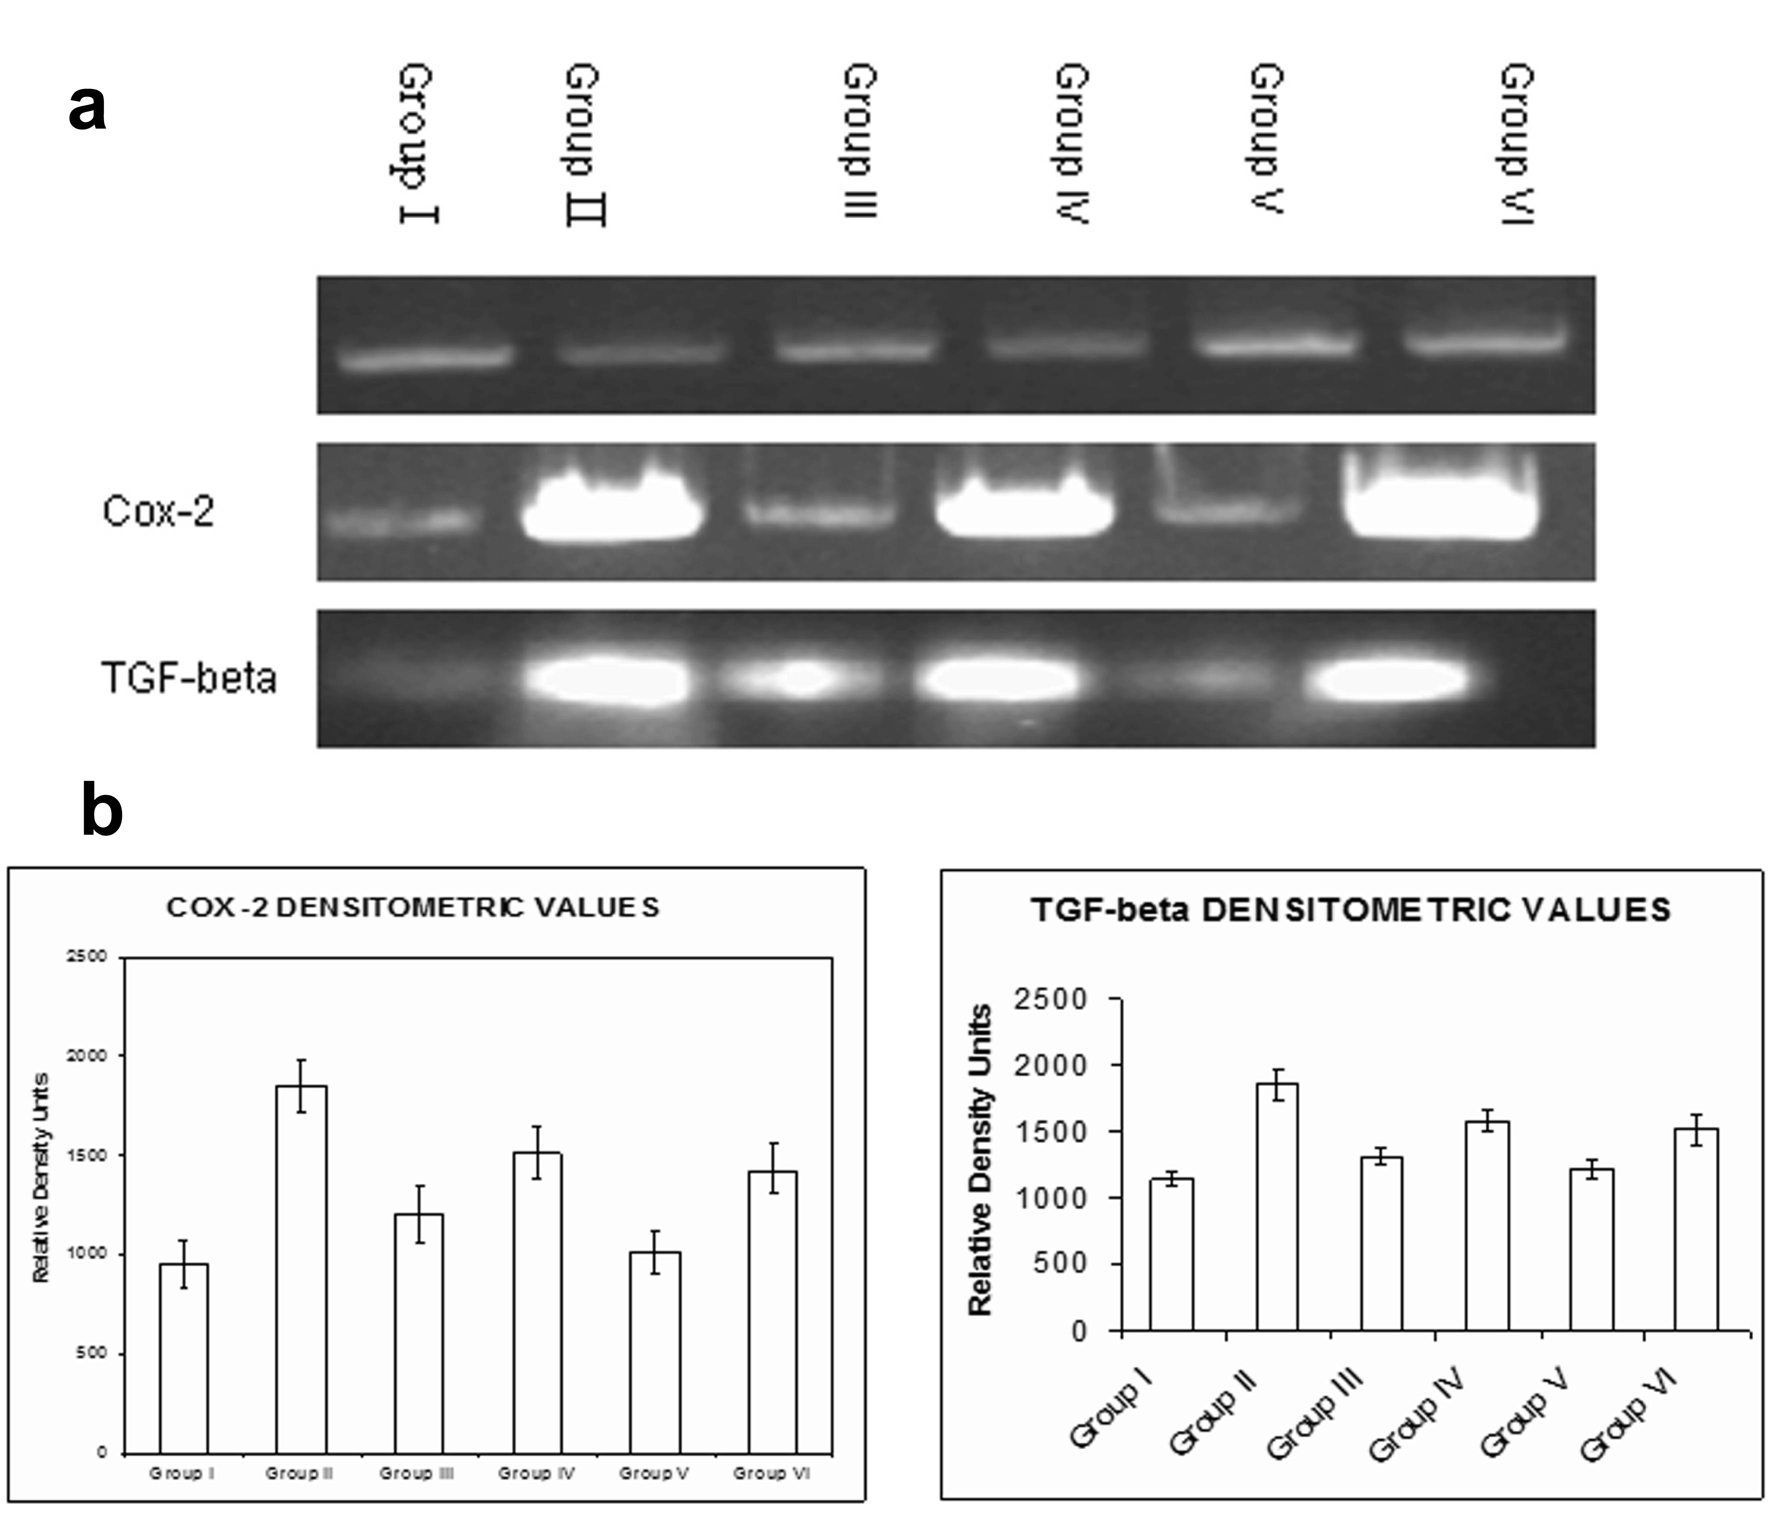
Figure 4. Semi-quantitative RT-PCR. a) An increase in the expression of both Cox-2 and TGF-b were seen with naproxen treatment in Group II, Group III and Group V animals. Administration of rhEGF decreased the expression of Cox-2 and TGF-b in Group IV and Group VI animals which were similar to the Group I (controls); b) The densitometry analysis of the RT-PCR data for Cox-2 and TGF-b. Data are the means ± SE for three independent experiments. (P < 0.05 compared to Group I, Group IV and Group VI by one way ANOVA).
Table
Table 1. Experimental Design
| Group | No. of Animals | Treatment | Duration | Sacrifice After |
|---|
| All the experimental conditions are as described in materials and methods. Six animals per group have been taken for this study. |
| I | 6 | Distilled water | 1 day | 1 day |
| II | 6 | Naproxen | 1 day | 1 day |
| III | 6 | Group II + without rhEGF | 7 days | 7 days |
| IV | 6 | Group II + with rhEGF | 7 days | 7 days |
| V | 6 | Group II + without rhEGF | 14 days | 14 days |
| VI | 6 | Group II + with rhEGF | 14 days | 14 days |