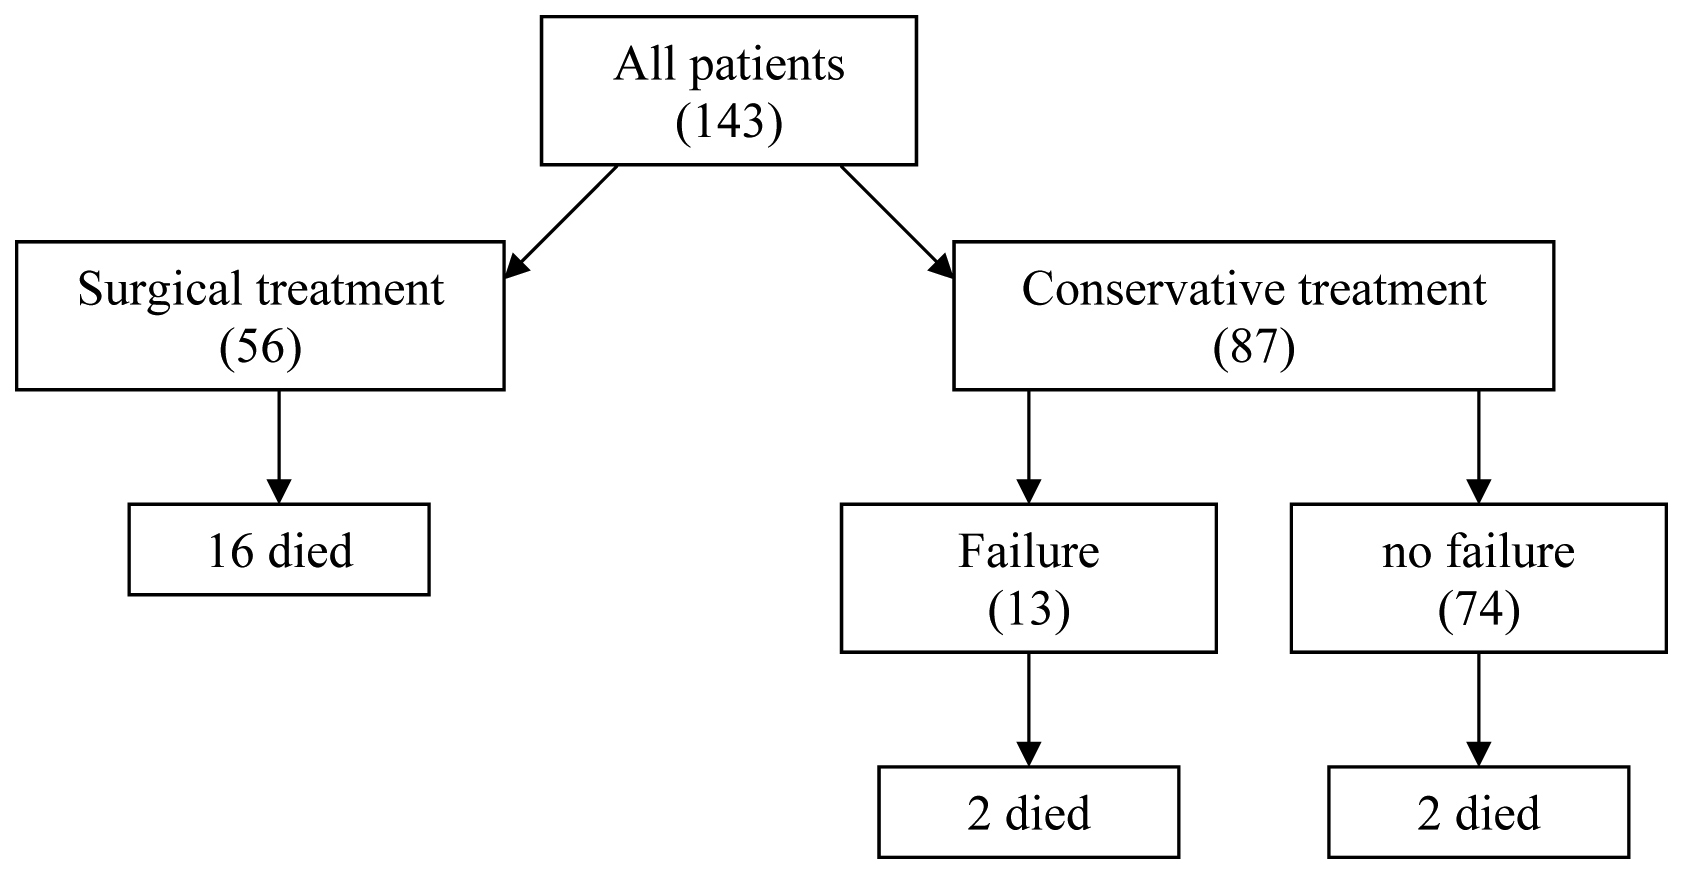
Figure 1. Management and mortality.
| Gastroenterology Research, ISSN 1918-2805 print, 1918-2813 online, Open Access |
| Article copyright, the authors; Journal compilation copyright, Gastroenterol Res and Elmer Press Inc |
| Journal website http://www.gastrores.org |
Original Article
Volume 3, Number 1, February 2010, pages 9-18
Treatment of Liver Trauma: Operative or Conservative Management
Figure
Tables
| Grade | Operative | Conservative | Failure | Total Mortality | ||
|---|---|---|---|---|---|---|
| N (%) | Mortality* | N (%) | Mortality* | N (%)† | ||
| *Percentage of mortality by initial treatment group and grade of injury | ||||||
| †Percentage of mortality by grade of injury. | ||||||
| **Number total of patients by group (operative, conservative and failure) | ||||||
| #one patient in each group (grade II and V) died in conservative treatment failure | ||||||
| I (n = 23) | 5 (21.7) | - | 18 (78.3) | - | - | - |
| II (n = 34) | 12 (35.3) | 3 (25) | 22 (64.7) | 2 (9.1) | 1 (4.5)# | 6 (14.7) |
| III (n = 56) | 22 (39.3) | 3 (13.6) | 34 (60.7) | - | 6 (17.6) | 3 (5.3) |
| IV (n = 19) | 8 (42.1) | 4 (50) | 11 (57.9) | 1 (9.1) | 4 (36.4) | 5 (26.3) |
| V (n = 11) | 9 (81.8) | 6 (66.6) | 2 (18.2) | 1 (50) | 2 (100)# | 8 (63.6) |
| Total: | 56** (39.2) | 16 (28.5) | 87** (60.8) | 4 (4.5) | 13** | 22 (15.3) |
| Operative | Conservative† | Total | Failure | |
|---|---|---|---|---|
| N=56 (%) | N=87 (%) | N=143 (%) | N=13 (%) | |
| *12 patients died during the first 48 hours. | ||||
| †On data analysis of the conservative group, the group of failure of conservative treatment was included. | ||||
| Morbidity | ||||
| YES | 20 (35.7) | 10 (11.5) | 30 (20.9) | 5 (38.5) |
| NO | 36 (64.3) | 77 (88.5) | 113 (79.1) | 8 (61.5) |
| Mortality | ||||
| YES | 16 (28.6)* | 4 (4.5) | 20 (13.9)* | 2 (15.4) |
| NO | 40 (71.4) | 83 (95.5) | 123 (86.1) | 11 (84.6) |
| Stay | 20.4 ± 22.3 | 15.2 ± 12.9 | 17.3 ± 17.1 | 16.1 ± 9.5 |
| Univariante Analysis | ||||||||
|---|---|---|---|---|---|---|---|---|
| *Values expressed as mean ± standard deviation. Abbreviations: ISS: injury severity score; RBC: red blood cell; FFP: fresh frozen plasma; PLT: Platelet, OR: odds ratio; CI: confidence interval. | ||||||||
| Variable | Final conservative management (n =74) | Final surgical treatment (n = 69) | P | |||||
| Initial injury grade | < 0.0001 | |||||||
| No injury | 1 | 32 | ||||||
| I | 17 | 4 | ||||||
| II | 22 | 5 | ||||||
| III | 27 | 20 | ||||||
| IV | 7 | 6 | ||||||
| V | 0 | 2 | ||||||
| Final injury grade | < 0.0001 | |||||||
| I | 18 | 5 | ||||||
| II | 21 | 13 | ||||||
| III | 28 | 28 | ||||||
| IV | 7 | 12 | ||||||
| V | 0 | 11 | ||||||
| Morbidity | < 0.0001 | |||||||
| Yes | 5 | 25 | ||||||
| No | 69 | 44 | ||||||
| Mortality | < 0.0001 | |||||||
| Yes | 2 | 18 | ||||||
| No | 72 | 51 | ||||||
| Hepatic Mortality | < 0.0001 | |||||||
| Yes | 1 | 13 | ||||||
| No | 73 | 56 | ||||||
| ISS * | 23.1 ± 15 | 30.1 ± 13.1 | < 0.0001 | |||||
| RBC * | 5.2 ± 7.5 | 11.2 ± 10.6 | 0.002 | |||||
| FFP * | 0.4 ± 1.6 | 2.6 ± 3.1 | < 0.0001 | |||||
| PLT * | 0.02 ± 0.1 | 0.5 ± 1.1 | < 0.0001 | |||||
| Multivariante Analysis (Multiple Logistic Regression Model) | ||||||||
| *Values expressed as mean ± standard deviation. Abbreviations: ISS: injury severity score; RBC: red blood cell; FFP: fresh frozen plasma; PLT: Platelet, OR: odds ratio; CI: confidence interval. | ||||||||
| Variable | p | OR | 95% CI | |||||
| Inicial grade injury | < 0.0001 | 3.8 | 2.05 | 7.08 | ||||
| Final grade injury | < 0.0001 | 0.2 | 0.08 | 0.4 | ||||
| *Values expressed as mean ± standard desviation | ||||||||
| Abbreviations: RBC: red blood cell; FFP: fresh frozen plasma; PLT: Platelet, OR: odds ratio; CI: confidence interval | ||||||||
| Univariante Analysis | ||||||||
| Variable | Grade I-II-III | Grade IV-V | P | |||||
| Hemodynamic instability | 0.008 | |||||||
| Yes | 23 | 19 | ||||||
| No | 23 | 4 | ||||||
| Vascular injury | 0.001 | |||||||
| Yes | 0 | 7 | ||||||
| No | 46 | 16 | ||||||
| Surgical technique | < 0.0001 | |||||||
| Exploratory laparotomy | 13 | 1 | ||||||
| Packing | 0 | 8 | ||||||
| Vascular suture | 20 | 5 | ||||||
| Electrocoagulation | 6 | 0 | ||||||
| Hepatic resection | 6 | 9 | ||||||
| Pringle | < 0.0001 | |||||||
| Yes | 4 | 15 | ||||||
| No | 42 | 8 | ||||||
| Mortality | 0.005 | |||||||
| Yes | 7 | 11 | ||||||
| No | 39 | 12 | ||||||
| Hepatic mortality | < 0.0001 | |||||||
| Yes | 3 | 10 | ||||||
| No | 43 | 13 | ||||||
| Hemoperitoneum* | 1377 ± 897 | 2939 ± 1351 | < 0.0001 | |||||
| Lesion size * | 5.1 ± 2.2 | 9 ± 2.8 | < 0.0001 | |||||
| RBC * | 6.2 ± 6.5 | 18.7 ± 12.3 | < 0.0001 | |||||
| FFP * | .1.1 ± 2.3 | 3.03 ± 3 | < 0.0001 | |||||
| PLT * | 0.07 ± 0.3 | 1.1 ± 1.9 | < 0.0001 | |||||
| Hospital Stay | 18.9 ± 18.1 | 11.4 ± 10.7 | 0.003 | |||||
| Multivariante Analysis (Multiple Logistic Regression Model) | ||||||||
|---|---|---|---|---|---|---|---|---|
| *Values expressed as mean ± standard desviation | ||||||||
| Abbreviations: RBC: red blood cell; FFP: fresh frozen plasma; PLT: Platelet, OR: odds ratio; CI: confidence interval | ||||||||
| Variable | p | OR | 95 % CI | |||||
| Hemoperitoneum | 0.02 | 1 | 1 | 1 | ||||
| Lesion size | 0.013 | 2.8 | 1.2 | 6.4 | ||||
| Variable | 1992-1999 N = 88 (%) | 2000-2008 N = 55 (%) | P |
|---|---|---|---|
| *Values expressed as mean ± standard desviation | |||
| Abbreviations: ISS: injury severity score; DPL: diagnostic peritoneal lavage; RBC: red blood cell; FFP: fresh frozen plasma; PLT: Platelet | |||
| Age (yrs)* | 30.8 ± 13 | 33.9 ± 17.1 | 0.441 |
| Male sex | 68 (77.3) | 46 (83.6) | 0.242 |
| Hospital stay* | 15.1 ± 13.4 | 20.8 ± 21.3 | 0.071 |
| ISS* | 25.8 ± 12.2 | 25.8 ± 11.8 | 0.896 |
| Etiology | 0.038 | ||
| Traffic accidents | 60 (68.2) | 45 (81.8) | |
| Stab wounds | 14 (15.9) | 1 (1.8) | |
| Falls | 10 (11.4) | 6 (10.9) | |
| Firearms | 3 (3.4) | 0 (0) | |
| Others | 1 (1.1) | 3 (5.5) | |
| Diagnostic technique | < 0.0001 | ||
| No | 8 (9.1) | 0 (0) | |
| Ultrasound | 72 (81.8) | 16 (29.1) | |
| TC | 4 (4.55) | 39 (70.9) | |
| DPL* | 4 (4.55) | 0 (0) | |
| Injury grade | 0.022 | ||
| I | 8 (9.1) | 15 (27.3) | |
| II | 20 (22.7) | 14 (25.5) | |
| III | 40 (45.5) | 16 (29.1) | |
| IV | 11 (12.5) | 8 (14.5) | |
| V | 9 (10.2) | 2 (3.6) | |
| Abdominal injuries | 0.092 | ||
| Yes | 32 (36.4) | 27 (49.1) | |
| No | 56 (63.6) | 28 (50.9) | |
| Extrabdominal injuries | 0.041 | ||
| Yes | 61 (69.3) | 9 (16.4) | |
| No | 27 (30.7) | 46 (83.6) | |
| Hemodynamic inestability | 31 (35.2) | 15 (27.3) | 0.211 |
| Treatment | 0.077 | ||
| Nonoperative management | 49 (55.7) | 38 (69.1) | |
| Surgery | 39 (44.3) | 17 (30.9) | |
| Surgical technique | 0.087 | ||
| Exploratory laparotomy | 9 (10.2) | 5 (9.1) | |
| Packing | 3 (3.4) | 5 (9.1) | |
| Vascular suture | 21 (23.8) | 4 (7.3) | |
| Electrocoagulation | 5 (5.7) | 1 (1.8) | |
| Hepatic resection | 6 (6.8) | 9 (16.4) | |
| Failure of conservative treatment | 8 (16.3) | 5 (13.1) | 0.482 |
| Morbidity | 0.015 | ||
| Yes | 24 (27.3) | 6 (10.9) | |
| No | 64 (72.7) | 49 (89.1) | |
| Mortality | 0.532 | ||
| Yes | 12 (13.6) | 8 (14.5) | |
| No | 76 (86.4) | 47 (85.5) | |
| Hepatic Mortality | 0.534 | ||
| Yes | 9 (10.2) | 5 (9.1) | |
| No | 79 (89.8) | 50 (90.9) | |
| RBC * | 7.6 ± 8.2 | 13.7 ± 12.3 | 0.033 |
| FFP * | 1.3 ± 2.6 | 2.4 ± 2.6 | 0.003 |
| PLT * | 0.3 ± 1.9 | 0.8 ± 0.9 | < 0.0001 |