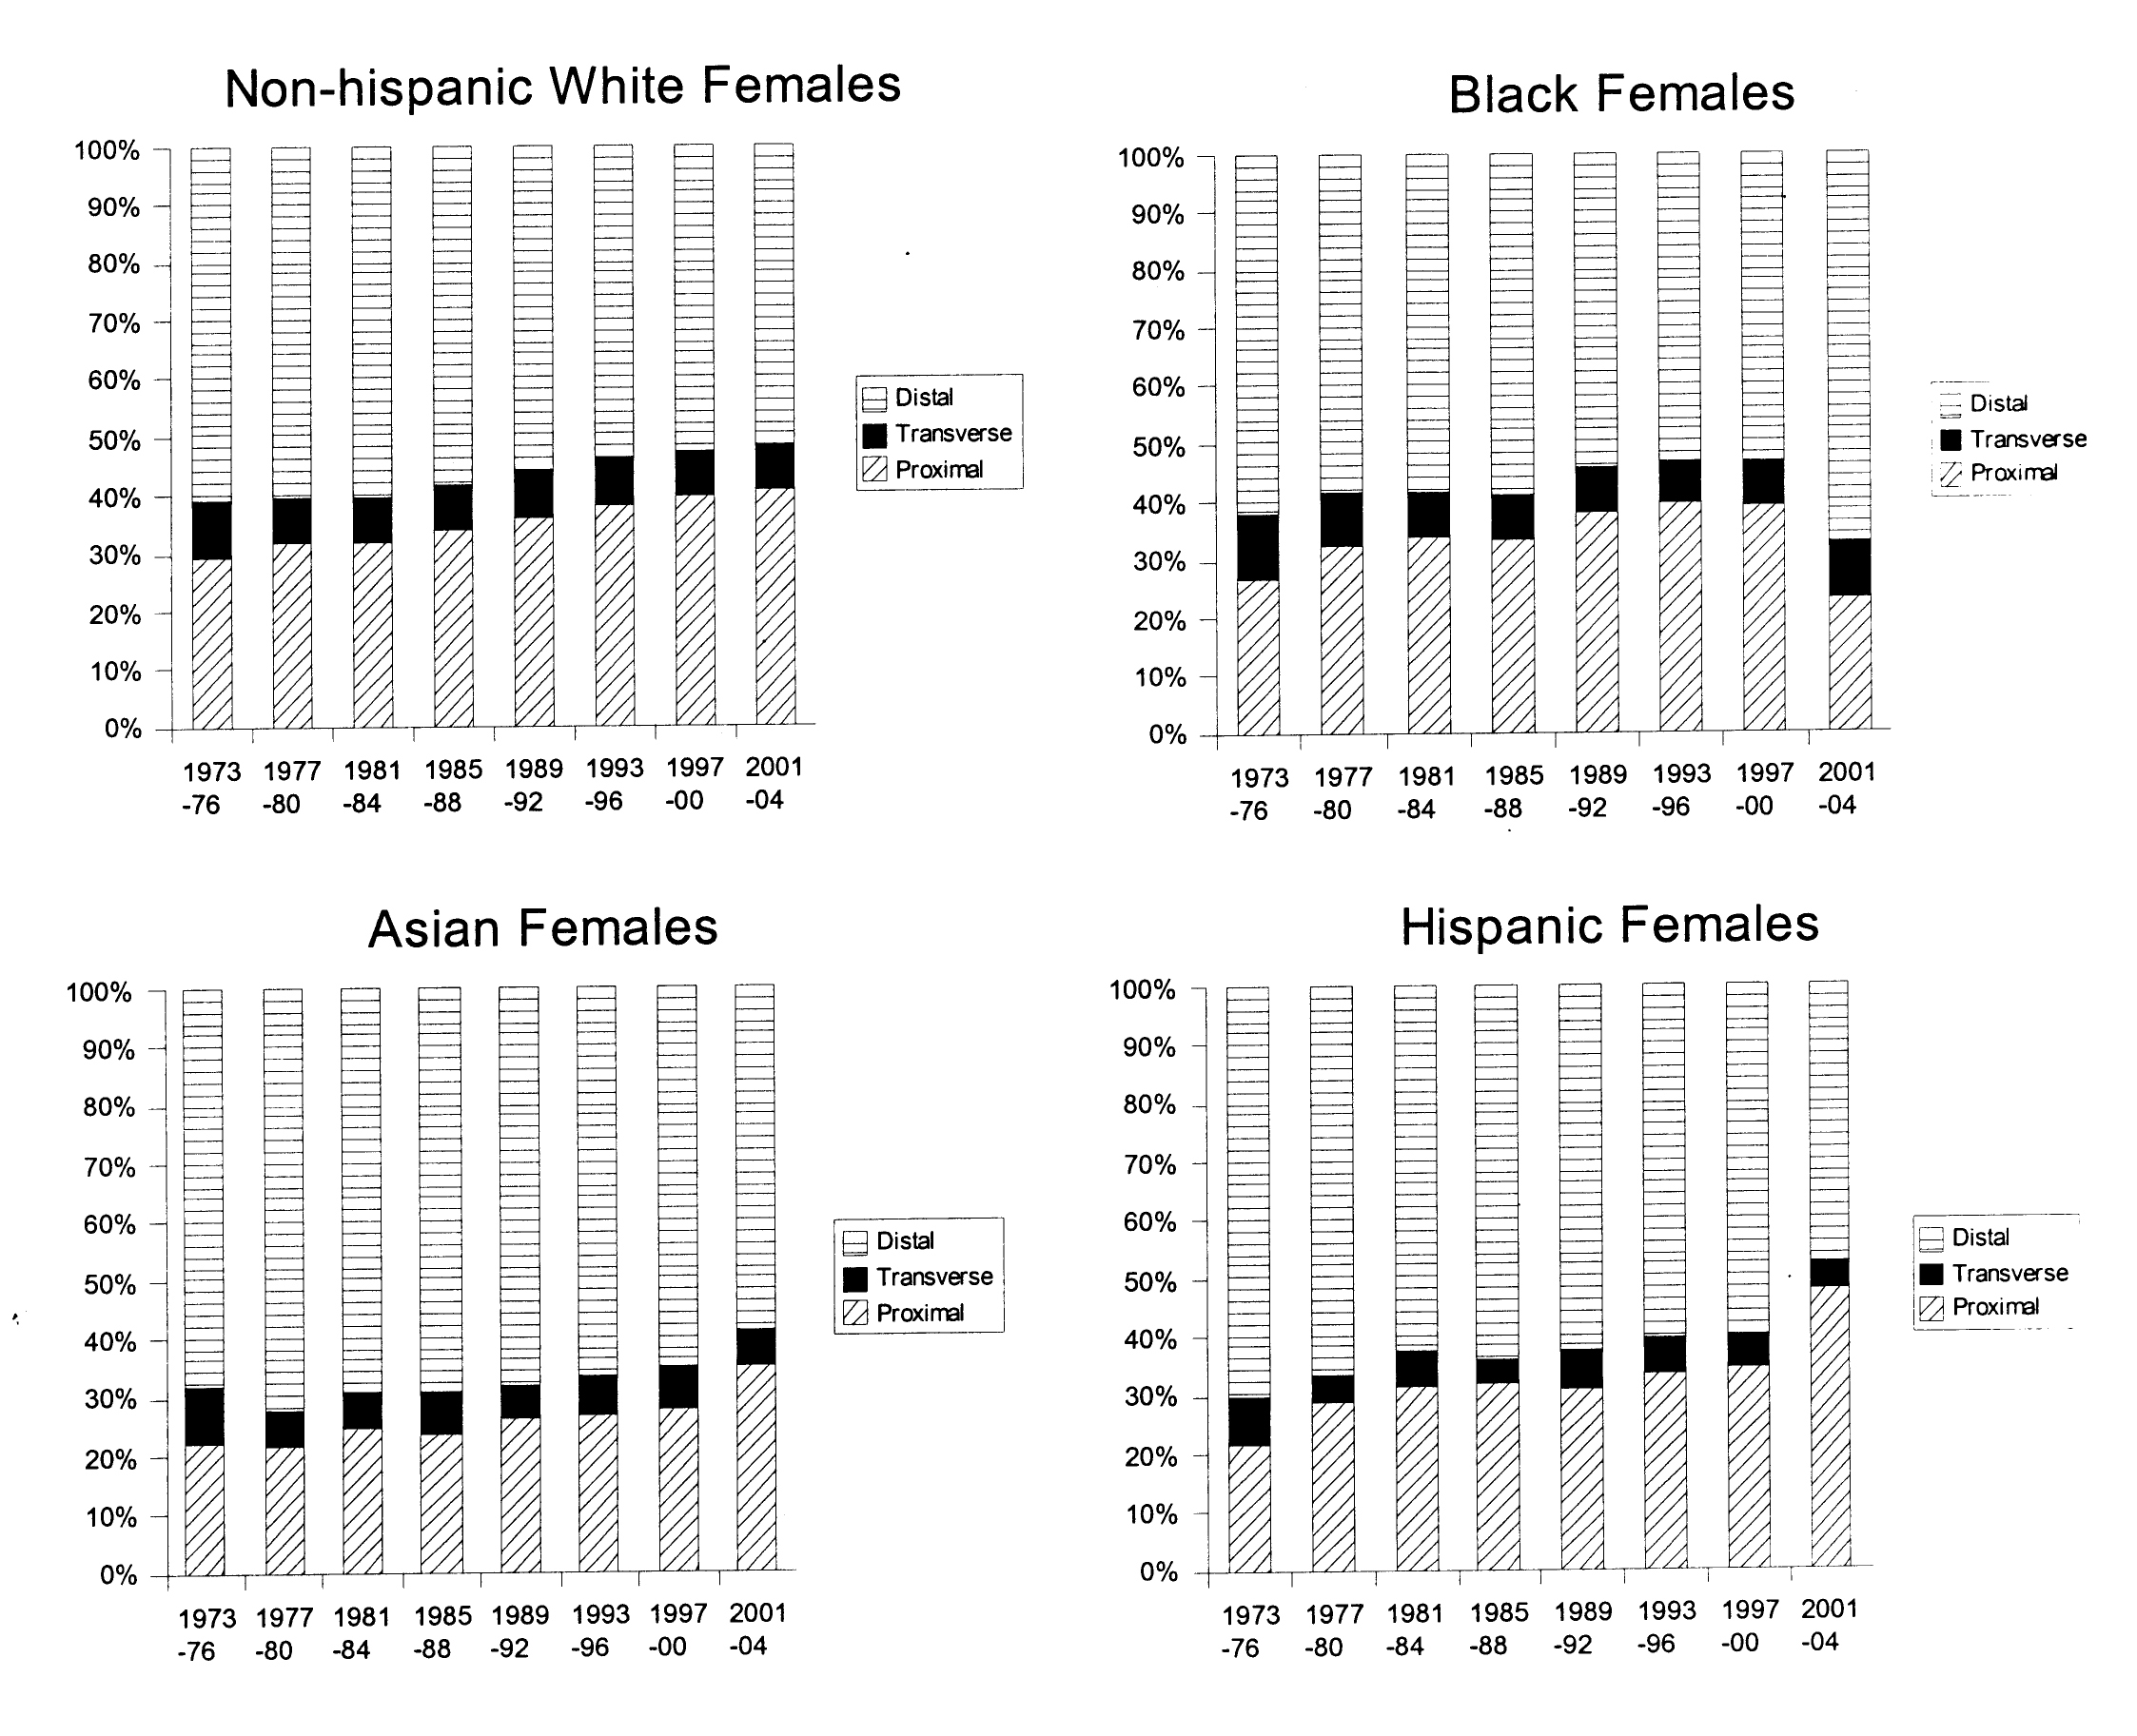
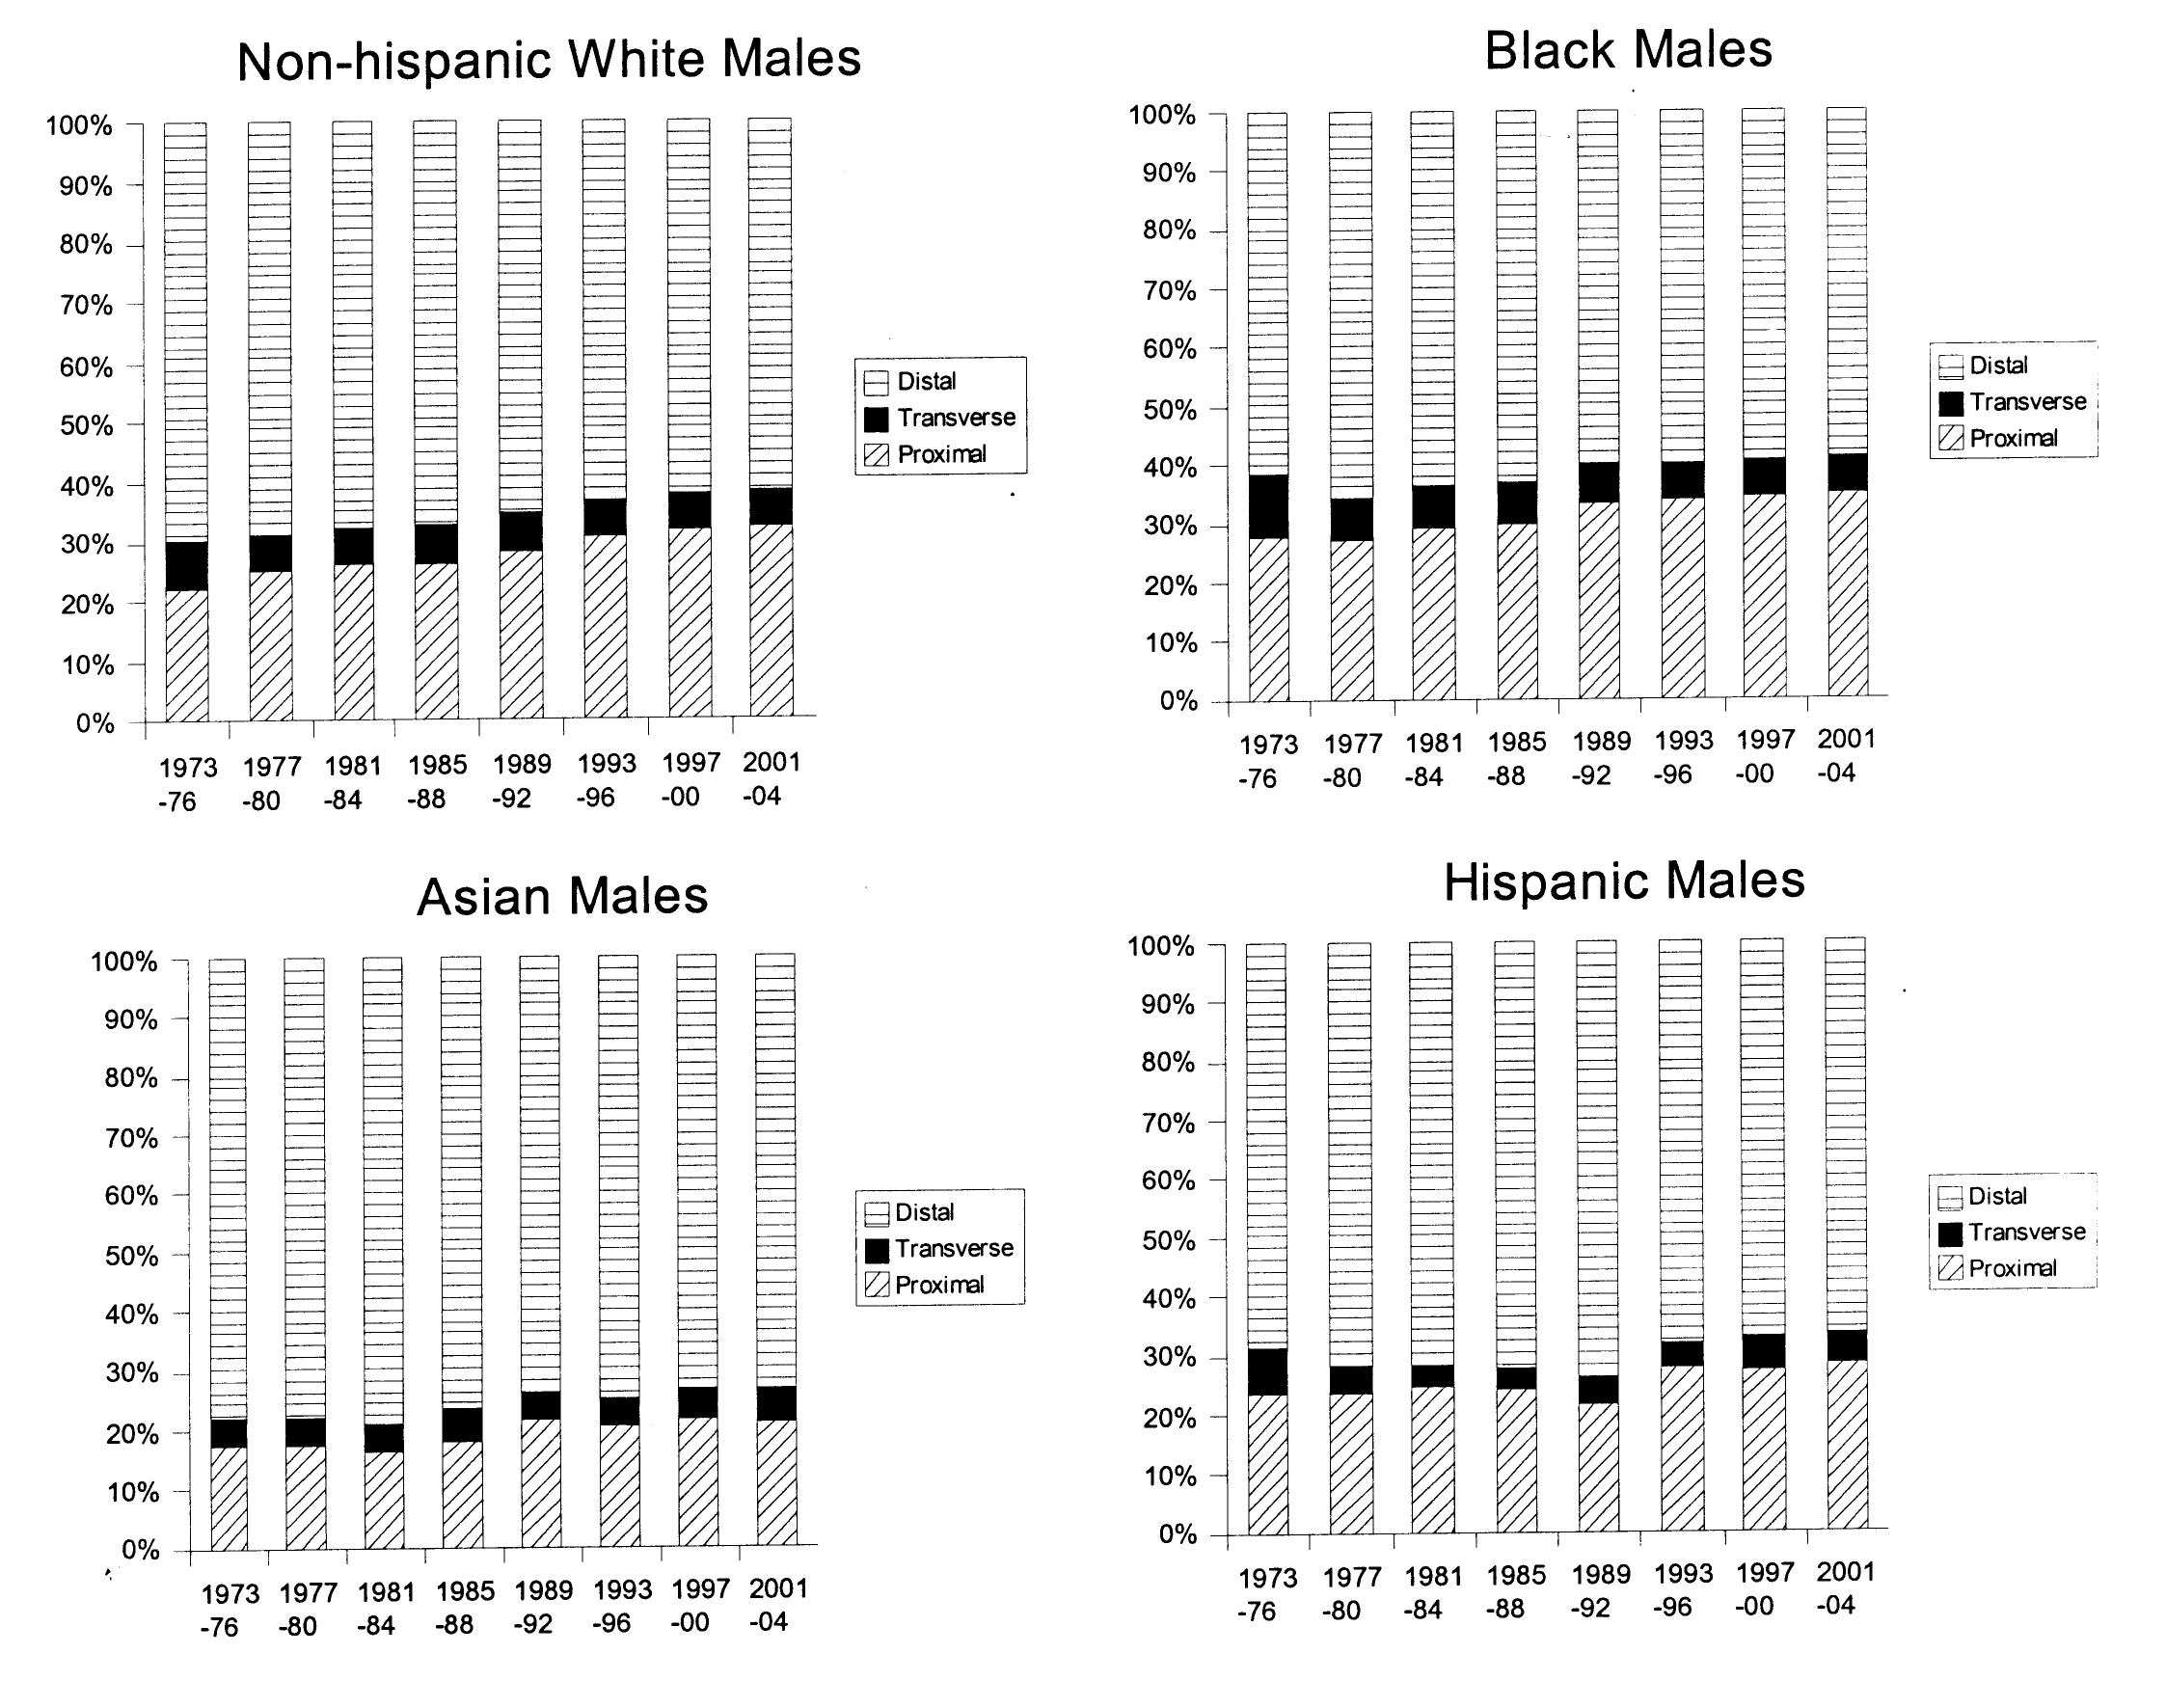
Figure 1. Colon cancer distribution by anatomical site and year, 1973-2004. Males, stratified by race/ethnicity.
| Gastroenterology Research, ISSN 1918-2805 print, 1918-2813 online, Open Access |
| Article copyright, the authors; Journal compilation copyright, Gastroenterol Res and Elmer Press Inc |
| Journal website http://www.gastrores.org |
Original Article
Volume 2, Number 5, October 2009, pages 268-276
Marked Variations in Colon Cancer Epidemiology: Sex-specific and Race/Ethnicity-specific Disparities
Figures
Tables
| Distribution by Site | |||||||||||||
|---|---|---|---|---|---|---|---|---|---|---|---|---|---|
| Proximal | Percent (%) | Transverse | Percent (%) | Distal | Percent (%) | ||||||||
| The percentages are calculated horizontally across each row and represent the proportion of cancers within each race/ethnic group. | |||||||||||||
| Non-hispanic white | 136139 | 32.8% | 29509 | 7.1% | 249045 | 60.1% | |||||||
| Black | 15459 | 35.3% | 3228 | 7.4% | 25150 | 57.4% | |||||||
| Asians | 7099 | 23.2% | 1802 | 5.9% | 21692 | 70.9% | |||||||
| Hispanic | 7653 | 29.9% | 1384 | 5.4% | 16541 | 64.7% | |||||||
| Distribution by Stage | |||||||||||||
| Localized | Percent (%) | Regional | Percent (%) | Advanced | Percent (%) | ||||||||
| The percentages are calculated horizontally across each row and represent the proportion of cancers within each race/ethnic group. | |||||||||||||
| Non-hispanic white | 166064 | 41.4% | 155428 | 38.7% | 79993 | 19.9% | |||||||
| Black | 15966 | 37.8% | 15546 | 36.8% | 10732 | 25.4% | |||||||
| Asians | 12315 | 41.4% | 11947 | 40.1% | 5509 | 18.5% | |||||||
| Hispanic | 9811 | 39.3% | 9774 | 39.2% | 5358 | 21.5% | |||||||
| 1992-94 | 1995-97 | 1998-2000 | 2001-04 | |||||
|---|---|---|---|---|---|---|---|---|
| Rate (count) | 95% CI | Rate (count) | 95% CI | Rate (count) | 95% CI | Rate (count) | 95% CI | |
| Annual incidence rates are age-standardized to U.S. population of 2000 and are stratified by sex, year, anatomic site, and race/ethnicity. Proximal refers to cancers involving cecum, appendix, ascending colon, and hepatic flexure. Distal refers to cancers involving splenic flexure, descending colon, sigmoid colon, rectosigmoid junction, and rectum. “Total cancers” include proximal, transverse, and distal sites of the colon. | ||||||||
| Males | ||||||||
| Total Cancers | ||||||||
| Non Hispanic white | 68.7 (20211) | (67.7-69.6) | 65.9 (2098) | (65.0-66.8) | 65.4 (20747) | (64.5-66.3) | 58.6 (26075) | (57.9-59.3) |
| Black | 75.9 (2232) | (72.6-79.3) | 73.2 (2312) | (70.0-76.4) | 75.1 (2509) | (72.0-78.2) | 72.8 (3589) | (70.3-75.3) |
| Asians | 59.3 (1959) | (56.6-62.1) | 58.6 (2252) | (56.2-61.2) | 56.4 (2493) | (54.2-58.7) | 53.0 (3688) | (51.3-54.8) |
| Hispanic | 48.7 (1456) | (45.8-51.3) | 50.0 (1710) | (47.4-52.6) | 51.0 (1972) | (48.5-53.5) | 46.3 (2976) | (44.5-48.1) |
| Proximal Cancers | ||||||||
| Non Hispanic white | 20.1 (5872) | (19.6-20.7) | 20.4 (6080) | (19.8-20.9) | 20.3 (6312) | (19.8-20.8) | 19.0 (8295) | (18.6-19.4) |
| Black | 25.1 (722) | (23.2-27.1) | 23.7 (734) | (21.9-25.6) | 26.8 (856) | (24.9-28.7) | 25.2 (1206) | (23.6-26.8) |
| Asians | 12.2 (389) | (10.9-13.5) | 12.4 (467) | (11.3-13.6) | 12.3 (521) | (11.2-13.4) | 11.7 (767) | (10.9-12.6) |
| Hispanic | 13.8 (381) | (12.3-15.4) | 13.9 (460) | (12.5-15.3) | 14.4 (514) | (13.1-15.9) | 13.0 (791) | (12.1-14.0) |
| Distal Cancers | ||||||||
| Non Hispanic white | 41.7 (12495) | (41.0-42.5) | 39.1 (12111) | (38.4-39.8) | 38.7 (12446) | (38.0-39.3) | 33.8 (15262) | (33.3-34.4) |
| Black | 41.8 (1264) | (39.4-44.3) | 41.2 (1337) | (38.9-43.6) | 39.1 (1368) | (37.0-41.4) | 39.1 (1984) | (37.3-40.9) |
| Asians | 42.5 (1422) | (40.3-44.9) | 41.5 (1615) | (39.5-43.6) | 40.2 (1801) | (38.3-42.1) | 36.7 (2608) | (35.3-38.2) |
| Hispanic | 30.8 (961) | (28.7-33.0) | 31.9 (1118) | (29.8-34.0) | 32.0 (1280) | (30.1-33.9) | 29.1 (1927) | (27.8-30.6) |
| Females | ||||||||
| Total Cancers | ||||||||
| Non Hispanic white | 48.0 (19970) | (47.3-48.7) | 47.4 (20167) | (46.7-48.1) | 48.0 (20810) | (47.4-48.7) | 43.9 (25899) | (43.4-44.5) |
| Black | 57.2 (2460) | (55.0-59.6) | 55.9 (2553) | (53.8-58.2) | 57.7 (2833) | (55.6-59.8) | 54.2 (3879) | (52.5-56.0) |
| Asians | 40.9 (1626) | (38.9-43.0) | 38.1 (1801) | (36.3-39.9) | 39.2 (2193) | (37.5-40.9) | 37.8 (3378) | (36.5-39.1) |
| Hispanic | 33.7 (1358) | (31.9-35.6) | 32.4 (1464) | (30.7-34.1) | 34.0 (1739) | (32.4-35.7) | 31.2 (2582) | (30.0-32.5) |
| Proximal Cancers | ||||||||
| Non Hispanic white | 17.0 (7201) | (16.6-17.4) | 17.0 (7429) | (16.6-17.4) | 18.1 (8019) | (17.7-18.5) | 17.0 (10267) | (16.7-17.4) |
| Black | 21.1 (900) | (19.7-22.5) | 21.7 (986) | (20.4-23.2) | 22.3 (1077) | (21.0-23.7) | 21.9 (1544) | (20.5-23.1) |
| Asians | 11.2 (424) | (10.2-12.4) | 9.6 (440) | (8.7-10.5) | 11.1 (605) | (10.2-12.0) | 11.4 (999) | (10.7-12.2) |
| Hispanic | 10.9 (423) | (9.9-12.0) | 11.0 (474) | (10.0-12.1) | 11.9 (586) | (10.9-12.9) | 11.5 (906) | (10.7-12.3) |
| Distal Cancers | ||||||||
| Non Hispanic white | 25.6 (10439) | (25.1-26.1) | 24.8 (10301) | (24.3-25.3) | 24.7 (10413) | (24.3-25.2) | 22.0 (12599) | (21.6-22.4) |
| Black | 29.5 (1279) | (27.9-31.2) | 27.7 (1271) | (26.2-29.3) | 28.3 (1416) | (26.9-29.9) | 25.8 (1878) | (24.6-27.0) |
| Asians | 25.9 (1063) | (24.3-27.3) | 24.6 (1189) | (23.2-26.1) | 24.1 (1375) | (22.8-25.4) | 23.3 (2110) | (22.3-24.3) |
| Hispanic | 19.7 (814) | (18.3-21.1.) | 17.8 (842) | (16.6-19.1) | 18.7 (990) | (17.6-20.0) | 16.6 (1432) | (15.8-17.5) |
| 1992-94 | 1995-97 | 1998-2000 | 2001-04 | |||||
|---|---|---|---|---|---|---|---|---|
| Rate (count) | 95% CI | Rate (count) | 95% CI | Rate (count) | 95% CI | Rate (count) | 95% CI | |
| Annual incidence rates are age-standardized to U.S. population of 2000 and are stratified by sex, year, cancer stage, and race/ethnicity. Localized stages refer to cancers confined to the colon without transmural invasion to or beyond the serosa. Regional stages involve spread to regional lymph nodes or direct extension to adjacent tissue. Advanced cancers include metastatic disease and cancers with distant lymph node involvement. | ||||||||
| Males | ||||||||
| Localized Cancers | ||||||||
| Non-hispanic white | 27.1 (7992) | (26.5-27.7) | 25.8 (7888) | (25.2-26.4) | 26.9 (8585) | (26.4-27.5) | 25.1 (11184) | (24.7-25.6) |
| Black | 26.8 (776) | (24.9-28.9) | 26.4 (843) | (24.5-28.3) | 26.8 (890) | (25.0-28.7) | 26.3 (1292) | (24.8-27.9) |
| Asians | 23.9 (787) | (22.2-25.7) | 23.9 (922) | (22.3-25.5) | 22.9 (1018) | (21.5-24.4) | 22.0 (1526) | (20.9-23.1) |
| Hispanic | 16.9 (516) | (15.3-18.5) | 19.5 (659) | (17.9-21.2) | 18.8 (725) | (17.3-20.4) | 17.6 (1116) | (16.5-18.7) |
| Regional Cancers | ||||||||
| Non-hispanic white | 24.3 (7229) | (23.8-24.9) | 23.5 (7198) | (22.9-24.0) | 23.6 (7512) | (23.1-24.2) | 20.5 (9114) | (20.0-20.9) |
| Black | 25.1 (770) | (23.3-27.1) | 23.4 (747) | (21.7-25.3) | 25.2 (855) | (23.5-27.1) | 24.0 (1202) | (22.6-25.5) |
| Asians | 21.7 (728) | (20.1-23.4) | 21.6 (833) | (20.1-23.1) | 21.5 (956) | (20.1-22.9) | 18.8 (1315) | (17.8-19.8) |
| Hispanic | 18.5 (546) | (16.8-20.2) | 17.7 (614) | (16.2-19.3) | 18.2 (730) | (16.8-19.7) | 17.1 (1105) | (16.0-18.2) |
| Advanced Cancers | ||||||||
| Non-hispanic white | 12.7 (3786) | (12.3-13.1) | 12.3 (3814) | (11.9-12.7) | 11.4 (3657) | (11.0-11.8) | 10.4 (4685) | (10.1-10.7) |
| Black | 16.7 (506) | (15.2-18.3) | 16.6 (528) | (15.1-18.1) | 17.5 (594) | (16.1-19.1) | 17.1 (873) | (15.9-18.3) |
| Asians | 10.1 (344) | (9.0-11.3) | 9.7 (377) | (8.7-10.7) | 9.2 (415) | (8.4-10.2) | 10.0 (706) | (9.3-10.8) |
| Hispanic | 10.1 (306) | (8.9-11.4) | 9.6 (349) | (8.5-10.8) | 10.1 (398) | (9.0-11.2) | 8.7 (598) | (7.9-9.5) |
| Females | ||||||||
| Localized Cancers | ||||||||
| Non-hispanic white | 17.9 (7440) | (17.5-18.3) | 17.9 (7576) | (17.5-18.5) | 19.2 (8269) | (18.8-19.6) | 18.3 (10700) | (17.9-18.6) |
| Black | 19.8 (849) | (18.5-21.2) | 20.0 (908) | (18.7-21.4) | 20.9 (633) | (19.6-22.2) | 19.2 (1366) | (18.1-20.2) |
| Asians | 14.7 (601) | (13.5-16.0) | 15.5 (734) | (14.3-16.6) | 14.9 (839) | (13.9-15.9) | 14.8 (1328) | (14.0-15.6) |
| Hispanic | 11.2 (455) | (10.2-12.3) | 11.3 (503) | (10.3-12.4) | 12.4 (1024) | (11.4-13.4) | 12.1 (993) | (11.3-12.8) |
| Regional Cancers | ||||||||
| Non-hispanic white | 18.1 (7495) | (17.7-18.6) | 17.7 (7524) | (17.3-18.2) | 18.1 (7780) | (17.6-18.5) | 15.6 (9180) | (15.3-16.0) |
| Black | 19.5 (842) | (18.2-20.9) | 19.4 (892) | (18.8-20.7) | 19.3 (948) | (18.1-20.6) | 18.9 (1347) | (17.9-19.9) |
| Asians | 16.5 (654) | (15.2-17.8) | 14.1 (672) | (13.1-15.3) | 15.8 (884) | (14.7-16.8) | 15.0 (1343) | (14.2-15.8) |
| Hispanic | 13.4 (546) | (12.3-14.6) | 12.3 (563) | (11.2-13.3) | 12.9 (663) | (11.9-13.9) | 10.8 (900) | (10.1-11.5) |
| Advanced Cancers | ||||||||
| Non-hispanic white | 8.9 (3646) | (8.6-9.1) | 8.8 (3672) | (8.5-9.0) | 8.1 (3448) | (7.8-8.4) | 7.8 (4538) | (7.6-8.0) |
| Black | 12.5 (552) | (11.4-13.6) | 11.9 (549) | (10.9-12.9) | 12.8 (639) | (11.8-13.8) | 12.4 (903) | (11.6-13.3) |
| Asians | 6.3 (257) | (5.5-7.1) | 5.9 (292) | (5.3-6.7) | 6.6 (376) | (6.0-7.3) | 6.5 (588) | (6.0-7.1) |
| Hispanic | 6.7 (272) | (5.9-7.6) | 6.8 (318) | (6.1-7.7) | 6.7 (353) | (6.0-7.4) | 6.2 (524) | (5.6-6.7) |
| Localized cancers | Advanced cancers | |||||
|---|---|---|---|---|---|---|
| Rate (count) | 95% CI | % of all cancers | Rate (count) | 95% CI | % of all cancers | |
| Annual incidence rates are age-standardized to U.S. population of 2000 and are stratified by sex, cancer stage, anatomic site, and race/ethnicity. Percentages are calculated horizontally across each row and represent the proportion of cancers within each race/ethnic group. The proportion of regional staged cancers are not presented in this table. | ||||||
| Males | ||||||
| Proximal cancers | ||||||
| Non-Hispanic white | 7.4 (9763) | (7.2-7.5) | 38.1% | 3.9 (5274) | (3.8-4.0) | 20.6% |
| Black | 8.6 (1167) | (8.1-9.1) | 34.5% | 6.0 (871) | (3.6-6.5) | 25.7% |
| Asians | 4.4 (773) | (4.1-4.7) | 37.1% | 2.5 (443) | (2.2-2.7) | 21.5% |
| Hispanic | 4.6 (717) | (4.3-4.9 | 34.7% | 2.7 (448) | (2.5-3.0) | 21.7% |
| Distal cancers | ||||||
| Non-Hispanic white | 17.0 (23515) | (16.8-17.2) | 47.1% | 6.2 (8610) | (6.0-6.3) | 17.2% |
| Black | 15.9 (2365) | (15.2-16.6) | 42.6% | 8.5 (1290) | (8.0-9.0) | 23.2% |
| Asians | 17.2 (3236) | (16.6-17.8) | 45.3% | 6.2 (1196) | (5.8-6.6) | 16.8% |
| Hispanic | 12.5 (2137) | (11.9-13.1) | 42.5% | 5.6 (1020) | (5.3-6.0) | 20.3% |
| Females | ||||||
| Proximal cancers | ||||||
| Non-Hispanic white | 6.3 (12128) | (6.2-6.4) | 38.2% | 3.3 (6119) | (3.2-3.4) | 19.3% |
| Black | 7.3 (1492) | (6.9-7.7) | 34.8% | 5.2 (1107) | (4.9-5.6) | 25.8% |
| Asians | 3.7 (835) | (3.5-4.0) | 35.1% | 2.0 (469) | (1.8-2.2) | 19.7% |
| Hispanic | 3.9 (810) | (3.6-4.2) | 35.1% | 2.4 (522) | (2.2-2.6) | 22.6% |
| Distal cancers | ||||||
| Non-Hispanic white | 10.7 (19281) | (10.5-10.8) | 46.5% | 3.9 (6953) | (3.8-4.0) | 16.8% |
| Black | 11.0 (2336) | (10.6-11.5) | 43.0% | 5.4 (1152) | (5.1-5.7) | 21.2% |
| Asians | 10.2 (2430) | (9.8-10.6) | 29.6% | 3.7 (889) | (3.5-3.9) | 16.2% |
| Hispanic | 7.2 (1623) | (6.8-7.5) | 42.0% | 3.1 (735) | (2.9-3.4) | 19.0% |