Figures
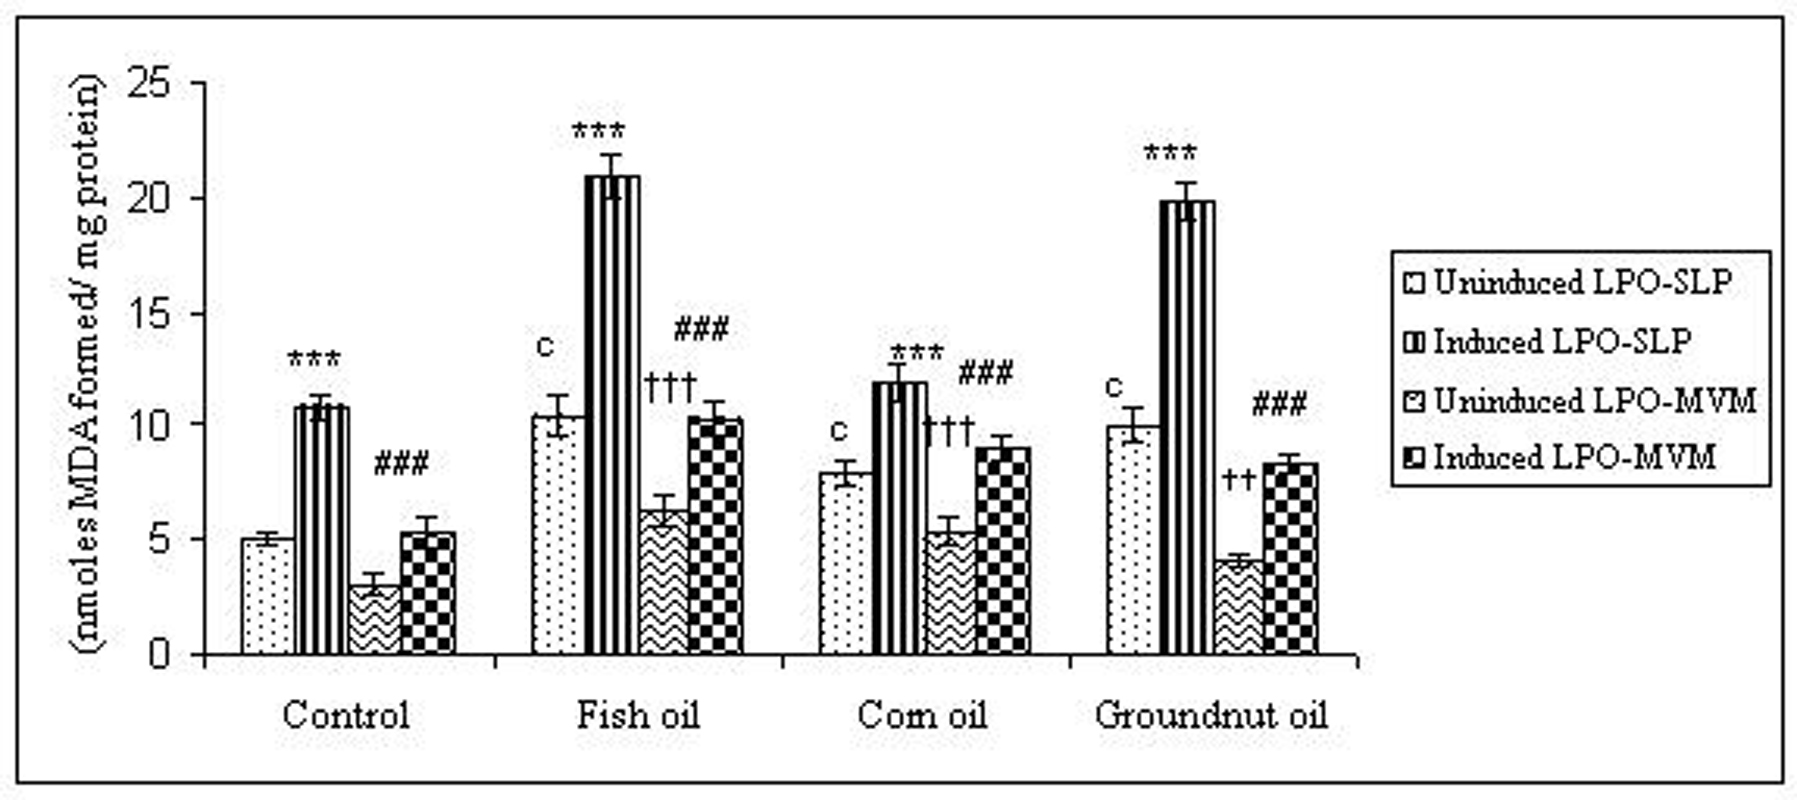
Figure 1. Lipid peroxidation levels induced under in vitro (Fe2+/ ascorbate system) in response to feeding different dietary fats in SLP and MVM. 300-400µg of membrane protein was used for each assay. Values are mean ± SD, n = 8. Uninduced LPO-SLP vs Induced LPO-SLP, * p < 0.05; **p < 0.01; p < 0.001. Uninduced LPO-MVM vs Induced LPO-MVM, a, p < 0.05; b, p < 0.01; c, p < 0.001. Control SLP vs Different dietary oils SLP MVM, # p < 0.05; ## p < 0.01; ### p < 0.001. Control MVM vs Different dietary oils, † p < 0.05; †† p < 0.01; ††† p < 0.001.
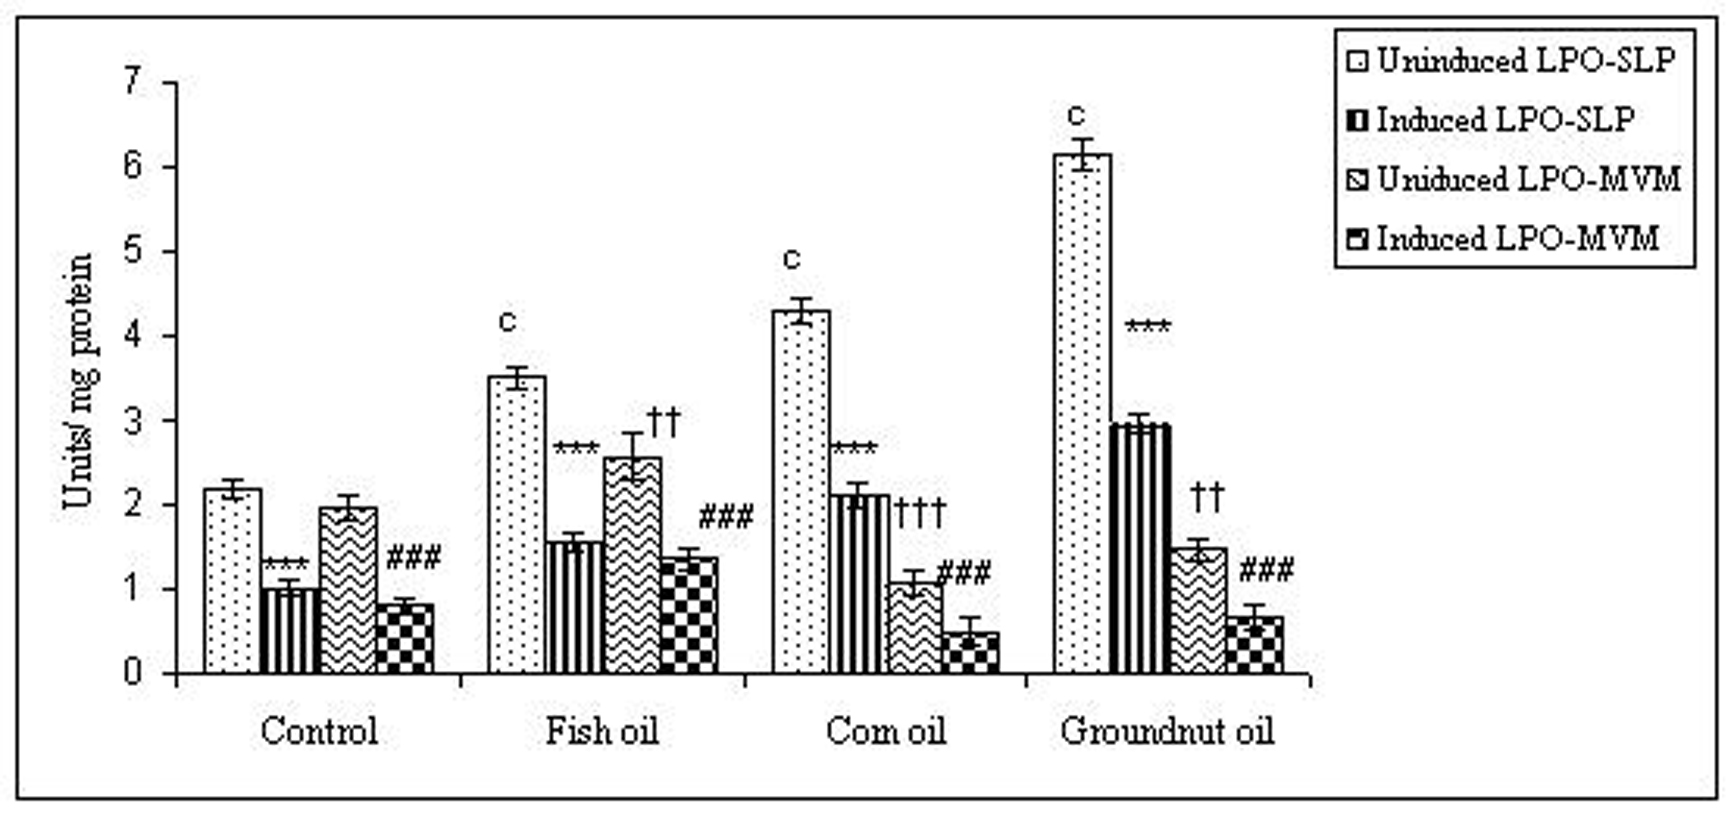
Figure 2. Effect of lipid peroxidation induction in vitro on IAP activity (µmole/min/mg protein) of SLP and MVM isolated from control and fat fed rats. Values are mean ± SD, n = 8. Uninduced LPO-SLP vs Induced LPO-SLP, *p < 0.05; **p < 0.01; ***p < 0.001. Uninduced LPO-MVM vs Induced LPO-MVM, a, p < 0.05; b, p < 0.01; c, p < 0.001. Control SLP vs Different dietary oils SLP, #p < 0.05; ##p < 0.01; ###p < 0.001. Control MVM vs Different dietary oils MVM, †p < 0.05; ††p < 0.01; †††p < 0.001.
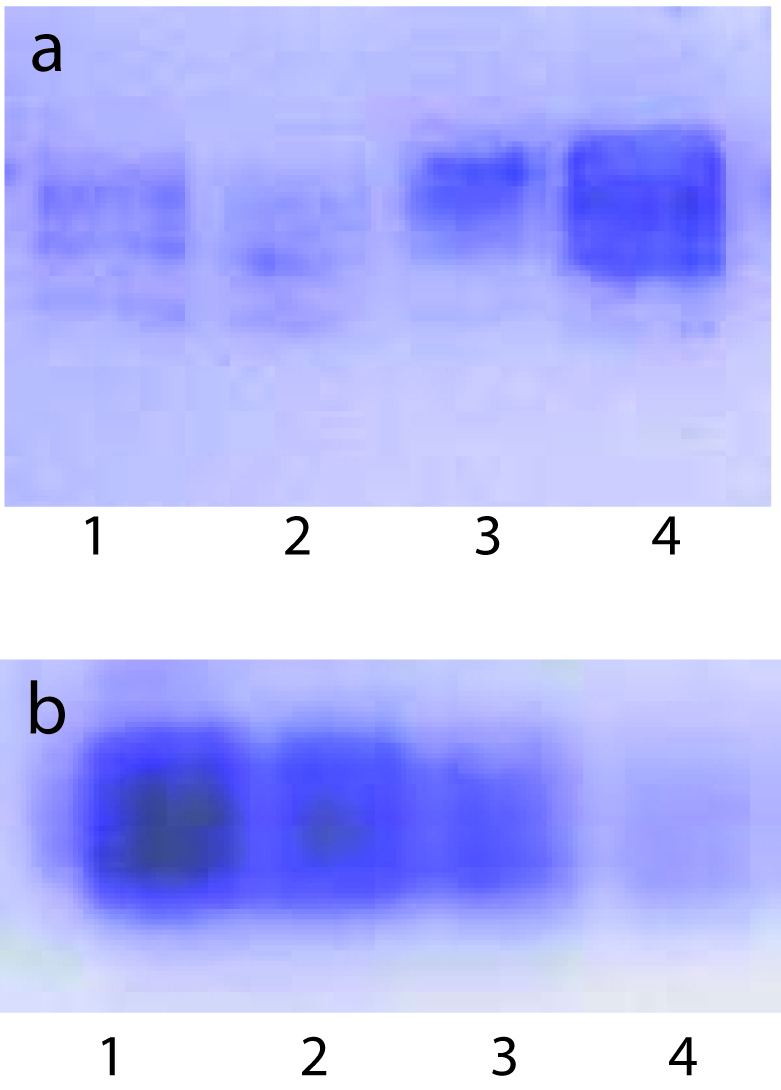
Figure 3. BCIP - staining of AP activity upon lipid peroxidation induced in vitro in SLPs isolated from control and oil fed animals under these conditions. Each lane contained 100 µg protein. Each lane contained 100 µg SLP protein. (a), 1, Induced Control; 2, Induced Fish Oil; 3, Uninduced Control; 4, Uninduced Fish Oil. (b), 1, Uninduced Groundnut Oil; 2, Induced Groundnut Oil; 3, Uninduced Corn Oil; 4, Induced Corn Oil.
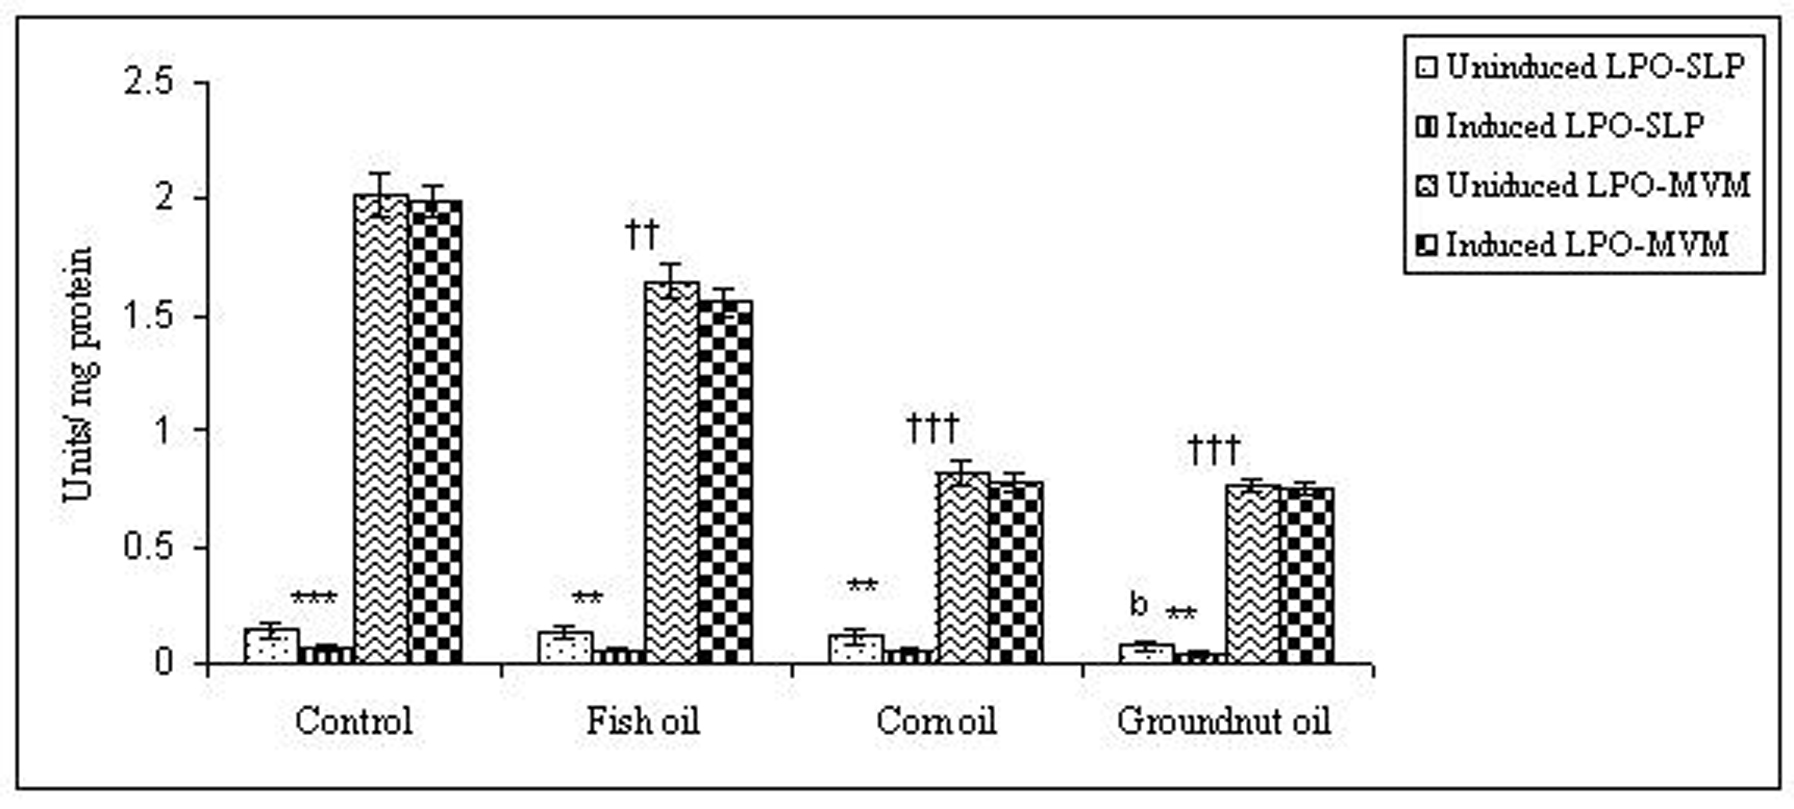
Figure 4. Effect of lipid peroxidation induction in vitro on sucrase activity (µmole/min/mg protein) of SLP and MVM isolated from control and fat fed rats. Values are mean ± SD, n = 8. Uninduced LPO-SLP vs Induced LPO-SLP, *p < 0.05; **p < 0.01; ***p < 0.001. Uninduced LPO-MVM vs Induced LPO-MVM, a, p < 0.05; b, p < 0.01; c, p < 0.001. Control SLP vs Different dietary oils SLP, #p < 0.05; ##p < 0.01; ###p < 0.001. Control MVM vs Different dietary oils MVM, †p < 0.05; ††p < 0.01; †††p < 0.001.
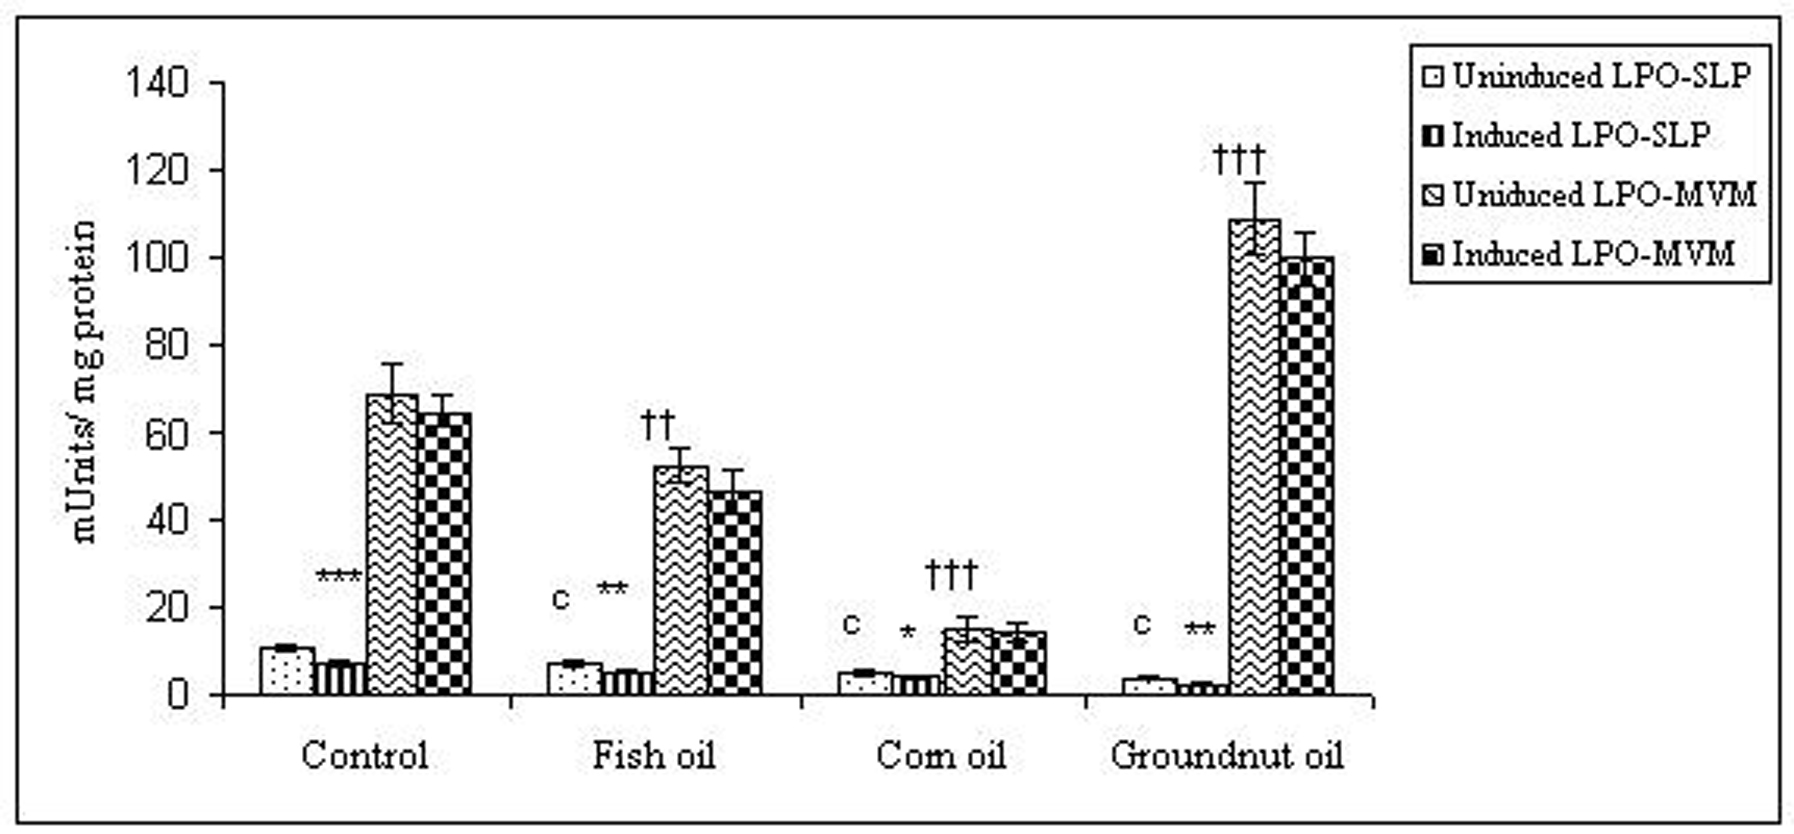
Figure 5. Effect of lipid peroxidation induction in vitro on lactase activity (µmole/min/mg protein) of SLP and MVM isolated from control and fat fed rats. Uninduced LPO-SLP vs Induced LPO-SLP, *p < 0.05; **p < 0.01; ***p < 0.001. Uninduced LPO-MVM vs Induced LPO-MVM, a, p < 0.05; b, p < 0.01; c, p < 0.001. Control SLP vs Different dietary oils SLP, #p < 0.05; ##p < 0.01; ###p < 0.001. Control MVM vs Different dietary oils MVM, †p < 0.05; ††p < 0.01; †††p < 0.001.
Table
Table 1. Distribution of brush border enzymes in surfactant-like-particles and microvillus membranes from control and oil fed rats.
| Enzyme | SLP | MVM |
|---|
| Protein (Units/mg) | Control | Corn oil | Fish oil | Groundnut oil | Control | Corn oil | Fish oil | Groundnut oil |
|---|
| ***p < 0.001; **p < 0.01; *p < 0.05; NS = non significant. Values are mean ± SD, n = 8. |
| AP | 2.73 ±0.18 | 4.48±0.15*** | 3.69±0.10*** | 6.38±0.05*** | 2.170±0.18 | 1.19±0.09*** | 2.82±0.05*** | 1.62±0.13** |
| | (+64%) | (+35%) | (+135%) | | (-45%) | (+30%) | (-25%) |
| Sucrase | 0.151±0.03 | 0.122±0.06NS | 0.135 ±0.05NS | 0.083±0.02** | 2.27±0.12 | 0.851±0.05*** | 1.89±0.14** | 0.78±0.08*** |
| | (-19%) | (-11%) | (-45%) | | (-62%) | (-17%) | (-66%) |
| Lactase | 0.011±0.001 | 0.005±0.001 | 0.007±0.001* | 0.004±0.001*** | 0.074±0.005 | 0.017±0.001** | 0.056±0.001*** | 0.115±0.005*** |
| | (-55%) | (-36%) | (-66%) | | (-77%) | (-24%) | (+55%) |
| Maltase | 0.163±0.008 | 0.045±0.005*** | 0.072±0.005*** | 0.097±0.005*** | 0.756±0.05 | 0.358±0.06*** | 0.185±0.04*** | 0.301±0.07*** |
| | (-72%) | (-56%) | (-40%) | | (-53%) | (-75%) | (-60%) |
| Trehalase | 0.128±0.002 | 0.025±0.001*** | 0.042±0.003*** | 0.033±0.001*** | 0.886±0.03 | 0.183±0.06*** | 0.195±0.05*** | 0.201±0.02*** |
| | (-80%) | (-67%) | (-74%) | | (-79%) | (-78%) | (-77%) |
| LAP | 0.120±0.01 | 0.041±0.01*** | 0.053±0.01*** | 0.059±0.005* | 0.235±0.005 | 0.251±0.06NS | 0.17±0.003*** | 0.185±0.003*** |
| | (-66%) | (-55%) | (-51%) | | (+7%) | (-28%) | (-21%) |
| γ- GTP | 0.117±0.005 | 0.063±0.003*** | 0.134±0.03NS | 0.082±0.004*** | 0.268±0.01 | 0.237±0.04NS | 0.301±0.01N S | 0.291±0.05NS |
| | (-46%) | (+17%) | (-30%) | | (-12%) | (+12%) | (+9%) |