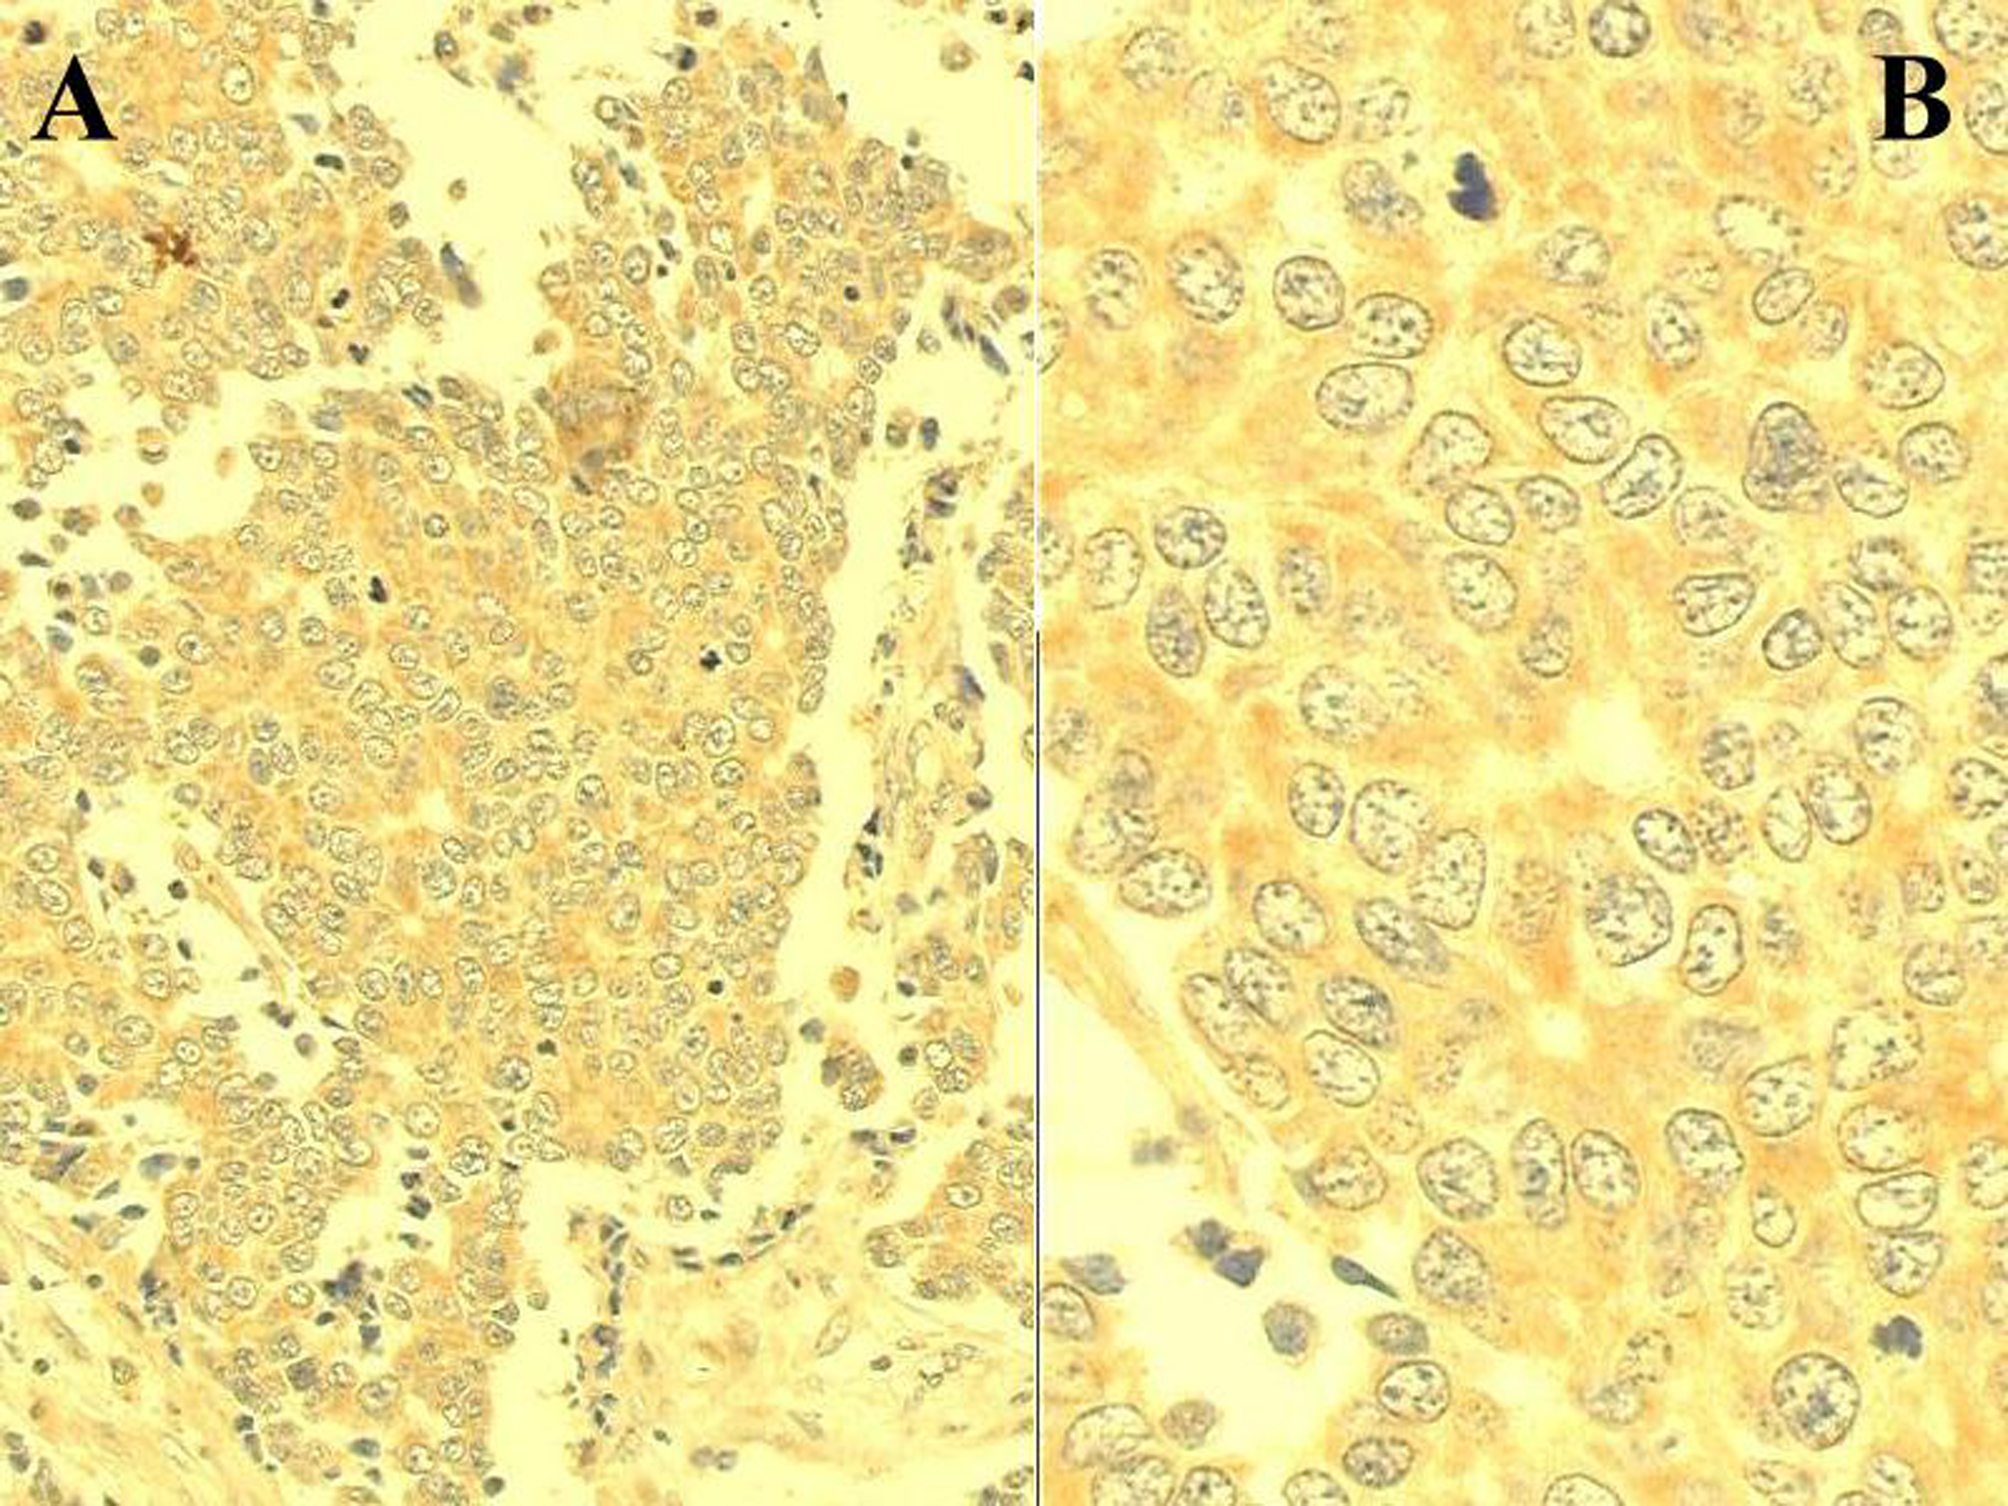
Figure 1. C-reactive protein immunoexpression in a sample of rectal adenocarcinoma. Positive cells display cytoplasmic brownish granulation stained by the DAB chromogen (ABC method; A: x 200; B: x 500).
| Gastroenterology Research, ISSN 1918-2805 print, 1918-2813 online, Open Access |
| Article copyright, the authors; Journal compilation copyright, Gastroenterol Res and Elmer Press Inc |
| Journal website http://www.gastrores.org |
Original Article
Volume 2, Number 2, April 2009, pages 104-109
Expression of C-Reactive Protein in Rectal Cancer
Figures
Tables
| Features | Controls (n=22) | Cases (n=91) | p value | Deaths (n=42) | Survivors (n=49) | p value |
|---|---|---|---|---|---|---|
| Data are presented as mean (SE: Standard error), medium (interquartile range: 25th-75th percentile), or counting (percentage). | ||||||
| Age (median, SE), years | 49.1 (13.4) | 60.6 (14.2) | <0.01 | 62.1 (15.3) | 59.4 (13.3) | 0.38 |
| Male: Female | 7:15 | 40:51 | 0.30 | 22:20 | 18:21 | 0.13 |
| Location, from anal verge( mean, SE), cm | 6.9 (3.4) | –– | 6.5 (3.1) | 7.1 (3.6) | 0.39 | |
| Differentiation, n (%) | ||||||
| well | 9 (10) | –– | 1 (2) | 8 (16) | <0.01 | |
| moderate | 71 (78) | 32 (76) | 39 (80) | |||
| poor | 11 (12) | 9 (21) | 2 (4) | |||
| Depth of invasion, n (%) | ||||||
| Submucosa | 5 (6) | –– | 1 (2) | 4 (8) | 0.07 | |
| Muscularis propria | 24 (26) | 7 (17) | 17 (35) | |||
| Adventitia | 15 (17) | 10 (24) | 5 (10) | |||
| Surrounding tissues | 47 (52) | 24 (57) | 23 (47) | |||
| Lymph-node positive cases, n (%) | 48 (53) | –– | 31 (74) | 17 (35) | <0.01 | |
| n=89 | ||||||
| Circumferential invasion, n (%) | 7 (8) | –– | 6 (15) | 1 (2) | 0.04 | |
| Dukes–Turnbull | ||||||
| A | 25 (28) | –– | 5 (12) | 20 (41) | <0.01 | |
| B | 17 (19) | 5 (12) | 12 (25) | |||
| C | 34 (37) | 22 (52) | 12 (25) | |||
| D | 15 (17) | 10 (24) | 5 (10) | |||
| Adjuvant therapy, n (%) | n=85 | |||||
| Radiotherapy (RT) | 5 (6) | –– | 4 (10) | 1 (2) | 0.23 | |
| Chemotherapy (CT) | 3 (4) | 1 (3) | 2 (4) | |||
| Combined CT + RT | 14 (17) | 4 (10) | 10 (22) | |||
| No adjuvant therapy | 63 (74) | 30 (77) | 33 (72) | |||
| CRP expression ≥ 10%, n (%) | 22 (100) | 65 (71) | <0.01 | 30 (71) | 35 (71) | 0.99 |
| Features (n) | Death | HR | CI 95% | p value | ||
|---|---|---|---|---|---|---|
| n | % | |||||
| Data presented as counts and percentages. HR: hazard ratio by a multiple Cox model; CRP: Tumour expression of C-reactive protein as measured by percentage of positive cells; CI 95%: 95% confidence interval. *Cox model including only those subjects (n=81, events=37) with thorough observations. | ||||||
| CRP expression | ||||||
| ≥ 10% (65) | 30 | 46.2 | 1.31 | 0.58-2.94 | 0.51 | |
| < 10% (26) | 12 | 46.2 | 1.00 | |||
| Age | ||||||
| ≥ 60 years (55) | 27 | 49.1 | 1.32 | 0.66-2.64 | 0.43 | |
| < 60 years (36) | 15 | 41.7 | 1.00 | |||
| Circumferential wedge | ||||||
| Positive (7) | 6 | 85.7 | 3.64 | 1.26-10.51 | 0.02 | |
| Negative (82) | 34 | 41.5 | 1.00 | |||
| Dukes-Turnbull | ||||||
| A (25) | 25 | 5 | 20.0 | 1.00 | 0.01 | |
| B (17) | 17 | 5 | 29.4 | 1.21 | 0.33-4.48 | 0.78 |
| C (34) | 34 | 22 | 64.7 | 4.59 | 1.72-12.27 | 0.01 |
| D (15) | 15 | 10 | 66.7 | 4.85 | 1.25-18.77 | 0.02 |