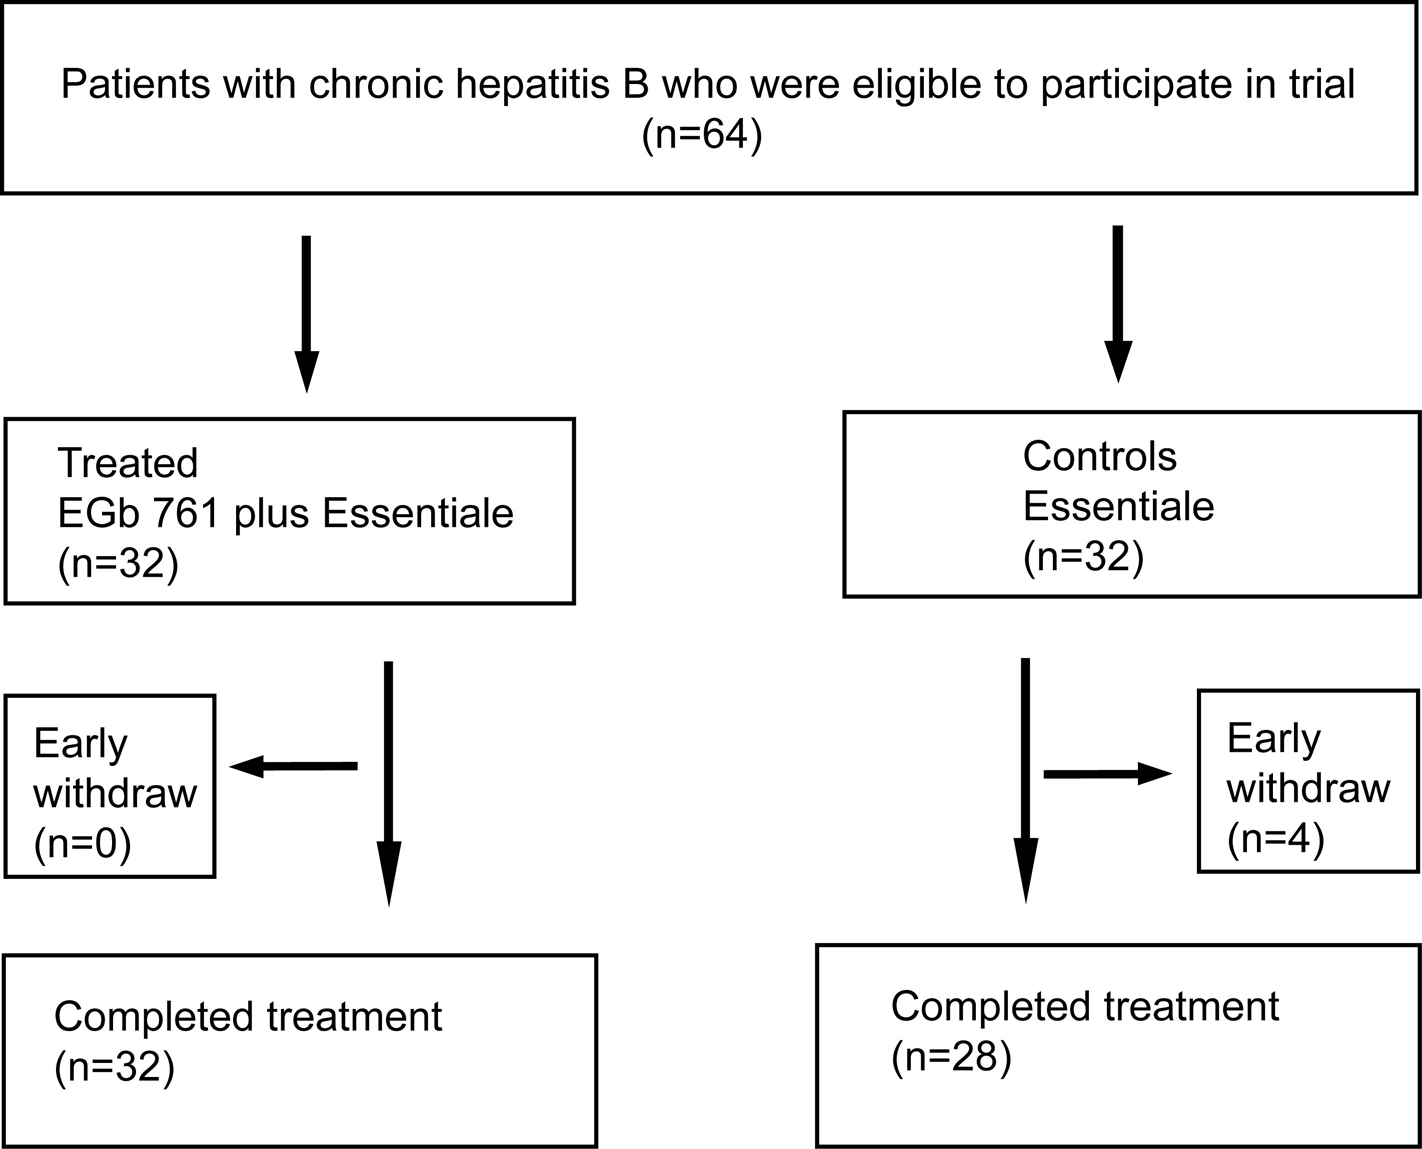
Figure 1. Flowchart of patients included at various stages of the trial
| Gastroenterology Research, ISSN 1918-2805 print, 1918-2813 online, Open Access |
| Article copyright, the authors; Journal compilation copyright, Gastroenterol Res and Elmer Press Inc |
| Journal website http://www.gastrores.org |
Original Article
Volume 1, Number 1, December 2008, pages 20-28
Ginkgo Biloba Extract EGb 761 Alleviates Hepatic Fibrosis and Sinusoidal Microcirculation Disturbance in Patients with Chronic Hepatitis B
Figures
Tables
| Characteristics | Treated | Controls | p |
|---|---|---|---|
| No. patients | 32 | 32 | |
| Age (y) | 44.7 ± 10.8 | 42.9 ± 11.3 | NS |
| Weight (kg) | 63.7 ± 11.7 | 62.2 ± 9.8 | NS |
| Male/female | 27/13 | 22/12 | NS |
| Hepatitis history (y) | 3.4 ± 1.8 | 3.3 ± 1.7 | NS |
| Group | n | ALT (IU/L) | ALB (g/L) | TBIL (µmol/L) | PT (s) | HBV DNA (x107copies/ml) | |
|---|---|---|---|---|---|---|---|
| Data are expressed as mean ± SD. Fisher’s exact test, EGb 761 versus Control. NS, not significant (P>0.05). Comparisons of blood levels of ALT, TBil, PT, ALB, and HBV DNA titres between baseline and after treatment in the same group; and comparisons inter-groups. ALT, alanine aminotransferase; TBIL, total bilirubin; ALB, albumin; PT, prothrombin. *P<0.05 VS baseline, **P<0.01 VS baseline | |||||||
| Treated | Baseline | 32 | 75.7±18.5 | 34.9±4.4 | 39.3±21.2 | 15.2±3.4 | 4.5±2.7 |
| Week 4 | 32 | 37.3±16.3* | 38.2±5.9* | 17.1±9.5** | 13.2±2.1* | 4.4±2.4 | |
| Controls | Baseline | 28 | 83.3± 11.4 | 35.1±4.8 | 38.2±25.4 | 15.0±3.5 | 4.3±2.5 |
| Week 4 | 28 | 35.2±18.6* | 38.3±6.1* | 17.6±8.1* | 13.1±1.9* | 4.4±2.3 | |
| Group | n | TGF-β1 (µg/L) | PAF (µg/L) | ET-1 (µg/L) | |
|---|---|---|---|---|---|
| Comparisons of TGF-β, PAF and ET-1 in two groups before and after treatment. TGF-β1: transforming growth factor β1; PAF platelet activate factor; ET-1 endothelin-1. *P<0.05 VS baseline; ** P<0.01 VS baseline, △P<0.05 VS week 4 in treated group; △△P<0.01 VS week 4 in treated group. | |||||
| Treated | Baseline | 32 | 58.43±11.04 | 13.23±9.79 | 68.13±21.71 |
| Week 4 | 32 | 17.61±5.06* | 7.62±6.54 * | 47.61±15.34** | |
| Controls | Baseline | 28 | 57.69±10.23 | 12.44±9.63 | 65.46±20.67 |
| Week 4 | 28 | 61.17±11.45△ | 11.65±8.96△ | 61.17±16.45△△ | |
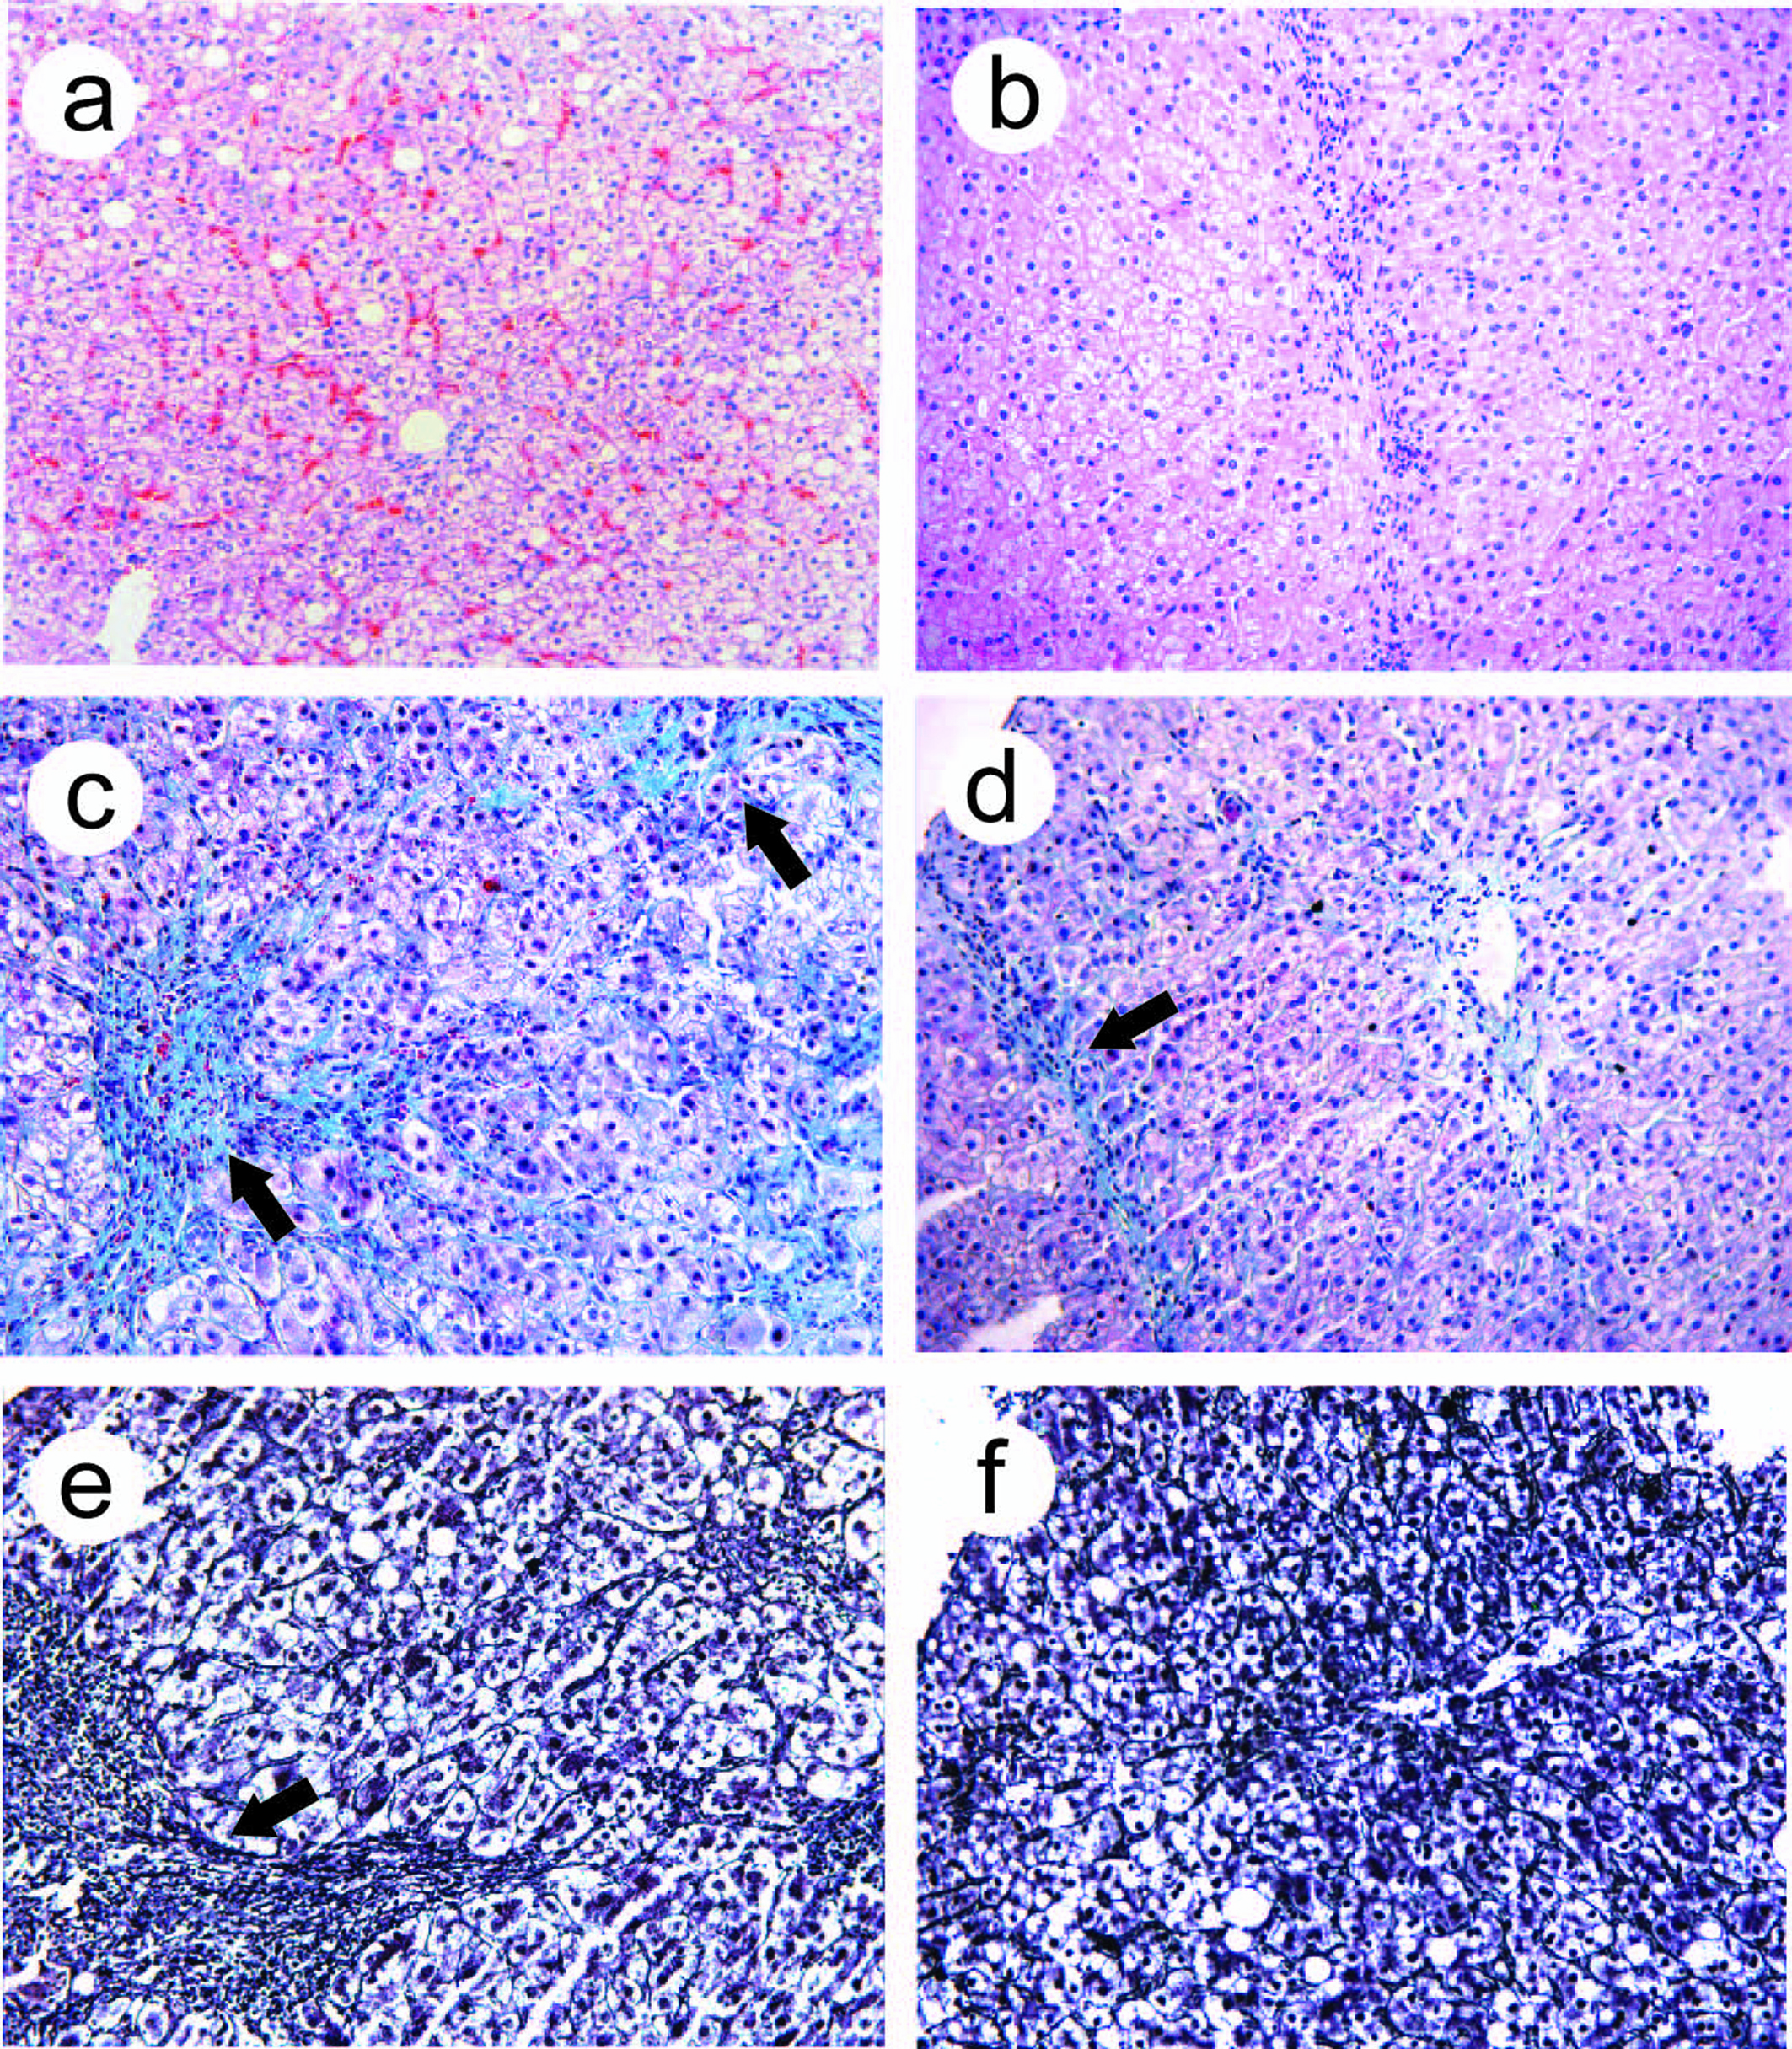
| Group | n | Inflammation score | Fibrosis score | Collagen (%) | |
|---|---|---|---|---|---|
| Hepatic inflammation, fibrosis and collagen deposit before and after treatment in two groups. *P<0.05 VS baseline; △P<0.05 VS 4 weeks in treated group. Collagen density was represented by the collagen percentage in each field, data was mean ± SD. | |||||
| Baseline | 26 | 15.7±6.3 | 3.2±0.6 | 21.6±9.3 | |
| Week 4 | 26 | 10.7±4.8* | 2.2±0.3* | 14.7±6.4* | |
| Baseline | 21 | 15.6±5.9 | 3.3±0.4 | 22.7±9.8 | |
| Week 4 | 21 | 14.2±6.6△ | 3.1±0.5△ | 21.2±9.3△ | |
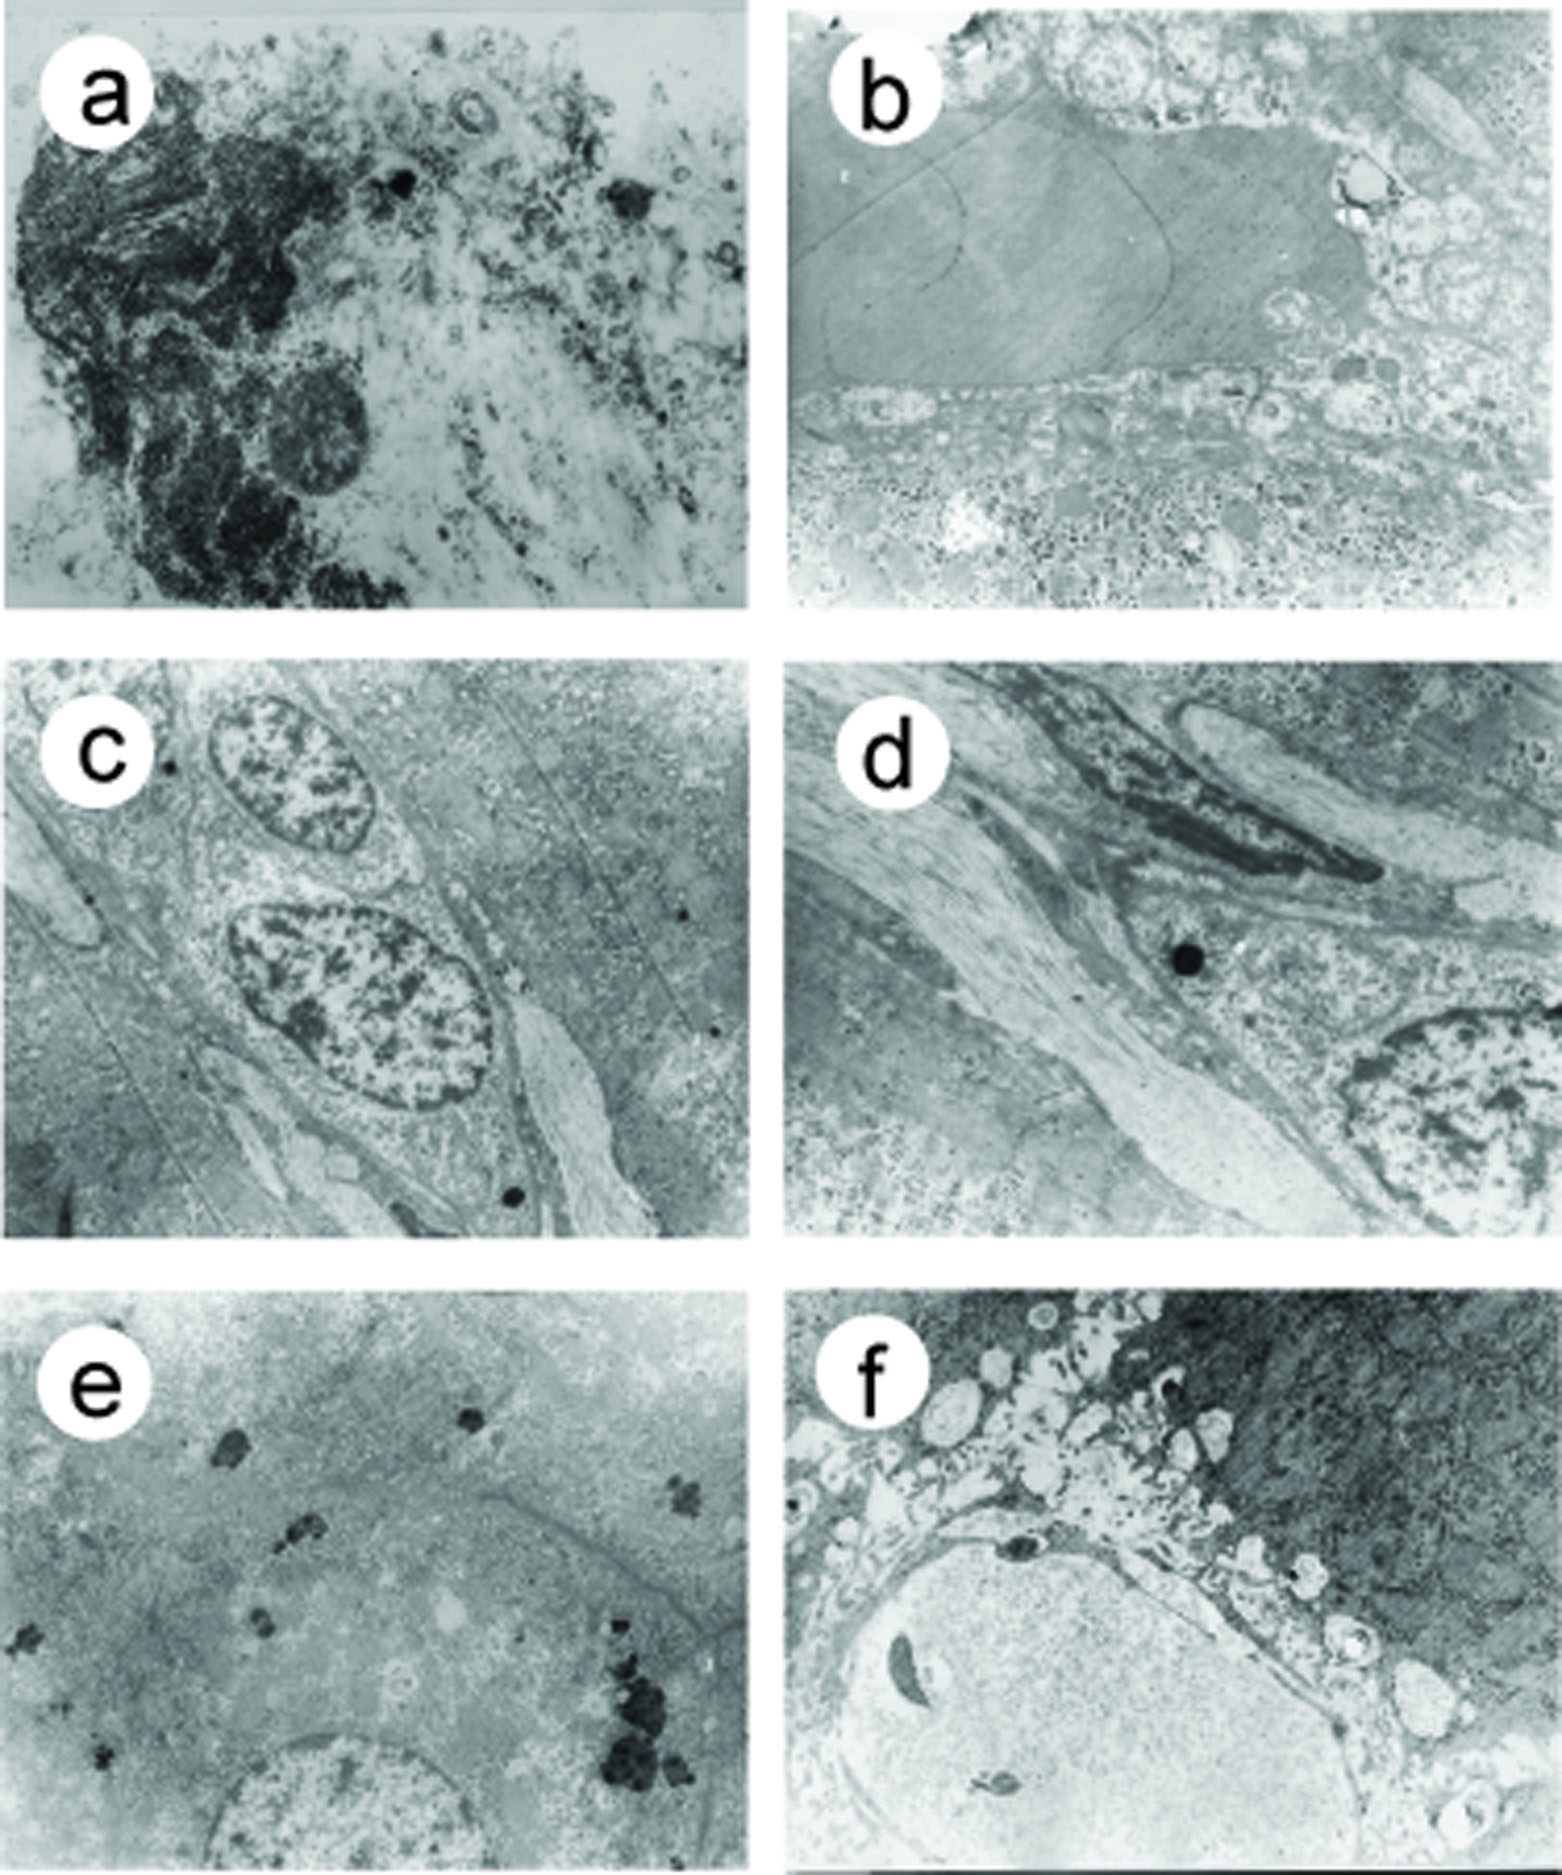
| n | Microthrombosis | Collagen | Endothelial Damage | Capillarization | ||
|---|---|---|---|---|---|---|
| Ultrastructural observation of sinusoidal microcirculation in the two groups before and after treatment. Microthrombosis, collagen deposit, endothelial damage and capilliarization were examined for each sinusoid, 100 sinusoids were observed for each group before or after treatment. *P<0.05 VS baseline;** P<0.01 VS baseline; △P<0.05 VS week 4 in control group. | ||||||
| Treated | Baseline | 100 | 56 | 38 | 59 | 32 |
| Week 4 | 100 | 32**△ | 23*△ | 41*△ | 17*△ | |
| Controls | Baseline | 100 | 58 | 37 | 61 | 30 |
| Week 4 | 100 | 53 | 34 | 57 | 29 | |