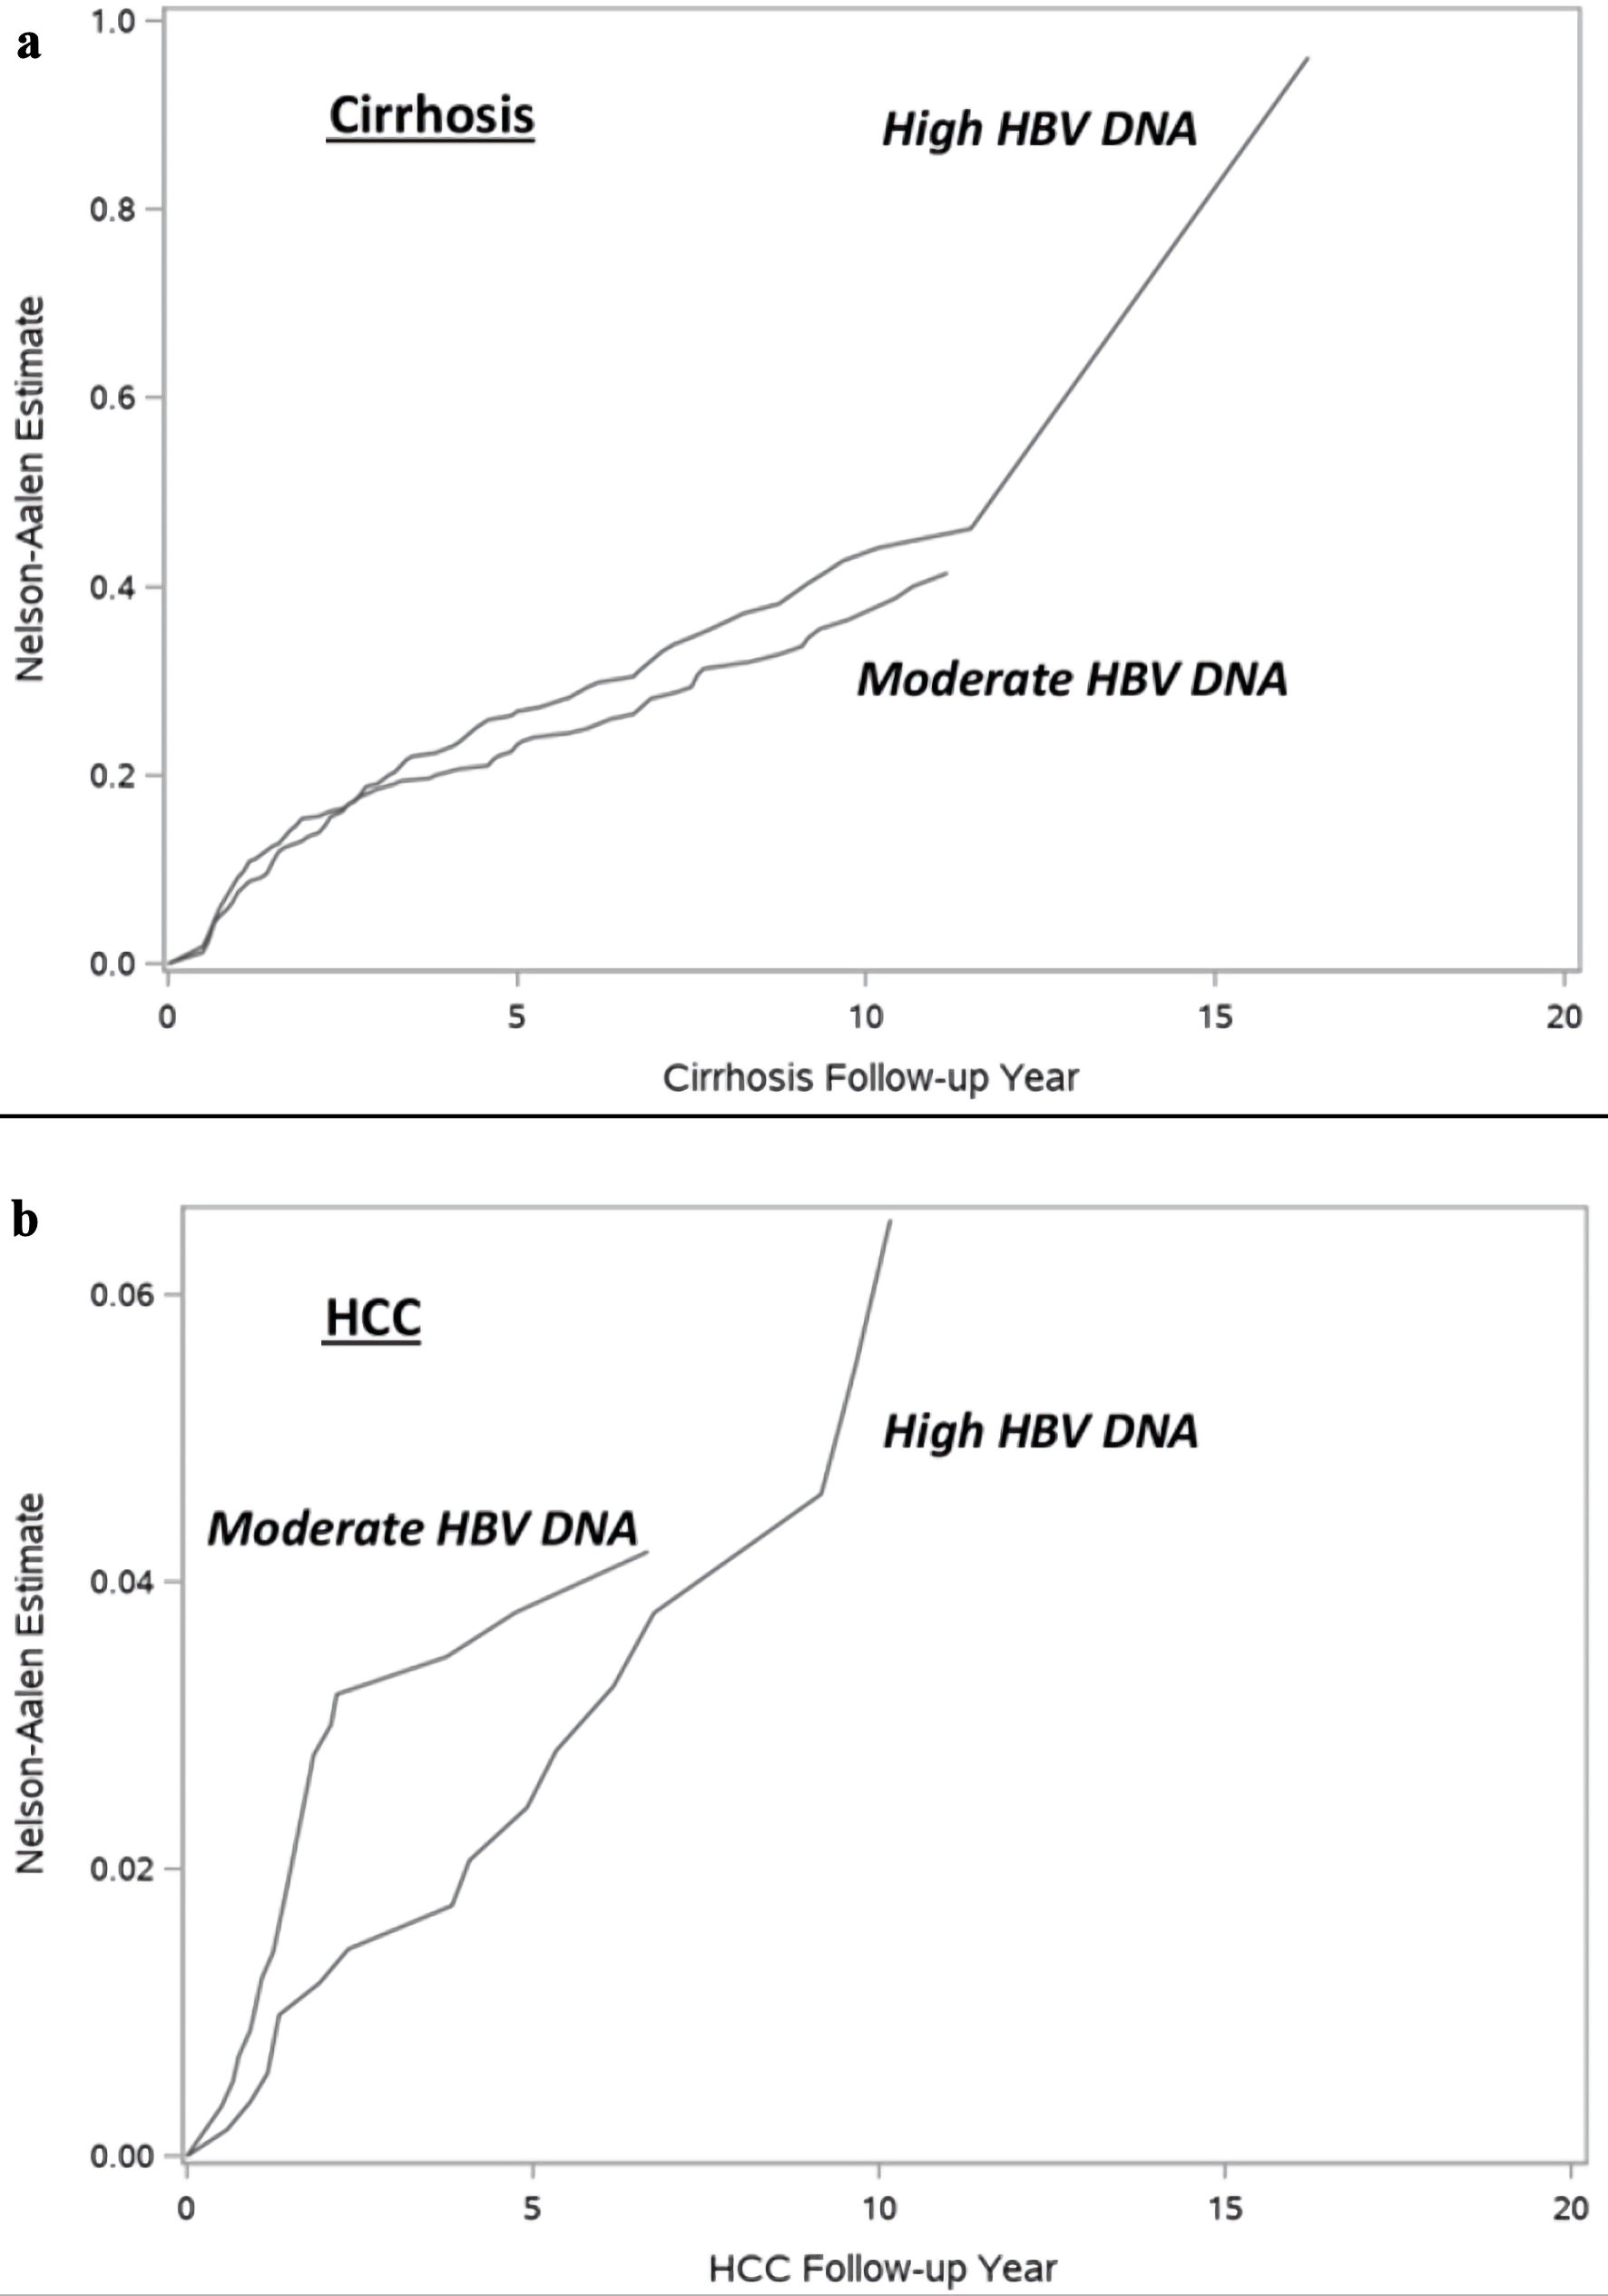
Figure 1. Figure 1. Incidence of (a) cirrhosis and (b) hepatocellular carcinoma by baseline HBV DNA. HBV: hepatitis B virus; HCC: hepatocellular carcinoma.
| Gastroenterology Research, ISSN 1918-2805 print, 1918-2813 online, Open Access |
| Article copyright, the authors; Journal compilation copyright, Gastroenterol Res and Elmer Press Inc |
| Journal website https://www.gastrores.org |
Original Article
Volume 17, Number 3, June 2024, pages 109-115
Association of Baseline Hepatitis B Virus DNA and On-Treatment Risk of Cirrhosis and Hepatocellular Carcinoma
Figure
Tables
| Variables | Moderate HBV DNA (4.00 - 6.99 log10 IU/mL) | High HBV DNA (7.00 log10 IU/mL or higher) | SMD (before weighting) | SMD (after weighting) | ||
|---|---|---|---|---|---|---|
| Proportion (%) | Frequency (n) | Proportion (%) | Frequency (n) | |||
| aNo alcohol use: AUDIT-C = 0. bLow-risk alcohol: AUDIT-C = 1 - 2 for women and 1 - 3 for men. cHigh-risk alcohol: AUDIT-C > 3 for women and > 4 for men. HBV: hepatitis B virus; HBeAg: hepatitis B e antigen; FIB-4: fibrosis-4; SMD: standard mean difference; AUDIT-C: Alcohol Use Disorders Identification Test. | ||||||
| Total | 100 | 585 | 100 | 544 | ||
| Antiviral treatment | 0.05004 | 0.07214 | ||||
| Entecavir | 62.74 | 367 | 64.89 | 353 | ||
| Tenofovir alafenamide | 7.35 | 43 | 5.7 | 31 | ||
| Tenofovir disoproxil fumarate | 29.91 | 175 | 29.41 | 160 | ||
| HBeAg status | 1.0264 | 0 | ||||
| HBeAg positive | 41.32 | 188 | 84.98 | 345 | ||
| Sex | -0.01885 | -0.00992 | ||||
| Female | 4.62 | 27 | 4.23 | 23 | ||
| Male | 95.38 | 558 | 95.77 | 521 | ||
| Race/ethnicity | 0.33475 | 0 | ||||
| American Indian or Alaska Native | 0.18 | 1 | 0.19 | 1 | ||
| Asian or Pacific Islander | 21.15 | 118 | 10.29 | 54 | ||
| Black or African American | 37.99 | 212 | 36.95 | 194 | ||
| Hispanic | 2.51 | 14 | 4.38 | 23 | ||
| Non-Hispanic White | 38.17 | 213 | 48.19 | 253 | ||
| Age | 0.15735 | 0.06375 | ||||
| Age (mean ± SD) | 55.92 ± 13.91 | 58.11 ± 13.38 | ||||
| 18 - 39 years | 15.04 | 88 | 11.03 | 60 | ||
| 40 - 59 years | 39.32 | 230 | 36.21 | 197 | ||
| 60 years and over | 45.64 | 267 | 52.76 | 287 | ||
| BMI categories | 0.10212 | 0.16677 | ||||
| BMI (mean ± SD, kg/m2) | (28.23 ± 5.34) | (28.60 ± 6.18) | ||||
| 18.0 - 24.9 | 28.27 | 162 | 28.76 | 153 | ||
| 25.0 - 29.9 | 37.35 | 214 | 34.77 | 185 | ||
| 30.0 - 34.9 | 24.08 | 138 | 21.99 | 117 | ||
| 35.0 and over | 10.3 | 59 | 14.47 | 77 | ||
| Comorbidities | ||||||
| Diabetes | 27.52 | 161 | 30.51 | 166 | -0.06599 | -0.0522 |
| Hypertension | 60.17 | 352 | 66.73 | 363 | -0.13648 | -0.01316 |
| Alcohol use categories | 0.11127 | 0.02222 | ||||
| No alcohola | 42.88 | 223 | 48.36 | 236 | ||
| Low-risk drinkingb | 38.85 | 202 | 34.43 | 168 | ||
| High-risk drinkingc | 18.27 | 95 | 17.21 | 84 | ||
| Tobacco use categories | 0.21708 | 0.04502 | ||||
| Never | 41.55 | 209 | 32.13 | 142 | ||
| Past history of tobacco | 20.48 | 103 | 21.04 | 93 | ||
| Active current tobacco | 37.97 | 191 | 46.83 | 207 | ||
| FIB-4 categories | 0.21459 | 0.04146 | ||||
| FIB-4 score < 1.45 | 42.67 | 224 | 32.67 | 163 | ||
| FIB-4 score 1.45 - 3.25 | 36.19 | 190 | 39.68 | 198 | ||
| FIB-4 score > 3.25 | 21.14 | 111 | 27.66 | 138 | ||
| Incidence of cirrhosis | HR | 95% CI | P value | |
|---|---|---|---|---|
| aModerate HBV DNA: 4.00 - 6.99 log10 IU/mL. bHigh HBV DNA: 7.00 log10 IU/mL or higher. HBV: hepatitis B virus; HR: hazard ratio; CI: confidence interval. | ||||
| Before propensity weighting | ||||
| Moderate HBV DNAa | 4.15 per 100 person-years | 0.87 | (0.69, 1.11) | |
| High HBV DNAb | 4.84 per 100 person years | Reference | 0.28 | |
| After propensity weighting | ||||
| Moderate HBV DNA | 4.55 per 100 person-years | 0.87 | (0.69, 1.09) | |
| High HBV DNA | 5.22 per 100 person-years | Reference | 0.22 | |
| Incidence of HCC | HR | 95% CI | P value | |
|---|---|---|---|---|
| aModerate HBV DNA: 4.00 - 6.99 log10 IU/mL. bHigh HBV DNA: 7.00 log10 IU/mL or higher. HBV: hepatitis B virus; HCC: hepatocellular carcinoma; HR: hazard ratio; CI: confidence interval. | ||||
| Before propensity weighting | ||||
| Moderate HBV DNAa | 0.55 per 100 person-years | 1.12 | (0.58, 2.17) | |
| High HBV DNA | 0.50 per 100 person-years | Reference | 0.73 | |
| After propensity weighting | ||||
| Moderate HBV DNAb | 0.84 per 100 person-years | 1.33 | (1.09, 1.62) | |
| High HBV DNA | 0.69 per 100 person-years | Reference | < 0.01 | |