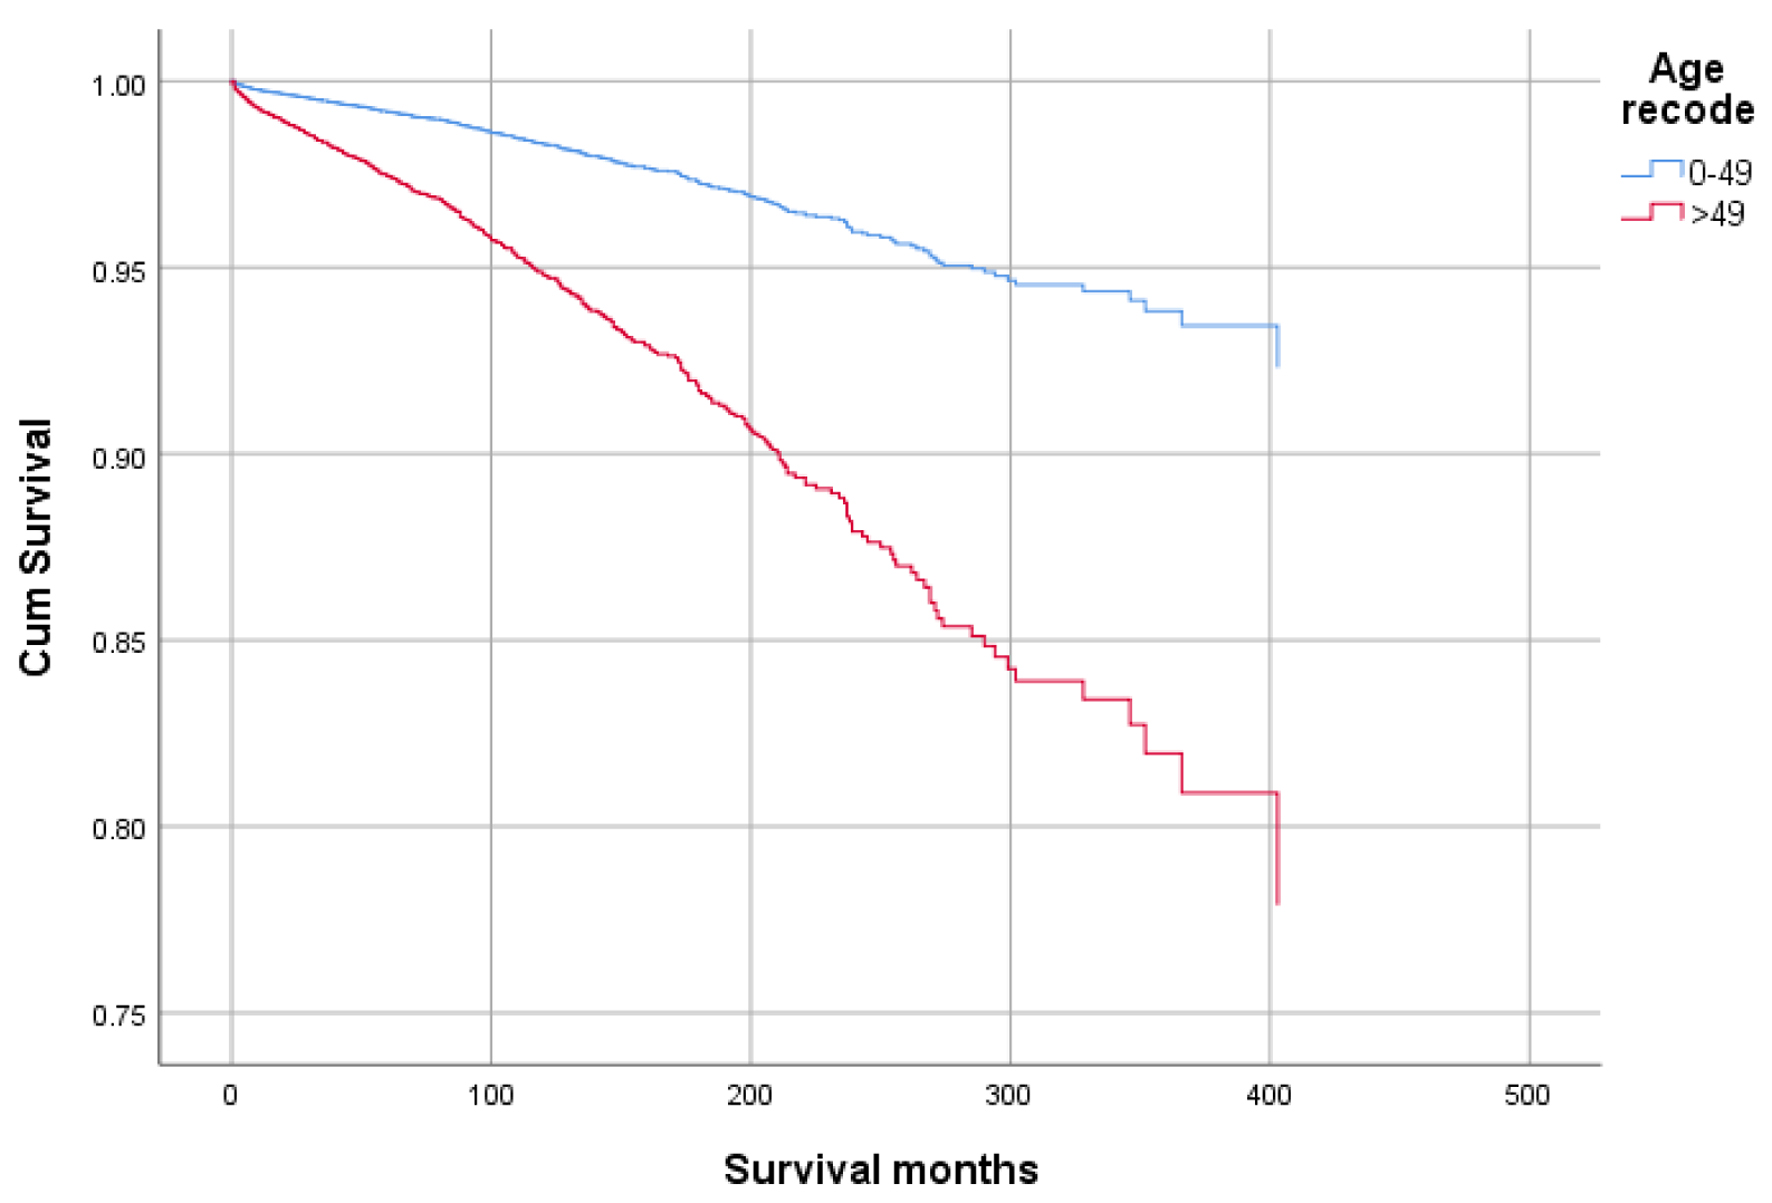
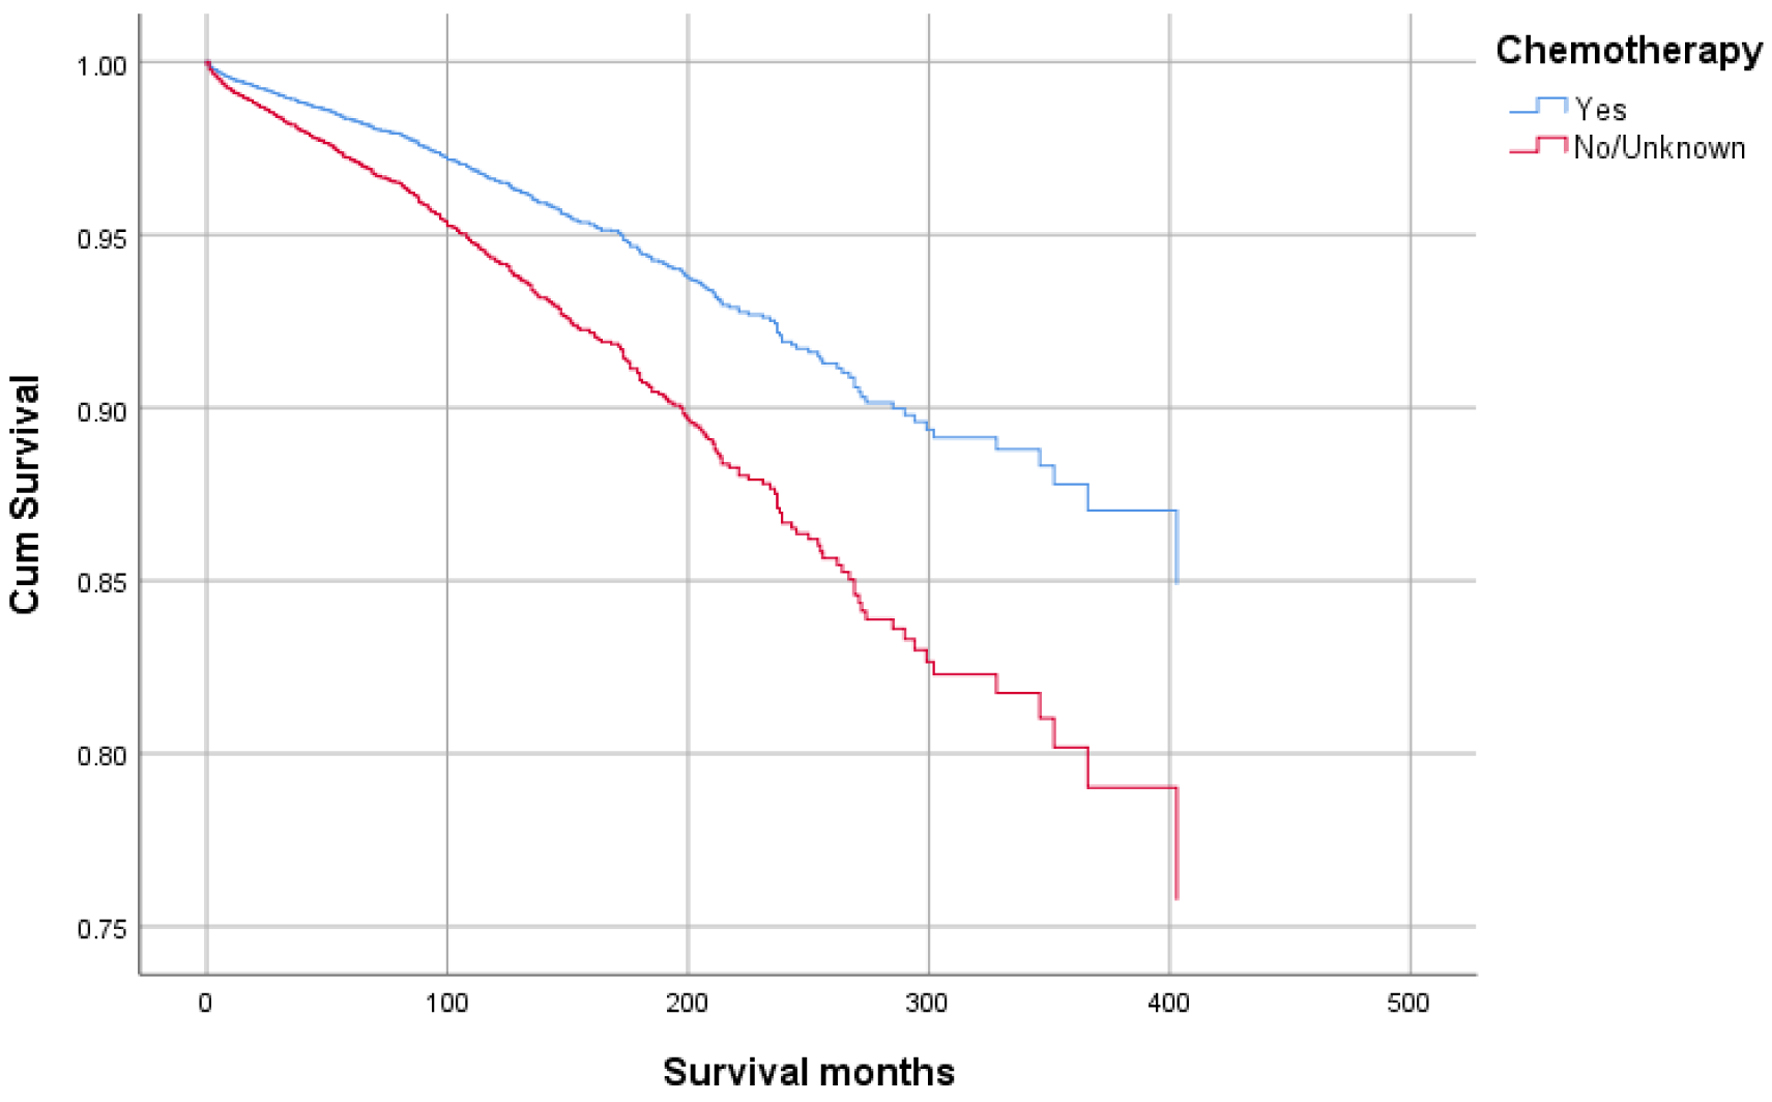
Figure 1. Survival curve for infection-caused mortality with age.
| Gastroenterology Research, ISSN 1918-2805 print, 1918-2813 online, Open Access |
| Article copyright, the authors; Journal compilation copyright, Gastroenterol Res and Elmer Press Inc |
| Journal website https://www.gastrores.org |
Original Article
Volume 17, Number 3, June 2024, pages 133-145
The Risk of Infection-Caused Mortality in Gastric Adenocarcinoma: A Population-Based Study
Figures
Tables
| Variables | Alive (n = 7,427) | Pneumonia and influenza (n = 469) | Septicemia (n = 263) | TB (n = 8) | Other infections (n = 114) | Other cause of death (n = 51,299) | Total (n = 59,580) |
|---|---|---|---|---|---|---|---|
| All data are presented as n (%) except age presented as mean (standard deviation). NOS: not otherwise specified; TB: tuberculosis. | |||||||
| Age | 63.64 (12.302) | 73.37 (9.941) | 70.47 (10.793) | 73.25 (13.21) | 67.46 (12.915) | 69.14 (12.321) | 68.49 (12.438) |
| Sex | |||||||
| Male | 5,051 (68) | 335 (71.4) | 173 (65.8) | 6 (75) | 81 (71.1) | 34,780 (67.8) | 40,426 (67.9) |
| Female | 2,376 (32) | 134 (28.6) | 90 (34.2) | 2 (25) | 33 (28.9) | 16,519 (32.2) | 19,154 (32.1) |
| Race | |||||||
| White | 5,212 (70.2) | 327 (69.7) | 194 (73.8) | 4 (50) | 79 (69.3) | 39,070 (76.2) | 44,886 (75.3) |
| Black | 751 (10.1) | 49 (10.4) | 49 (18.6) | 1 (12.5) | 20 (17.5) | 6,268 (12.2) | 7,138 (12) |
| Others | 1,464 (19.7) | 93 (19.8) | 20 (7.6) | 3 (37.5) | 15 (13.2) | 5,961 (11.6) | 7,556 (12.7) |
| Marital status | |||||||
| Single | 956 (12.9) | 45 (9.6) | 30 (11.4) | - | 29 (25.4) | 5,548 (10.8) | 6,608 (11.1) |
| Married | 5,128 (69) | 282 (60.1) | 157 (59.7) | 5 (62.5) | 56 (49.1) | 31,086 (60.6) | 36,714 (61.6) |
| Separated | 75 (1) | 6 (1.3) | 3 (1.1) | - | - | 723 (1.4) | 807 (1.4) |
| Divorced | 537 (7.2) | 29 (6.2) | 18 (6.8) | - | 7 (6.1) | 3,723 (7.3) | 4,314 (7.2) |
| Widowed | 731 (9.8) | 107 (22.8) | 55 (20.9) | 3 (37.5) | 22 (19.3) | 10,219 (19.9) | 11,137 (18.7) |
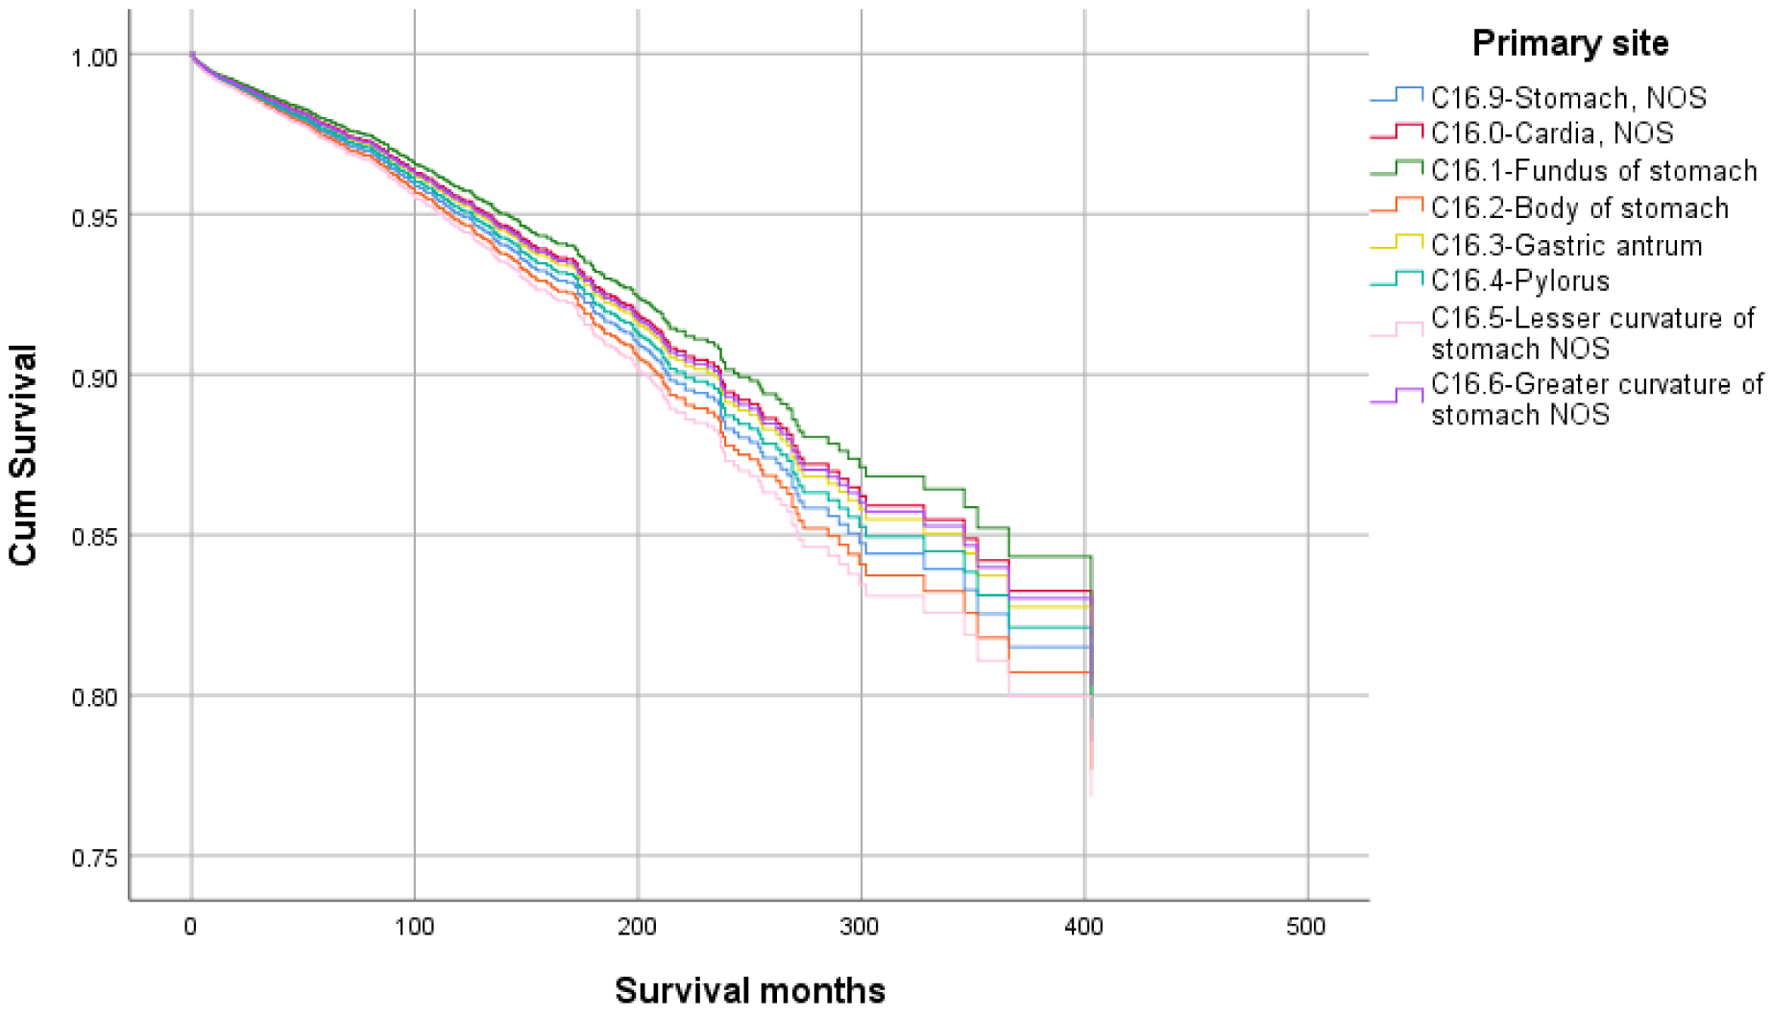
| Primary site | |||||||
| Stomach, NOS | 12 (10.5) | 58 (12.4) | 38 (14.4) | - | 12 (10.5) | 7,669 (14.9) | 8,431 (14.2) |
| Cardia, NOS | 40 (35.1) | 126 (26.9) | 90 (34.2) | 3 (37.5) | 40 (35.1) | 18,985 (37) | 2,2451 (37.7) |
| Fundus of stomach | 4 (3.5) | 6 (1.3) | 15 (5.7) | - | 4 (3.5) | 2,151 (4.2) | 2,389 (4) |
| Body of stomach | 9 (7.9) | 30 (6.4) | 24 (9.1) | 1 (12.5) | 9 (7.9) | 3,611 (7) | 4,206 (7.1) |
| Gastric antrum | 26 (22.8) | 112 (23.9) | 49 (18.6) | 2 (25) | 26 (22.8) | 9,979 (19.5) | 11,695 (19.6) |
| Pylorus | 3 (2.6) | 27 (5.8) | 8 (3) | - | 3 (2.6) | 1,879 (3.7) | 2,148 (3.6) |
| Lesser curvature of stomach, NOS | 17 (14.9) | 90 (19.2) | 23 (8.7) | 2 (25) | 17 (14.9) | 4,867 (9.5) | 5,768 (9.7) |
| Greater curvature of stomach, NOS | 3 (2.6) | 20 (4.3) | 16 (6.1) | - | 3 (2.6) | 2,158 (4.2) | 2,492 (4.2) |
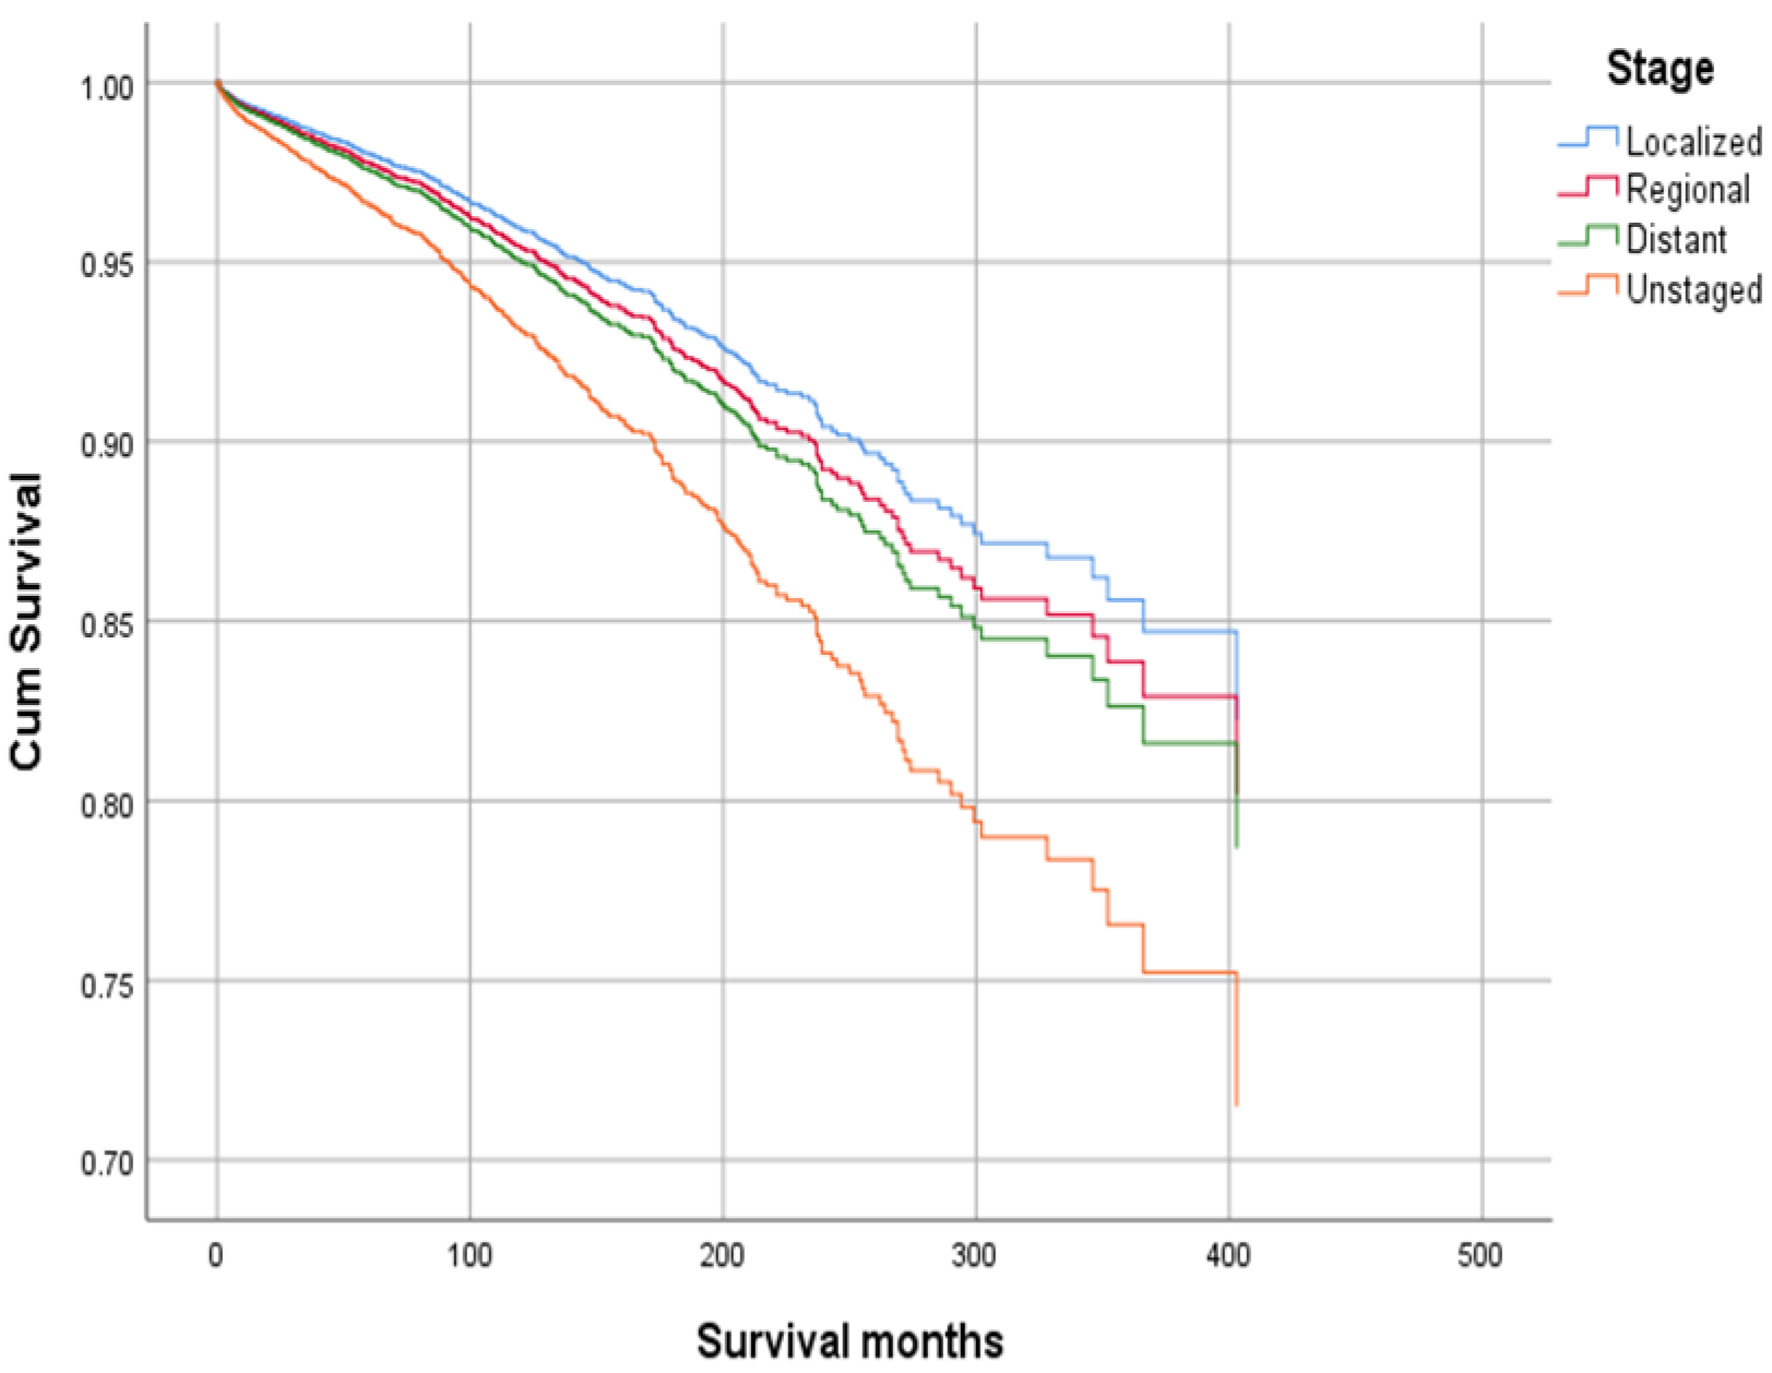
| Stage | |||||||
| Localized | 45 (39.5) | 219 (46.7) | 89 (33.8) | 5 (62.5) | 45 (39.5) | 10,238 (20) | 14,351 (24.1) |
| Regional | 37 (32.5) | 162 (34.5) | 93 (35.4) | 2 (25) | 37 (32.5) | 16,911 (33) | 19,680 (33) |
| Distant | 20 (17.5) | 54 (11.5) | 57 (21.7) | - | 20 (17.5) | 20,168 (39.3) | 21,222 (35.6) |
| Unstaged | 12 (10.5) | 34 (7.2) | 24 (9.1) | 1 (12.5) | 12 (10.5) | 3,982 (7.8) | 4,327 (7.3) |
| Chemotherapy | |||||||
| Yes | 28 (24.6) | 91 (19.4) | 88 (33.5) | 1 (12.5) | 28 (24.6) | 18,628 (36.3) | 22,327 (37.5) |
| No/unknown | 86 (75.4) | 378 (80.6) | 175 (66.5) | 7 (87.5) | 86 (75.4) | 32,671 (63.7) | 37,253 (62.5) |
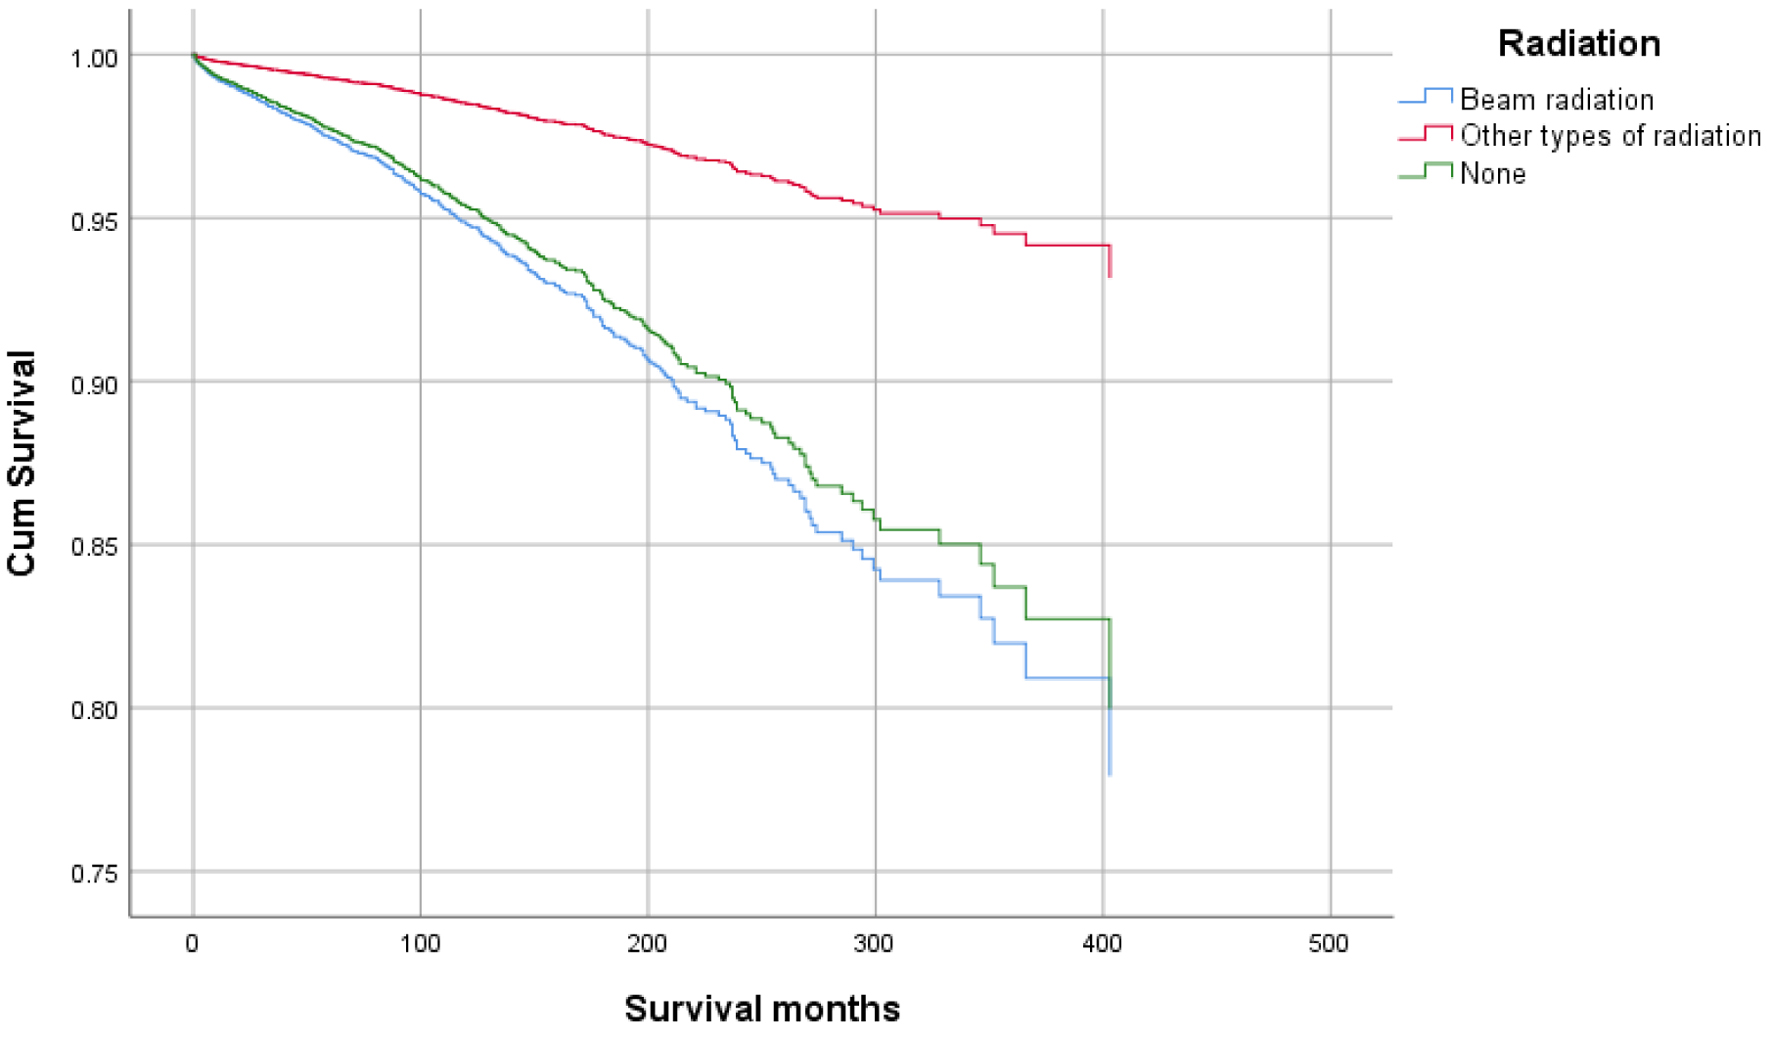
| Radiation | |||||||
| Beam radiation | 25 (21.9) | 68 (14.5) | 61 (23.2) | 1 (12.5) | 25 (21.9) | 10,665 (20.8) | 13,135 (22) |
| Other types of radiation | 1 (0.9) | 401 (85.5) | - | - | 1 (0.9) | 264 (0.5) | 307 (0.5) |
| None | 88 (77.2) | - | 202 (76.8) | 7 (87.5) | 88 (77.2) | 40,370 (78.7) | 46,138 (77.4) |
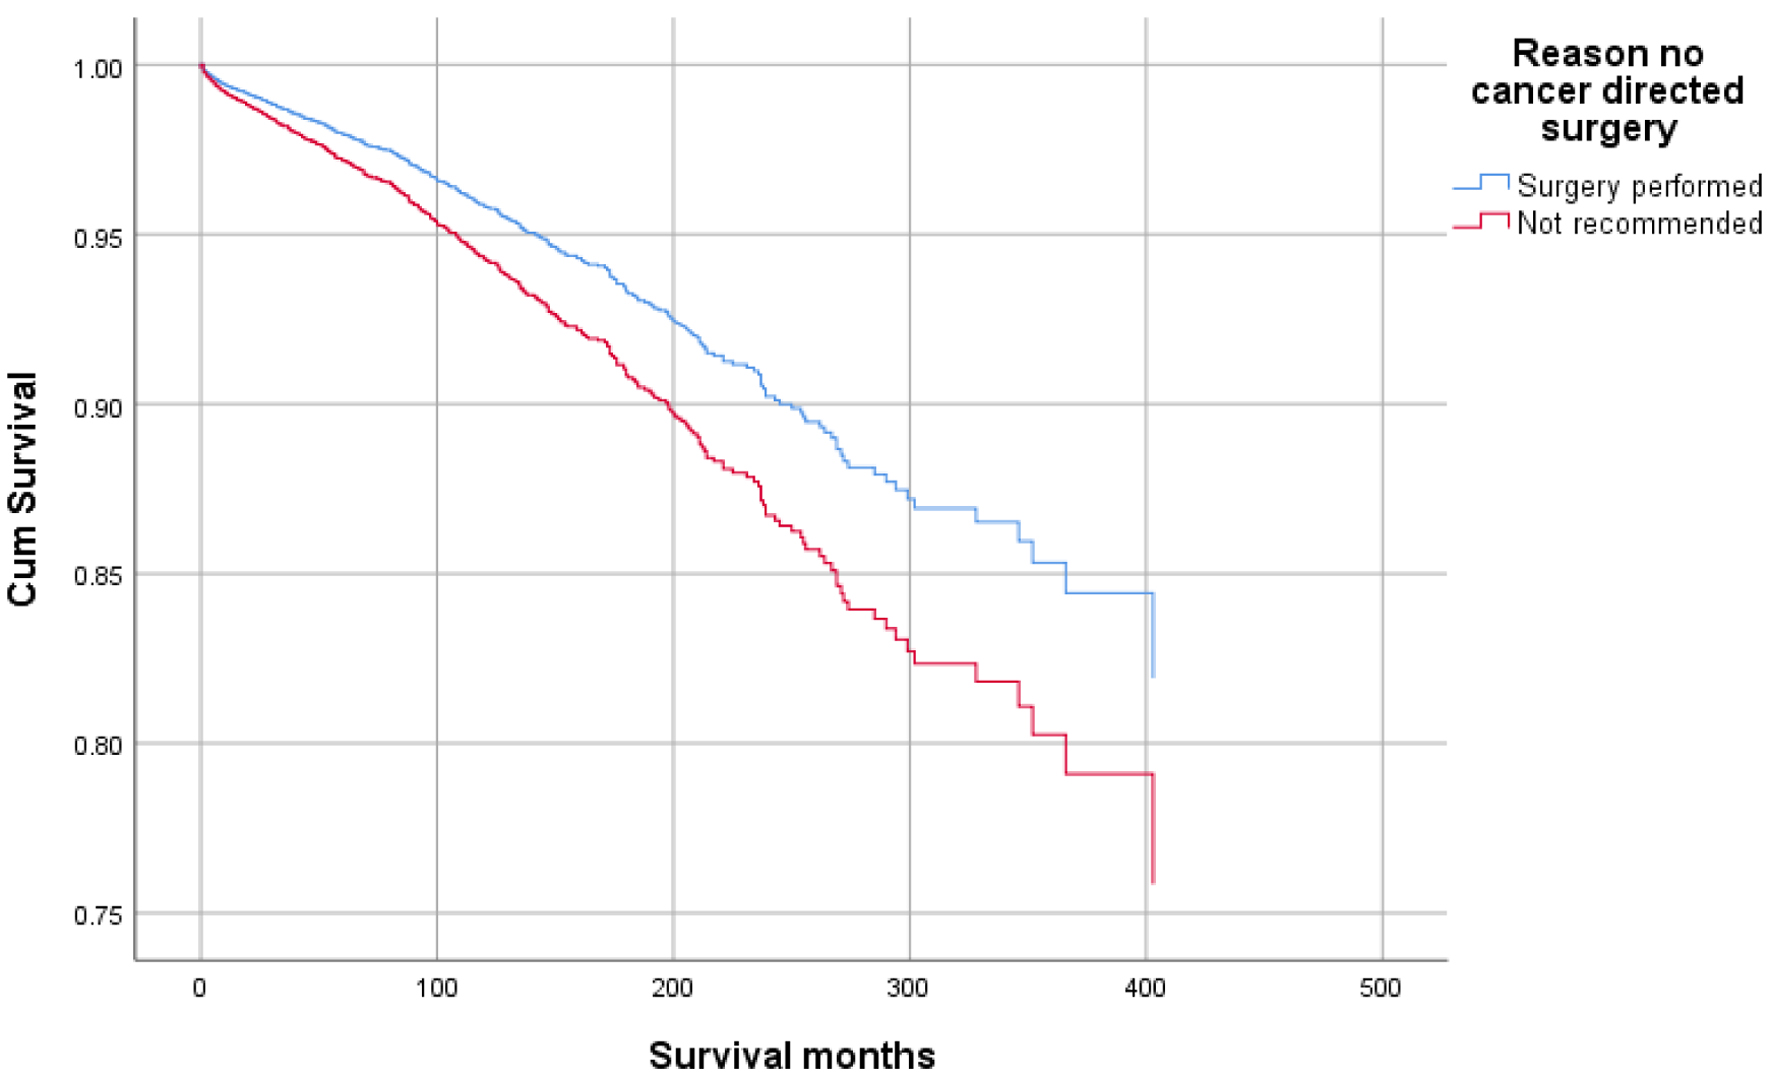
| Surgery | |||||||
| Surgery performed | 80 (70.2) | 392 (83.6) | 197 (74.9) | 6 (75) | 80 (70.2) | 28,462 (55.5) | 35,350 (59.3) |
| Not recommended | 34 (29.8) | 77 (16.4) | 66 (25.1) | 2 (25) | 34 (29.8) | 22,837 (44.5) | 24,230 (40.7) |
| Variables | Infection, mean (95% CI) | P-value | Other, mean (95% CI) | P-value | Total, mean (95% CI) | P-value |
|---|---|---|---|---|---|---|
| CI: confidence interval; NOS: not otherwise specified. | ||||||
| Age | 0.8 | < 0.001 | < 0.001 | |||
| < 49 | 60.452 (32.668 - 88.235) | 83.313 (78.347 - 88.278) | 81.759 (76.883 - 86.635) | |||
| > 50 | 56.75 (51.916 - 61.583) | 44.833 (44.02 - 45.645) | 42.961 (42.204 - 43.719) | |||
| Sex | 0.03 | 0.015 | 0.006 | |||
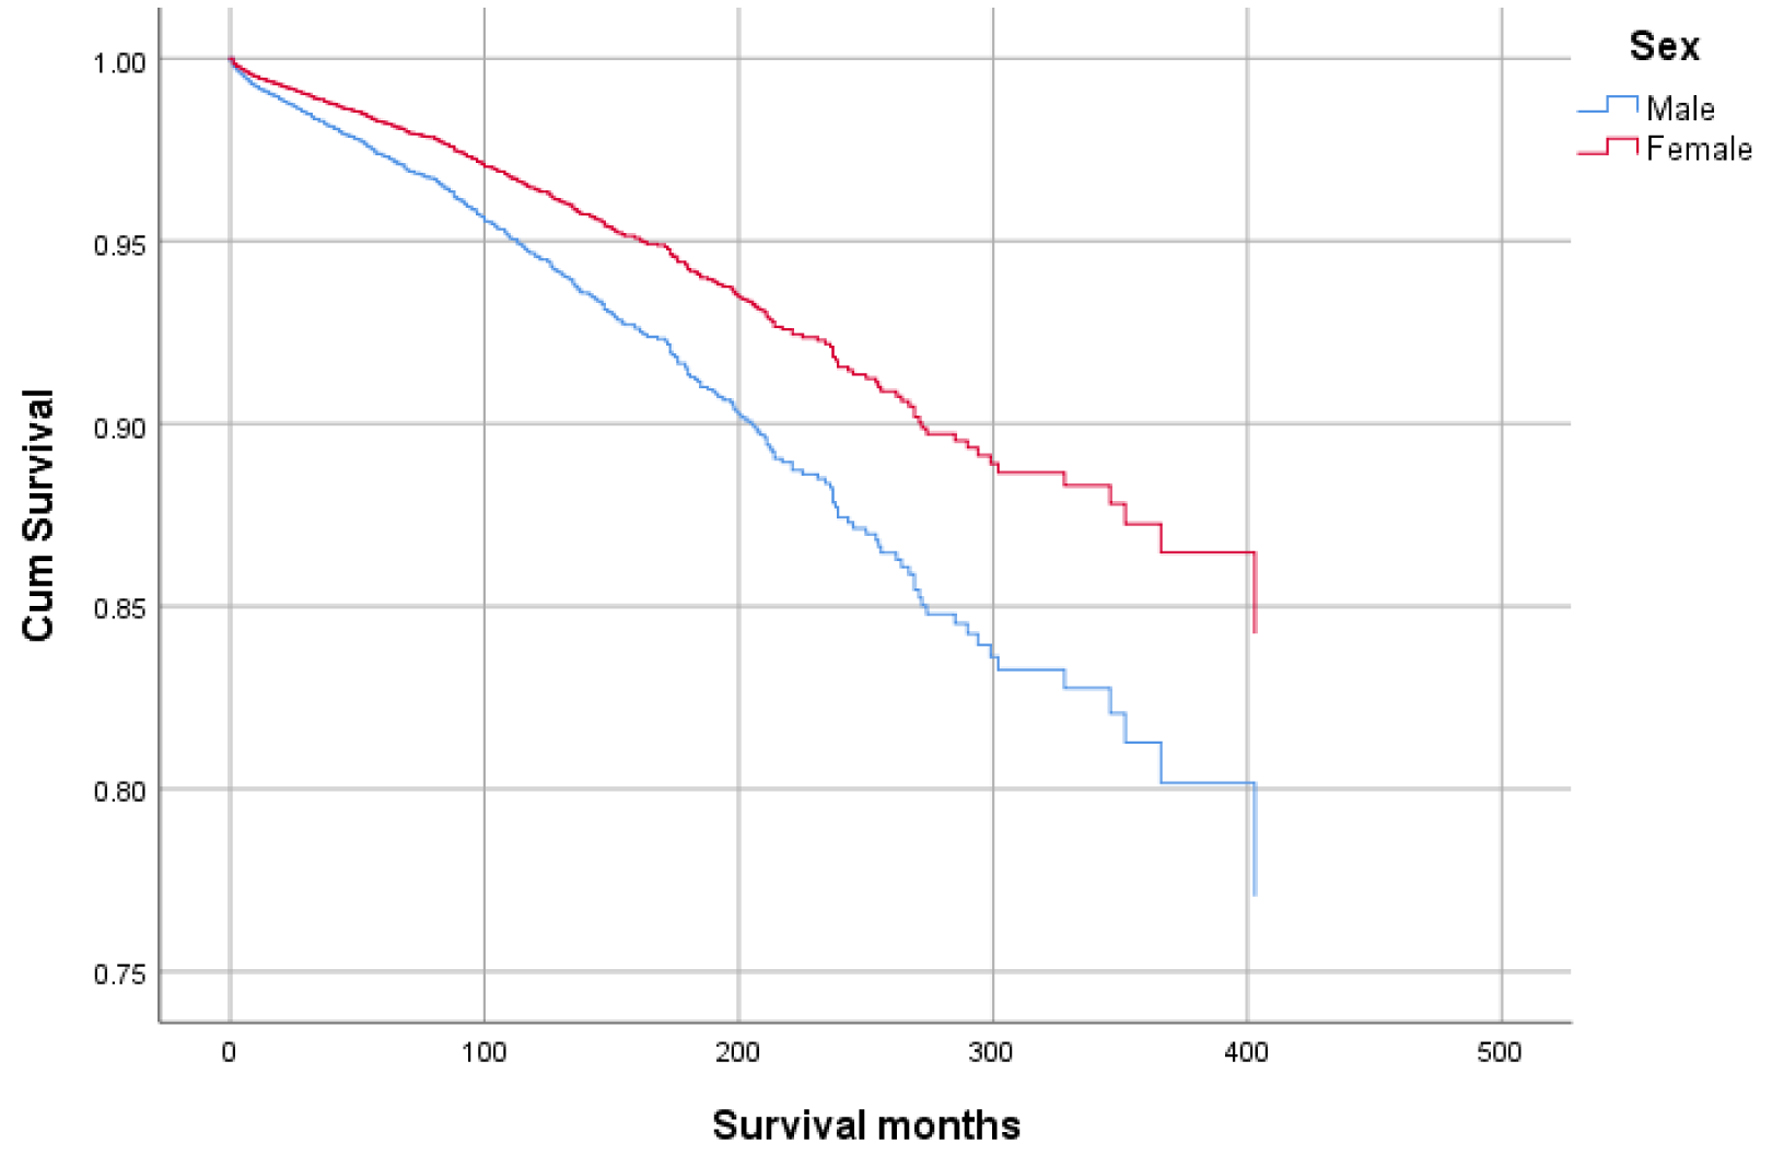
| Male | 53.247 (47.701 - 58.793) | 46.606 (45.546 - 47.667) | 44.591 (43.606 - 45.576) | |||
| Female | 65.239 (56.123 - 74.356) | 51.12 (49.537 - 52.702) | 49.116 (47.625 - 50.607) | |||
| Race | 0.004 | < 0.001 | < 0.001 | |||
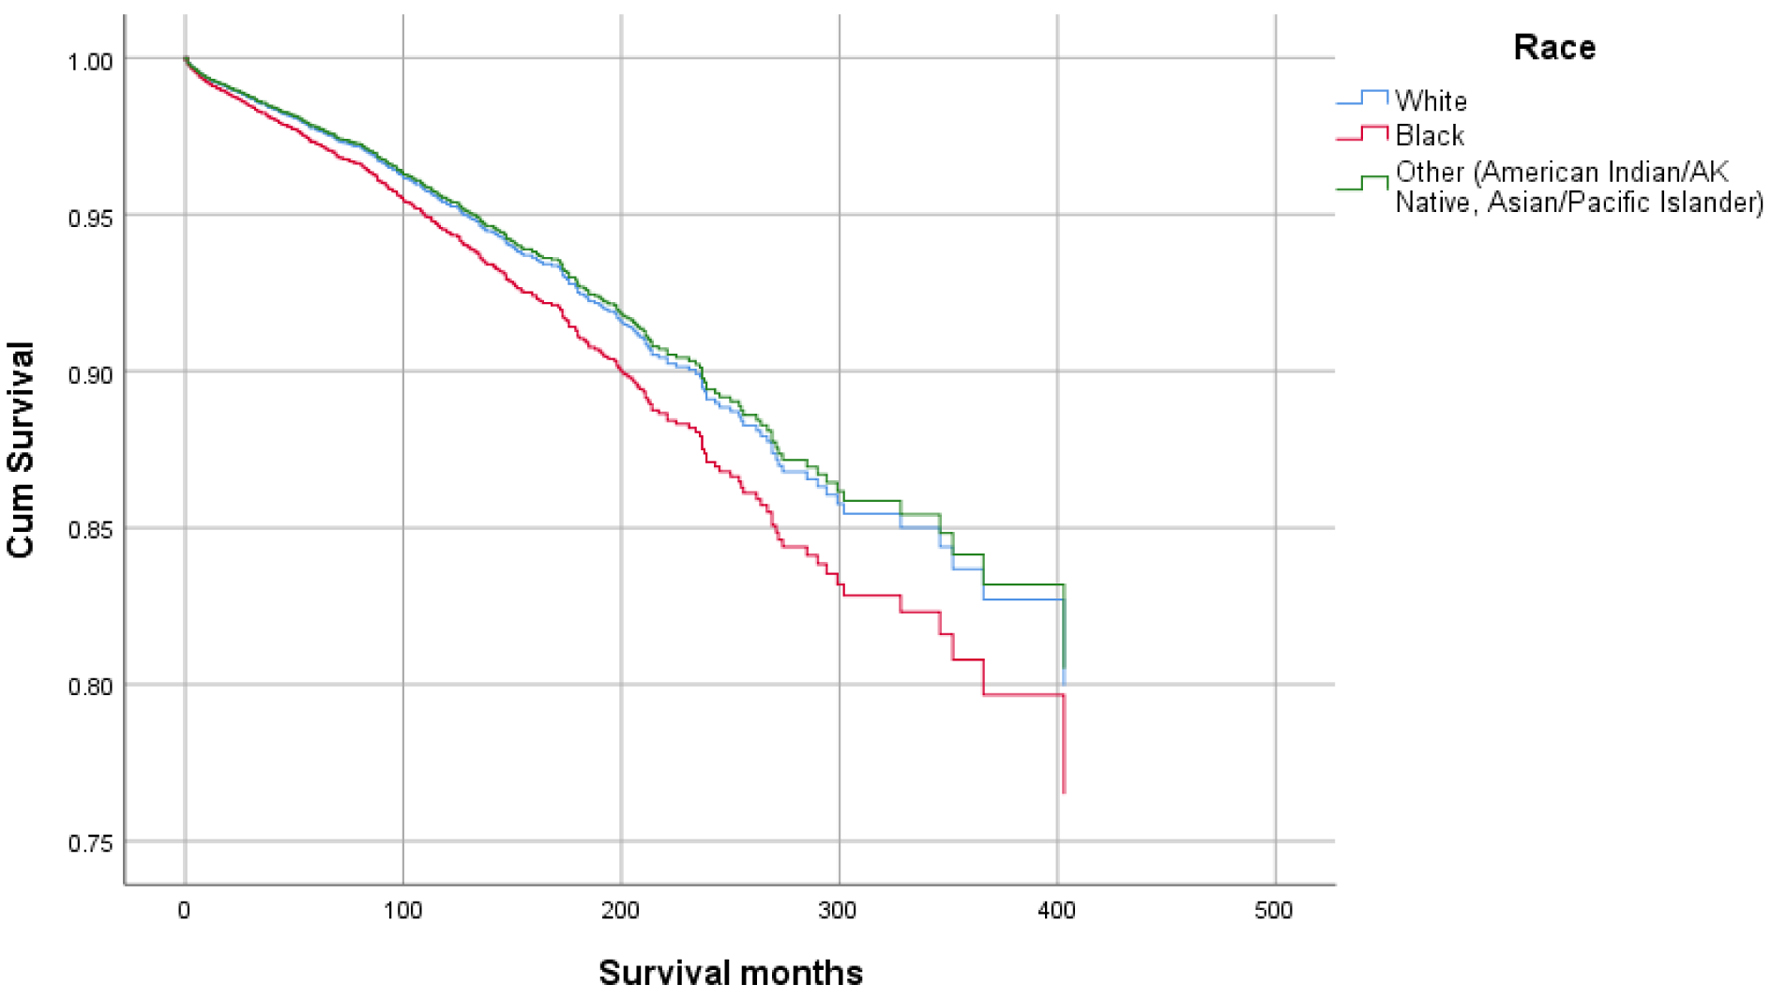
| White | 54.01 (48.549 - 59.47) | 44.975 (44.03 - 45.921) | 43.238 (42.35 - 44.125) | |||
| Black | 47.218 (33.92 - 60.517) | 43.29 (40.908 - 45.673) | 41.3 (39.114 - 43.485) | |||
| Others | 78.916 (65.925 - 91.907) | 72.213 (68.744 - 75.681) | 68.444 (65.234 - 71.653) | |||
| Marital status | < 0.001 | < 0.001 | < 0.001 | |||
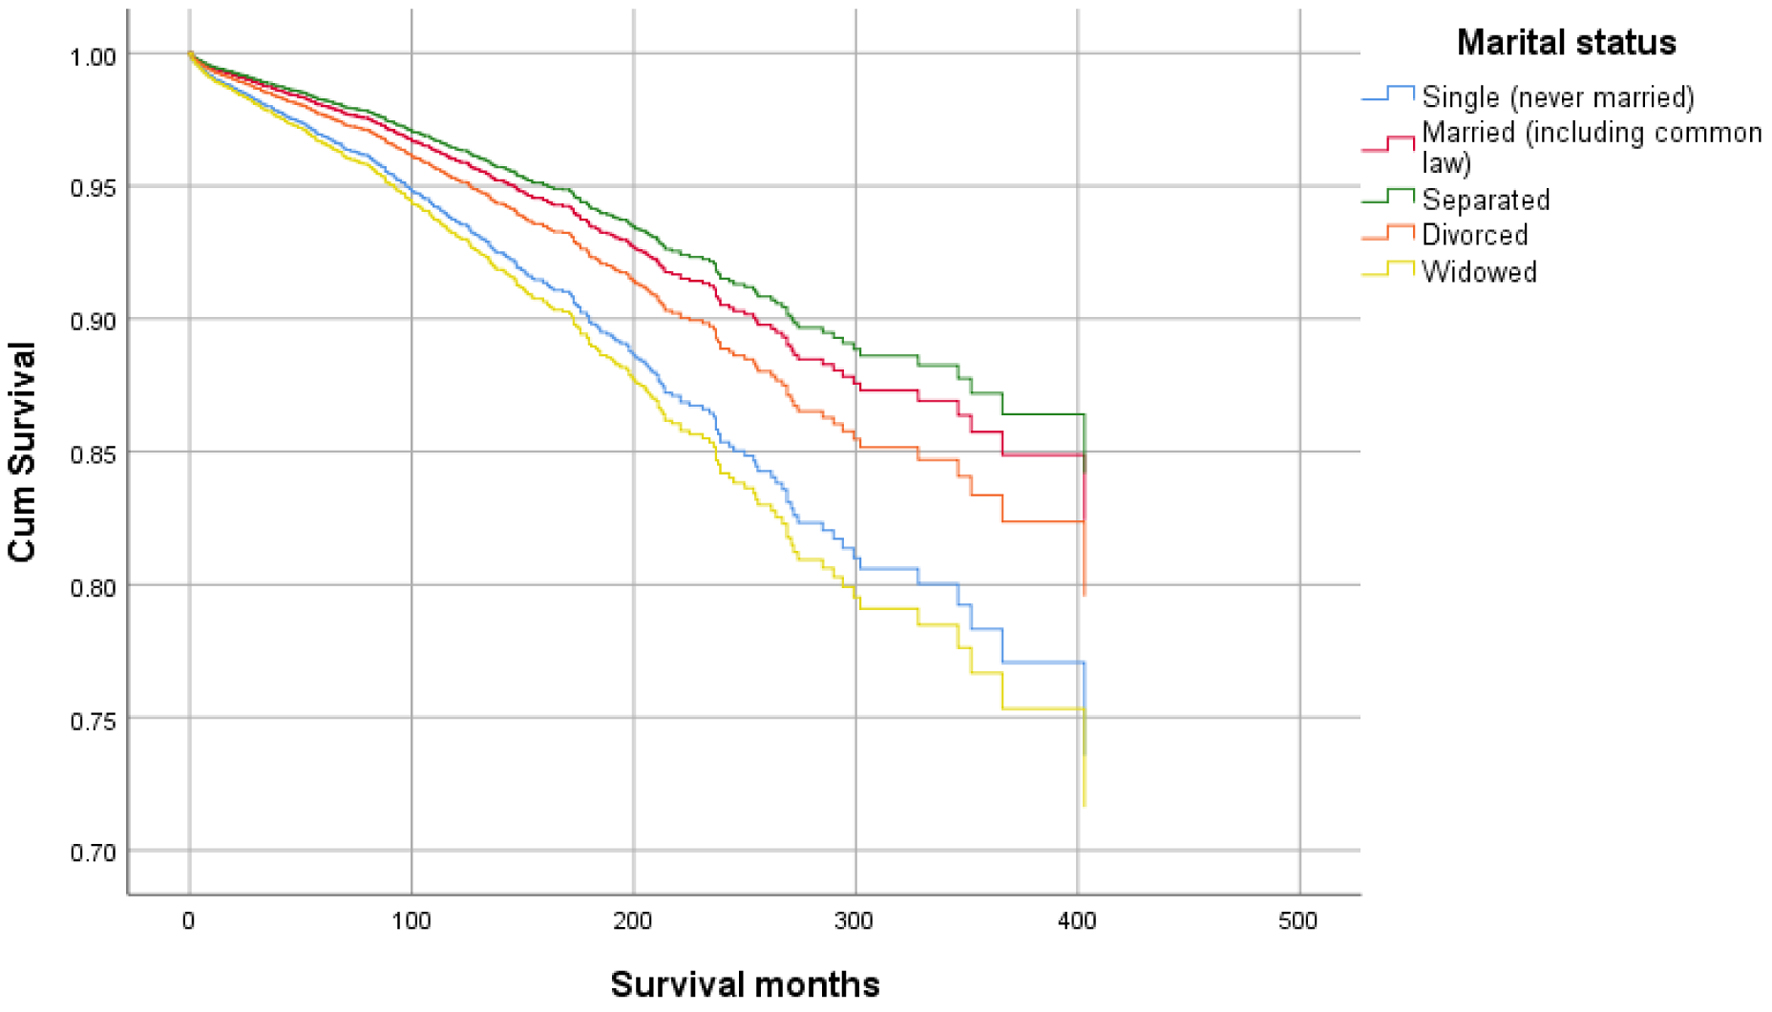
| Single (never married) | 33.288 (23.649 - 42.928) | 45.58 (42.859 - 48.301) | 43.606 (41.035 - 46.176) | |||
| Married (including common law) | 62.79 (56.277 - 69.303) | 54.631 (53.413 - 55.849) | 52.507 (51.36 - 53.654) | |||
| Separated | 96.667 (51.308 - 142.025) | 43.854 (37.585 - 50.123) | 42.165 (36.285 - 48.045) | |||
| Divorced | 50.37 (31.031 - 69.71) | 44.62 (41.197 - 48.044) | 42.798 (39.623 - 45.973) | |||
| Widowed | 54.182 (44.342 - 64.021) | 30.734 (29.528 - 31.94) | 29.369 (28.257 - 30.48) | |||
| Primary site | 0.001 | < 0.001 | < 0.001 | |||
| Stomach, NOS | 52.296 (38.221 - 66.372) | 33.233 (31.341 - 35.124) | 31.757 (29.995 - 33.519) | |||
| Cardia, NOS | 42.39 (35.26 - 49.519) | 45.815 (44.207 - 47.422) | 44.159 (42.654 - 45.664) | |||
| Fundus of stomach | 55.88 (27.061 - 84.699) | 36.822 (32.945 - 40.699) | 35.445 (31.805 - 39.085) | |||
| Body of stomach | 55.328 (38.117 - 72.539) | 45.474 (42.289 - 48.658) | 43.43 (40.47 - 46.39) | |||
| Gastric antrum | 62.492 (52.125 - 72.859) | 54.493 (52.469 - 56.518) | 52.249 (50.351 - 54.146) | |||
| Pylorus | 74.632 (48.34 - 100.923) | 55.917 (51.099 - 60.734) | 53.191 (48.725 - 57.658) | |||
| Lesser curvature of stomach, NOS | 77.886 (64.351 - 91.421) | 65.8 (62.771 - 68.829) | 62.473 (59.658 - 65.287) | |||
| Greater curvature of stomach, NOS | 53.487 (32.172 - 74.803) | 54.983 (50.669 - 59.297) | 53.06 (48.942 - 57.178) | |||
| Stage | < 0.001 | < 0.001 | < 0.001 | |||
| Localized | 76.282 (68.403 - 84.161) | 99.719 (97.222 - 102.216) | 95.154 (92.828 - 97.481) | |||
| Regional | 59.83 (51.542 - 68.118) | 52.013 (50.519 - 53.506) | 50.024 (48.627 - 51.422) | |||
| Distant | 15.137 (10.058 - 20.217) | 13.752 (13.02 - 14.483) | 13.434 (12.739 - 14.128) | |||
| Unstaged | 23.901 (13.549 - 34.253) | 23.683 (21.724 - 25.641) | 22.556 (20.73 - 24.382) | |||
| Chemotherapy | 0.002 | < 0.001 | < 0.001 | |||
| Yes | 61.602 (55.779 - 67.425) | 48.408 (47.345 - 49.47) | 46.153 (45.163 - 47.143) | |||
| No/unknown | 42.231 (35.135 - 49.326) | 48.691 (46.87 - 50.512) | 47.178 (45.454 - 48.902) | |||
| Radiation | 0.18 | < 0.001 | < 0.001 | |||
| Beam radiation | 44 (44 - 44) | 35.806 (29.182 - 42.429) | 35.452 (28.907 - 41.997) | |||
| Other types of radiation | 59.473 (53.991 - 64.954) | 46.356 (45.403 - 47.308) | 44.343 (43.452 - 45.234) | |||
| None | 45.31 (36.608 - 54.011) | 53.25 (51.09 - 55.409) | 51.446 (49.42 - 53.473) | |||
| Surgery | < 0.001 | < 0.001 | < 0.001 | |||
| Surgery performed | 68.252 (62.638 - 73.866) | 71.184 (69.843 - 72.525) | 68.191 (66.938 - 69.444) | |||
| Not recommended | 14.017 (9.726 - 18.307) | 13.114 (12.454 - 13.774) | 12.719 (12.103 - 13.334) | |||
| Variables | Infection, HR (95% CI) | Regression coefficient | Other, HR (95% CI) | Regression coefficient | Total, HR (95% CI) | Regression coefficient |
|---|---|---|---|---|---|---|
| *P < 0.01. **P < 0.001. CI: confidence interval; HR: hazard ratio; NOS: not otherwise specified. | ||||||
| Age, reference (< 49) | ||||||
| > 50 | 3.137 (2.178 - 4.517)** | 1.143 | 1.285 (1.242 - 1.329)** | 0.251 | 1.299 (1.256 - 1.344)** | 0.262 |
| Sex, reference (male) | ||||||
| Female | 0.658 (0.561 - 0.773)** | -0.418 | 0.886 (0.869 - 0.905)** | -0.121 | 0.882 (0.865 - 0.9)** | -0.125 |
| Race, reference (white) | ||||||
| Black | 1.202 (0.979 - 1.474) | 0.184 | 0.993 (0.966 - 1.02) | -0.007 | 0.995 (0.969 - 1.023) | -0.005 |
| Other | 0.968 (0.795 - 1.177) | -0.033 | 0.81 (0.788 - 0.833)** | -0.211 | 0.813 (0.791 - 0.836)** | -0.207 |
| Marital status, reference (single) | ||||||
| Married | 0.627 (0.506 - 0.778)** | -0.466 | 0.927 (0.9 - 0.954)** | -0.076 | 0.921 (0.895 - 0.948)** | -0.082 |
| Separated | 0.564 (0.285 - 1.119) | -0.572 | 0.997 (0.922 - 1.078) | -0.003 | 0.987 (0.914 - 1.067) | -0.013 |
| Divorced | 0.742 (0.533 - 1.032) | -0.299 | 1.026 (0.984 - 1.07) | 0.026 | 1.021 (0.979 - 1.064) | 0.02 |
| Widowed | 1.079 (0.841 - 1.386) | 0.076 | 1.202 (1.162 - 1.244)** | 0.184 | 1.2 (1.16 - 1.241)** | 0.182 |
| Primary site, reference (stomach, NOS) | ||||||
| Cardia, NOS | 0.898 (0.71 - 1.137) | -0.107 | 0.881 (0.857 - 0.906)** | -0.127 | 0.881 (0.857 - 0.906)** | -0.126 |
| Fundus of stomach | 0.831 (0.537 - 1.285) | -0.185 | 0.993 (0.947 - 1.042) | -0.007 | 0.991 (0.945 - 1.039) | -0.009 |
| Body of stomach | 1.047 (0.767 - 1.429) | 0.046 | 0.93 (0.894 - 0.968)** | -0.072 | 0.932 (0.896 - 0.969)** | -0.07 |
| Gastric antrum | 0.923 (0.725 - 1.175) | -0.08 | 0.897 (0.87 - 0.925)** | -0.109 | 0.897 (0.87 - 0.925)** | -0.109 |
| Pylorus | 0.961 (0.662 - 1.394) | -0.04 | 0.907 (0.862 - 0.954)** | -0.097 | 0.908 (0.863 - 0.955)** | -0.097 |
| Lesser curvature of stomach, NOS | 1.087 (0.839 - 1.409) | 0.083 | 0.81 (0.781 - 0.84)** | -0.211 | 0.815 (0.786 - 0.845)** | -0.205 |
| Greater curvature of stomach, NOS | 0.904 (0.625 - 1.308) | -0.101 | 0.896 (0.854 - 0.941)** | -0.109 | 0.896 (0.854 - 0.94)** | -0.11 |
| Stage, reference (localized) | ||||||
| Regional | 1.121 (0.952 - 1.32) | 0.114 | 2.085 (2.032 - 2.139)** | 0.735 | 2.054 (2.003 - 2.106)** | 0.72 |
| Distant | 1.217 (0.957 - 1.549) | 0.196 | 3.554 (3.453 - 3.657)** | 1.268 | 3.492 (3.394 - 3.592)** | 1.25 |
| Unstaged | 1.699 (1.278 - 2.258)** | 0.53 | 1.837 (1.766 - 1.912)** | 0.608 | 1.825 (1.755 - 1.898)** | 0.601 |
| Chemotherapy, reference (yes) | ||||||
| No/unknown | 1.669 (1.356 - 2.056)** | 0.512 | 1.76 (1.72 - 1.8)** | 0.565 | 1.756 (1.717 - 1.796)** | 0.563 |
| Radiation, reference (beam) | ||||||
| Other types of radiation | 0.285 (0.04 - 2.038) | -1.255 | 1.085 (0.96 - 1.225) | 0.081 | 1.074 (0.95 - 1.213) | 0.071 |
| None | 0.892 (0.715 - 1.113) | -0.114 | 1.057 (1.031 - 1.083)** | 0.055 | 1.055 (1.03 - 1.081)** | 0.054 |
| Surgery, reference (yes) | ||||||
| Not recommended | 1.412 (1.132 - 1.761)* | 0.345 | 2.728 (2.661 - 2.796)** | 1.003 | 2.705 (2.639 - 2.773)** | 0.995 |
| Variables | Infection, OR (95% CI) | Regression coefficient |
|---|---|---|
| *P < 0.05. **P < 0.01. ***P < 0.001. CI: confidence interval; OR: odds ratio; NOS: not otherwise specified. | ||
| Age, reference (< 49) | ||
| > 50 | 2.094 (1.453 - 3.018)*** | 0.739 |
| Sex, reference (male) | ||
| Female | 0.789 (0.671 - 0.928)** | -0.237 |
| Race, reference (white) | ||
| Black | 1.212 (0.985 - 1.49) | 0.192 |
| Other | 1.226 (1.006 - 1.494)* | 0.204 |
| Marital status, reference (single) | ||
| Married | 0.715 (0.574 - 0.89)** | -0.335 |
| Separated | 0.545 (0.273 - 1.086) | -0.607 |
| Divorced | 0.75 (0.538 - 1.047) | -0.287 |
| Widowed | 0.874 (0.679 - 1.125) | -0.134 |
| Primary site, reference (stomach, NOS) | ||
| Cardia, NOS | 0.903 (0.713 - 1.144) | -0.102 |
| Fundus of stomach | 0.796 (0.513 - 1.236) | -0.228 |
| Body of stomach | 1.128 (0.824 - 1.545) | 0.121 |
| Gastric antrum | 1.002 (0.786 - 1.277) | 0.002 |
| Pylorus | 1.04 (0.713 - 1.515) | 0.039 |
| Lesser curvature of stomach, NOS | 1.325 (1.02 - 1.721)* | 0.282 |
| Greater curvature of stomach, NOS | 1.026 (0.707 - 1.488) | 0.025 |
| Stage, reference (localized) | ||
| Regional | 0.561 (0.478 - 0.66)*** | -0.577 |
| Distant | 0.354 (0.284 - 0.442)*** | -1.039 |
| Unstaged | 0.95 (0.716 - 1.261) | -0.051 |
| Chemotherapy, reference (yes) | ||
| No/unknown | 1.258 (1.029 - 1.538)* | 0.23 |
| Radiation, reference (beam) | ||
| Other types of radiation | 0.259 (0.036 - 1.86) | -1.351 |
| None | 0.844 (0.677 - 1.054) | -0.169 |
| Surgery, reference (yes) | ||
| Not recommended | 0.549 (0.447 - 0.673)*** | -0.601 |