Figures
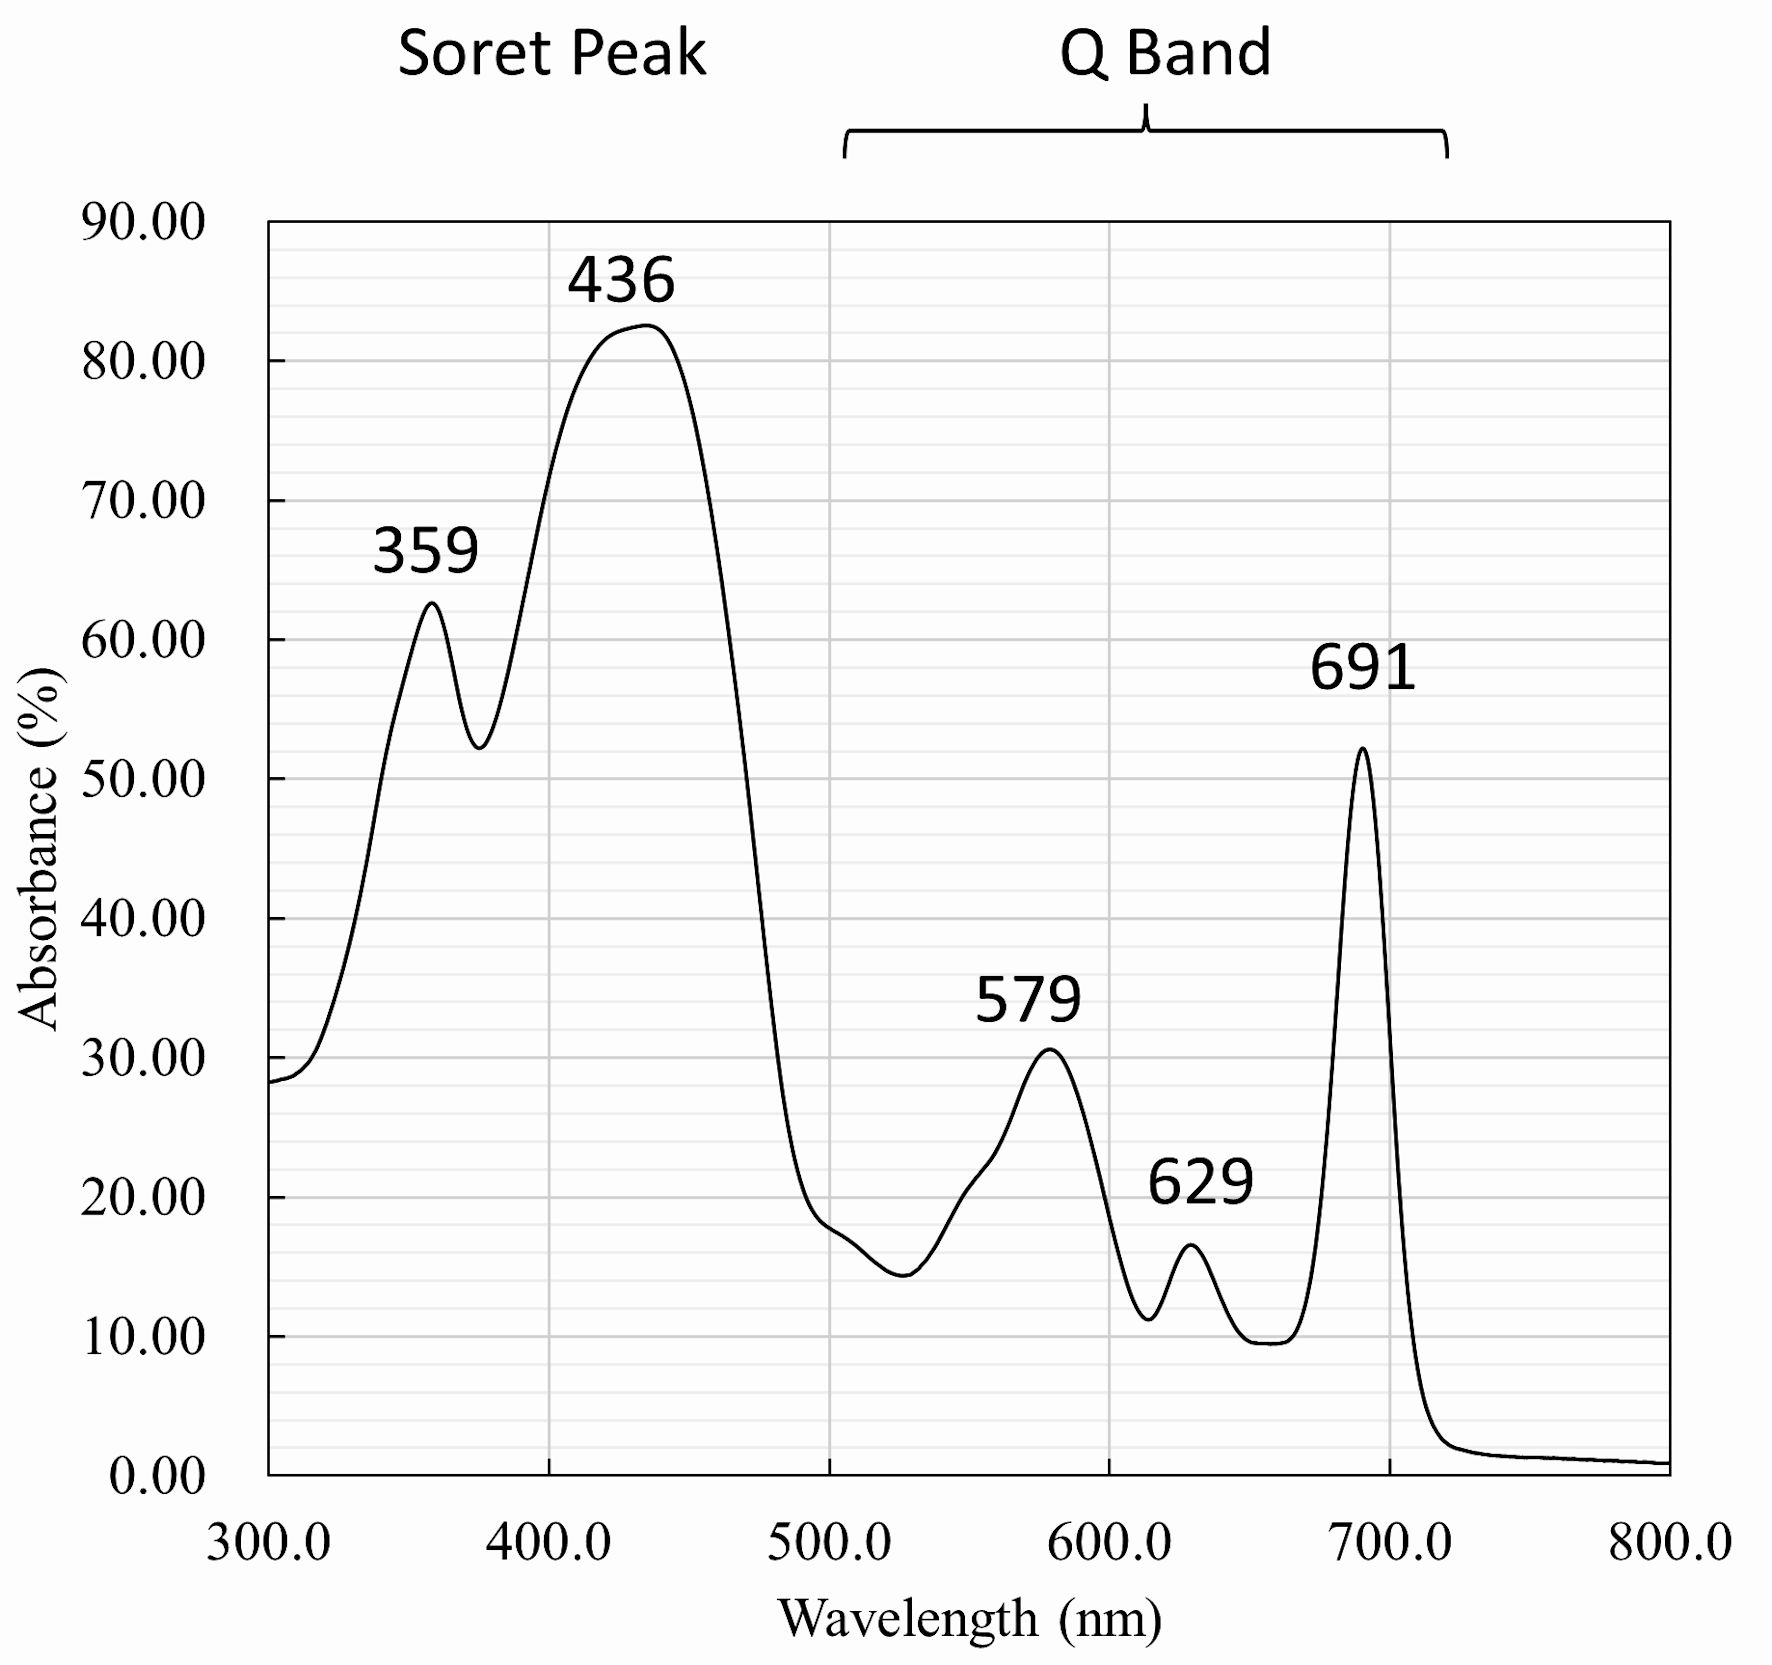
Figure 1. Spectrometry of verteporfin. The spectrum shows a prominent absorption peak at 436 nm, which is known as the Soret peak. Additionally, there are smaller peaks at 579, 629, and 691 nm, which are known as the Q band.

Figure 2. Cell viability assay for esophageal cancer cells. Cell viability was evaluated after staining with crystal violet. (a) KYSE30 and (b) KYSE70 significantly inhibited cell growth at 0.8 µM (KYSE30: -18.7%, P < 0.01; KYSE70: -33.6%, P < 0.01) and 3.2 µM (KYSE30: -47.7%, P < 0.01; KYSE70: -63.4%, P < 0.01) concentrations of VP under NBI light (5 J/cm2). (c) KYSE170 also demonstrated significant suppression at 0.4 µM (-32.2%, P < 0.05) and 1.6 µM (-59.9%, P < 0.05) concentrations of VP under NBI light (5 J/cm2). *P < 0.05. **P < 0.01. NBI: narrow-band imaging; VP: verteporfin.

Figure 3. Cell viability assay for biliary cancer cells. Cell viability was evaluated after staining with crystal violet. (a) HuCCT-1 showed marked growth inhibition at 1 µM VP (-65.8%, P < 0.01) under NBI light (5 J/cm2). (b) KKU-213 similarly exhibited significant growth inhibition at 0.4 µM (-67.8%, P < 0.05) under NBI light (5 J/cm2). *P < 0.05. **P < 0.01. NBI: narrow-band imaging; VP: verteporfin.
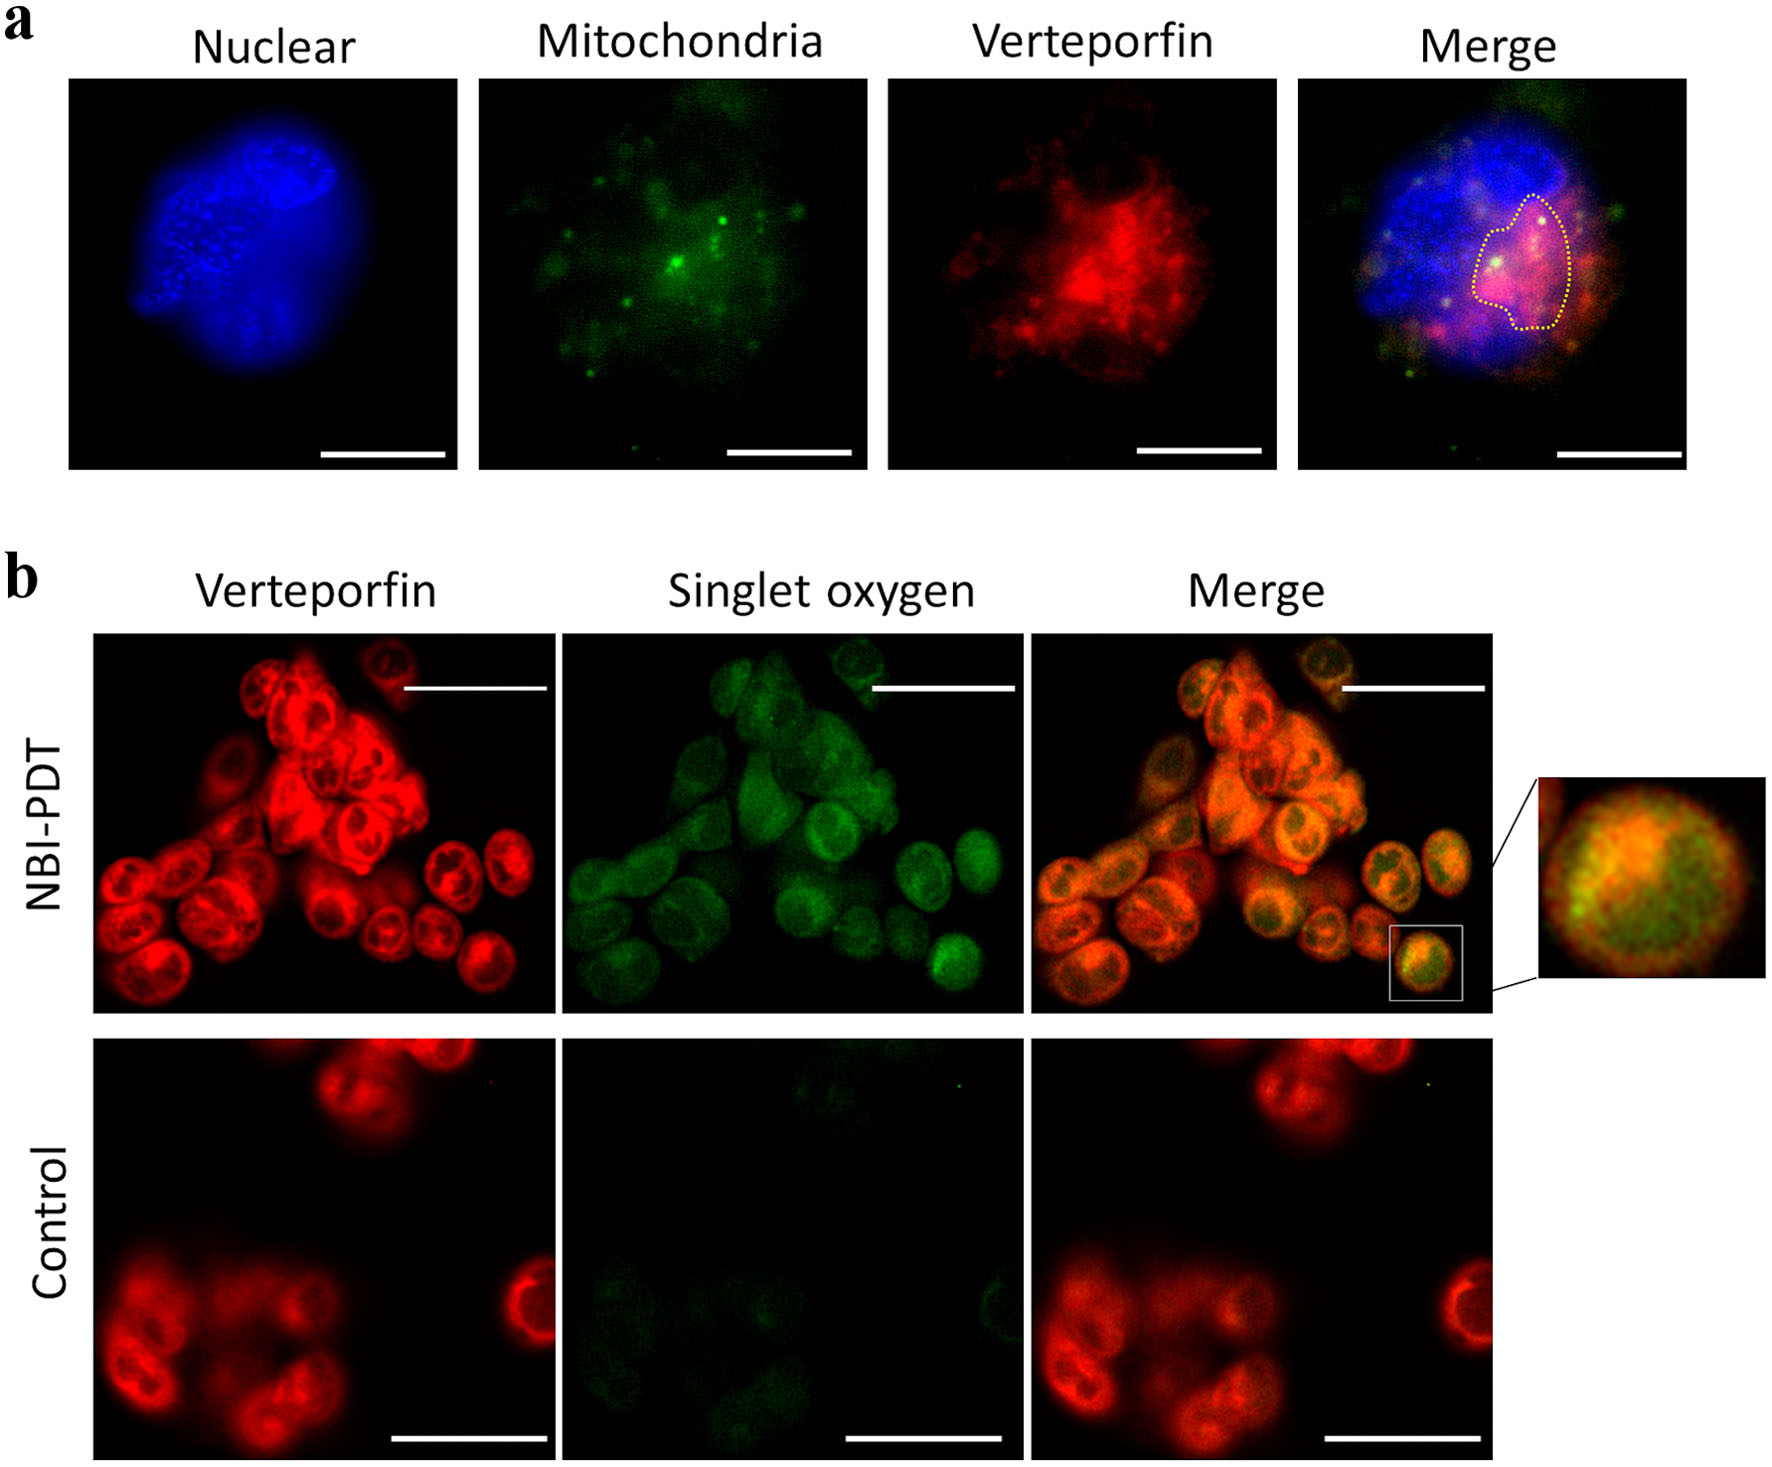
Figure 4. Fluorescein images. (a) Consistency of mitochondria and verteporfin (VP) accumulation. Each image demonstrates nuclear staining, mitochondrial staining (MitoBright Green 0.1 µM for 10 min), VP (0.1 µM for 15 min), and a merged image of mitochondrial staining and VP accumulation. The accumulation of VP consistent with mitochondria is indicated by dotted lines. Original magnification × 100, scale bar = 10 µm. (b) Singlet oxygen induced by NBI-PDT. Each image demonstrates singlet oxygen (Single Oxygen Sensor 50 µM for 60 min), VP, and a merged image of singlet oxygen and VP for both the NBI-PDT and control groups. Singlet oxygen was induced only by NBI-PDT. The accumulation of VP is consistent with singlet oxygen. NBI was irradiated at 5 J/cm2 (original magnification × 40, scale bar = 50 µm). NBI: narrow-band imaging; PDT: photodynamic therapy.
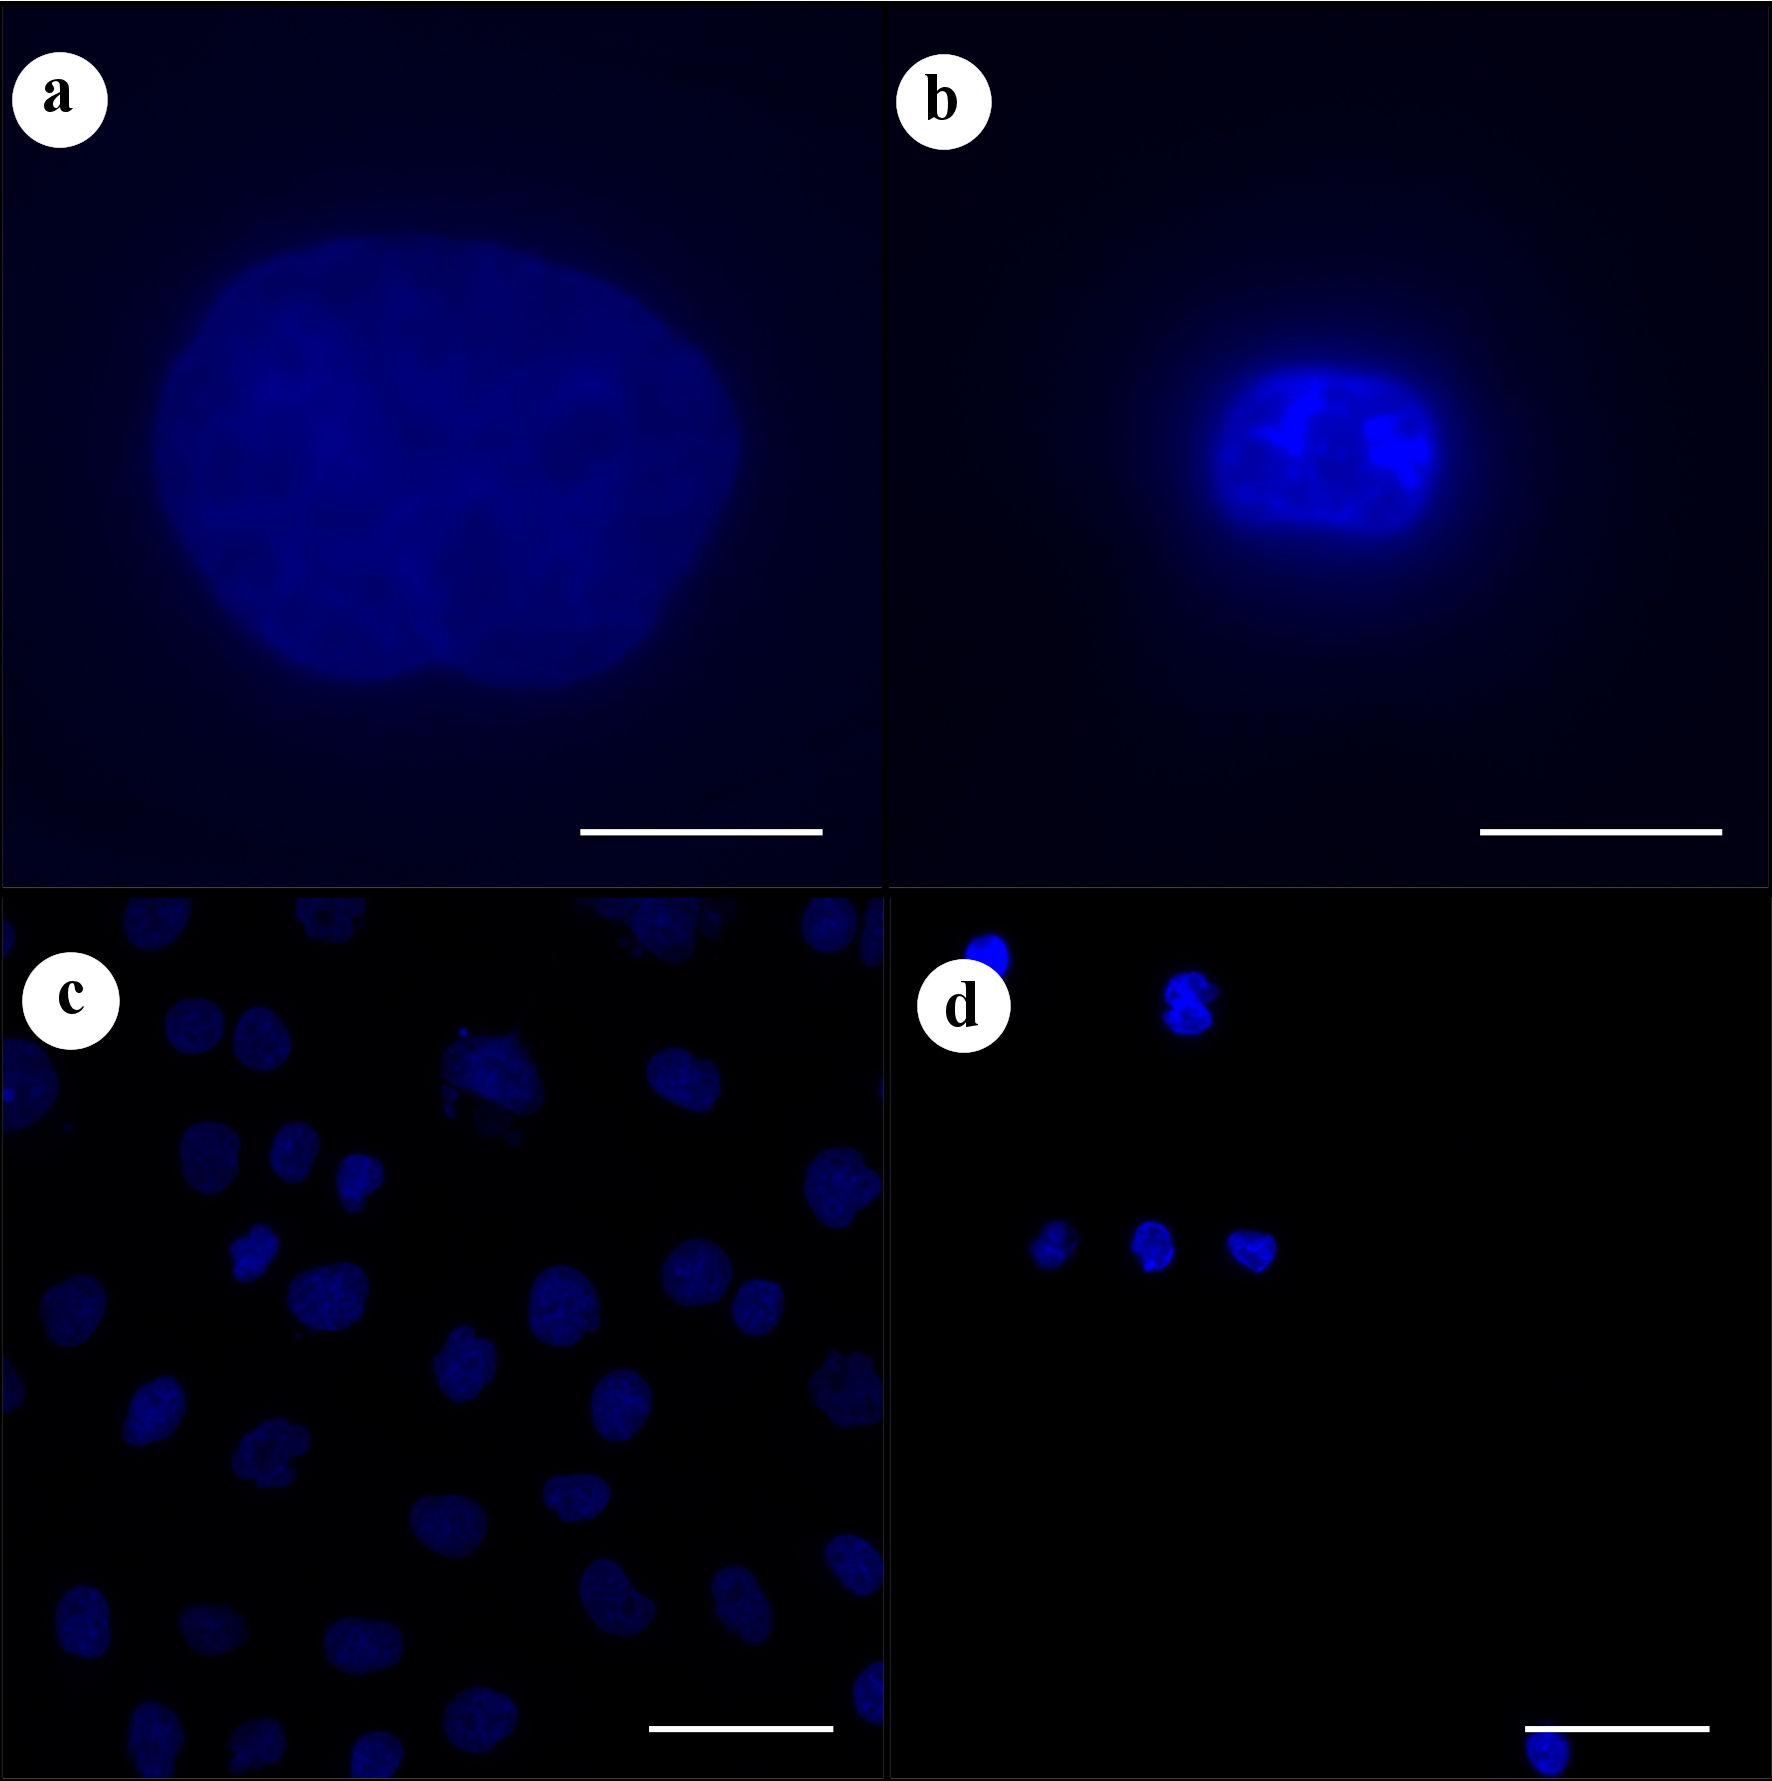
Figure 5. Hoechst staining assessing apoptosis. (a) Control. (b) NBI-PDT. (c) Control. (d) NBI-PDT. Hoechst staining revealed apoptotic changes in cell nuclei under NBI light (5 J/cm2). Original magnification × 100 with a scale bar of 10 µm for (a) and (b), and original magnification × 20 with a scale bar of 50 µm for (c) and (d). NBI: narrow-band imaging; PDT: photodynamic therapy.