Gastroenterology Research, ISSN 1918-2805 print, 1918-2813 online, Open Access
Article copyright, the authors; Journal compilation copyright, Gastroenterol Res and Elmer Press Inc
Journal website https://www.gastrores.org

Original Article

Volume 17, Number 2, April 2024, pages 82-89


A Comprehensive Study on the Diagnostic Value of Multi-Slice Computed Tomography for Peripancreatic Infection in Elderly With Severe Acute Pancreatitis

Figures

Figure 1.
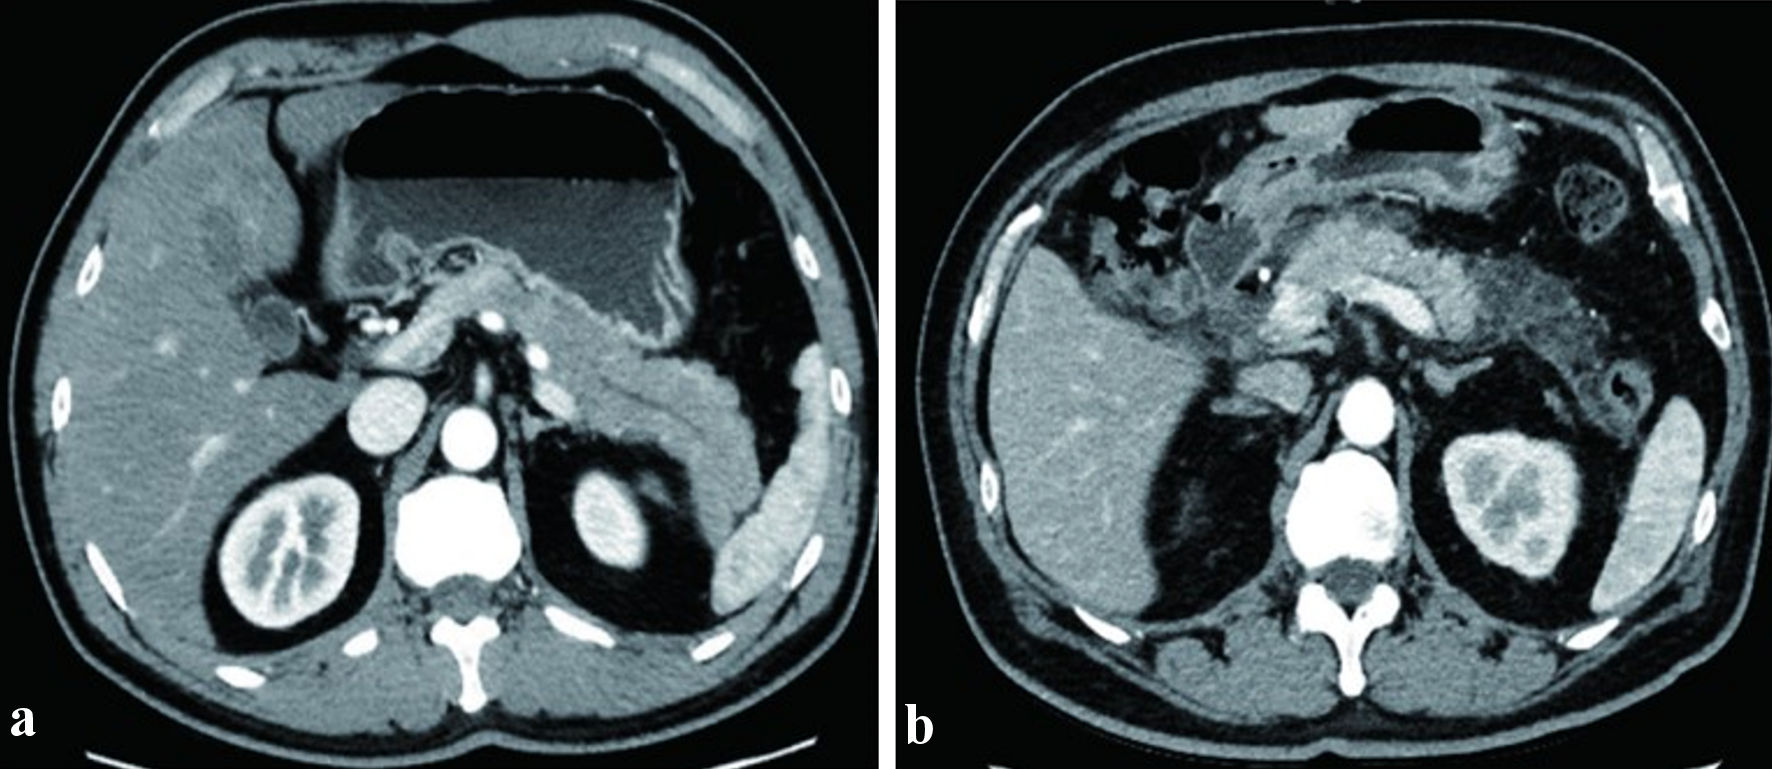
Figure 1. Representative MSCT perfusion imaging of elderly SAP patients. (a) MSCT perfusion imaging of a 67-year-old male SAP patient without peripancreatic infection. (b) MSCT perfusion imaging of a 65-year-old male SAP patient with concurrent peripancreatic infection. SAP: severe acute pancreatitis; MSCT: multi-slice spiral computed tomography.
Figure 2.
Figure 2. ROC curves for evaluating the risk of peripancreatic infection in elderly SAP patients using MSCT perfusion imaging parameters. SAP: severe acute pancreatitis; MSCT: multi-slice spiral computed tomography; ROC: receiver operating characteristic.
Figure 3.
Figure 3. Efficacy of predicting the risk of peripancreatic infection in elderly patients with severe acute pancreatitis using MSCT perfusion imaging. MSCT: multi-slice spiral computed tomography; AUC: area under the curve.

Tables

Table 1. Comparison of MSCT Perfusion Imaging Parameters Between Elderly SAP Patients with and Without Peripancreatic Infection
 
Peripancreatic infectionPeak time (s)Peak height (HU)Blood flow (mL/g/min)
HU: Hounsfield units; SAP: severe acute pancreatitis; MSCT: multi-slice spiral computed tomography.
With (n = 23)25.75 ± 4.0155.69 ± 10.25810.73 ± 95.66
Without (n = 87)23.05 ± 3.9867.85 ± 11.321085.69 ± 128.95
t2.8894.6689.542
P0.005< 0.001< 0.001


Table 2. Evaluation of the Efficacy of Predicting the Risk of Peripancreatic Infection in Elderly SAP Patients Using Time to Peak, Peak Height, and Blood Flow Volume, Either Individually or in Combination, From MSCT Perfusion Imaging
 
Parameter (cut-off value)Sensitivity (%)Specificity (%)AUC95%CI
HU: Hounsfield units; SAP: severe acute pancreatitis; MSCT: multi-slice spiral computed tomography; AUC: area under the curve; CI: confidence interval.
Peak time (24.15 s)82.61 (19/23)74.71 (65/87)0.8040.717 - 0.873
Peak height (62.03 HU)78.26 (18/23)77.01 (67/87)0.7870.698 - 0.859
Blood flow (916.82 mL/g/min)86.96 (20/23)72.41 (63/87)0.7190.625 - 0.801
Combined78.26 (18/23)100.00 (87/87)0.8130.727 - 0.881