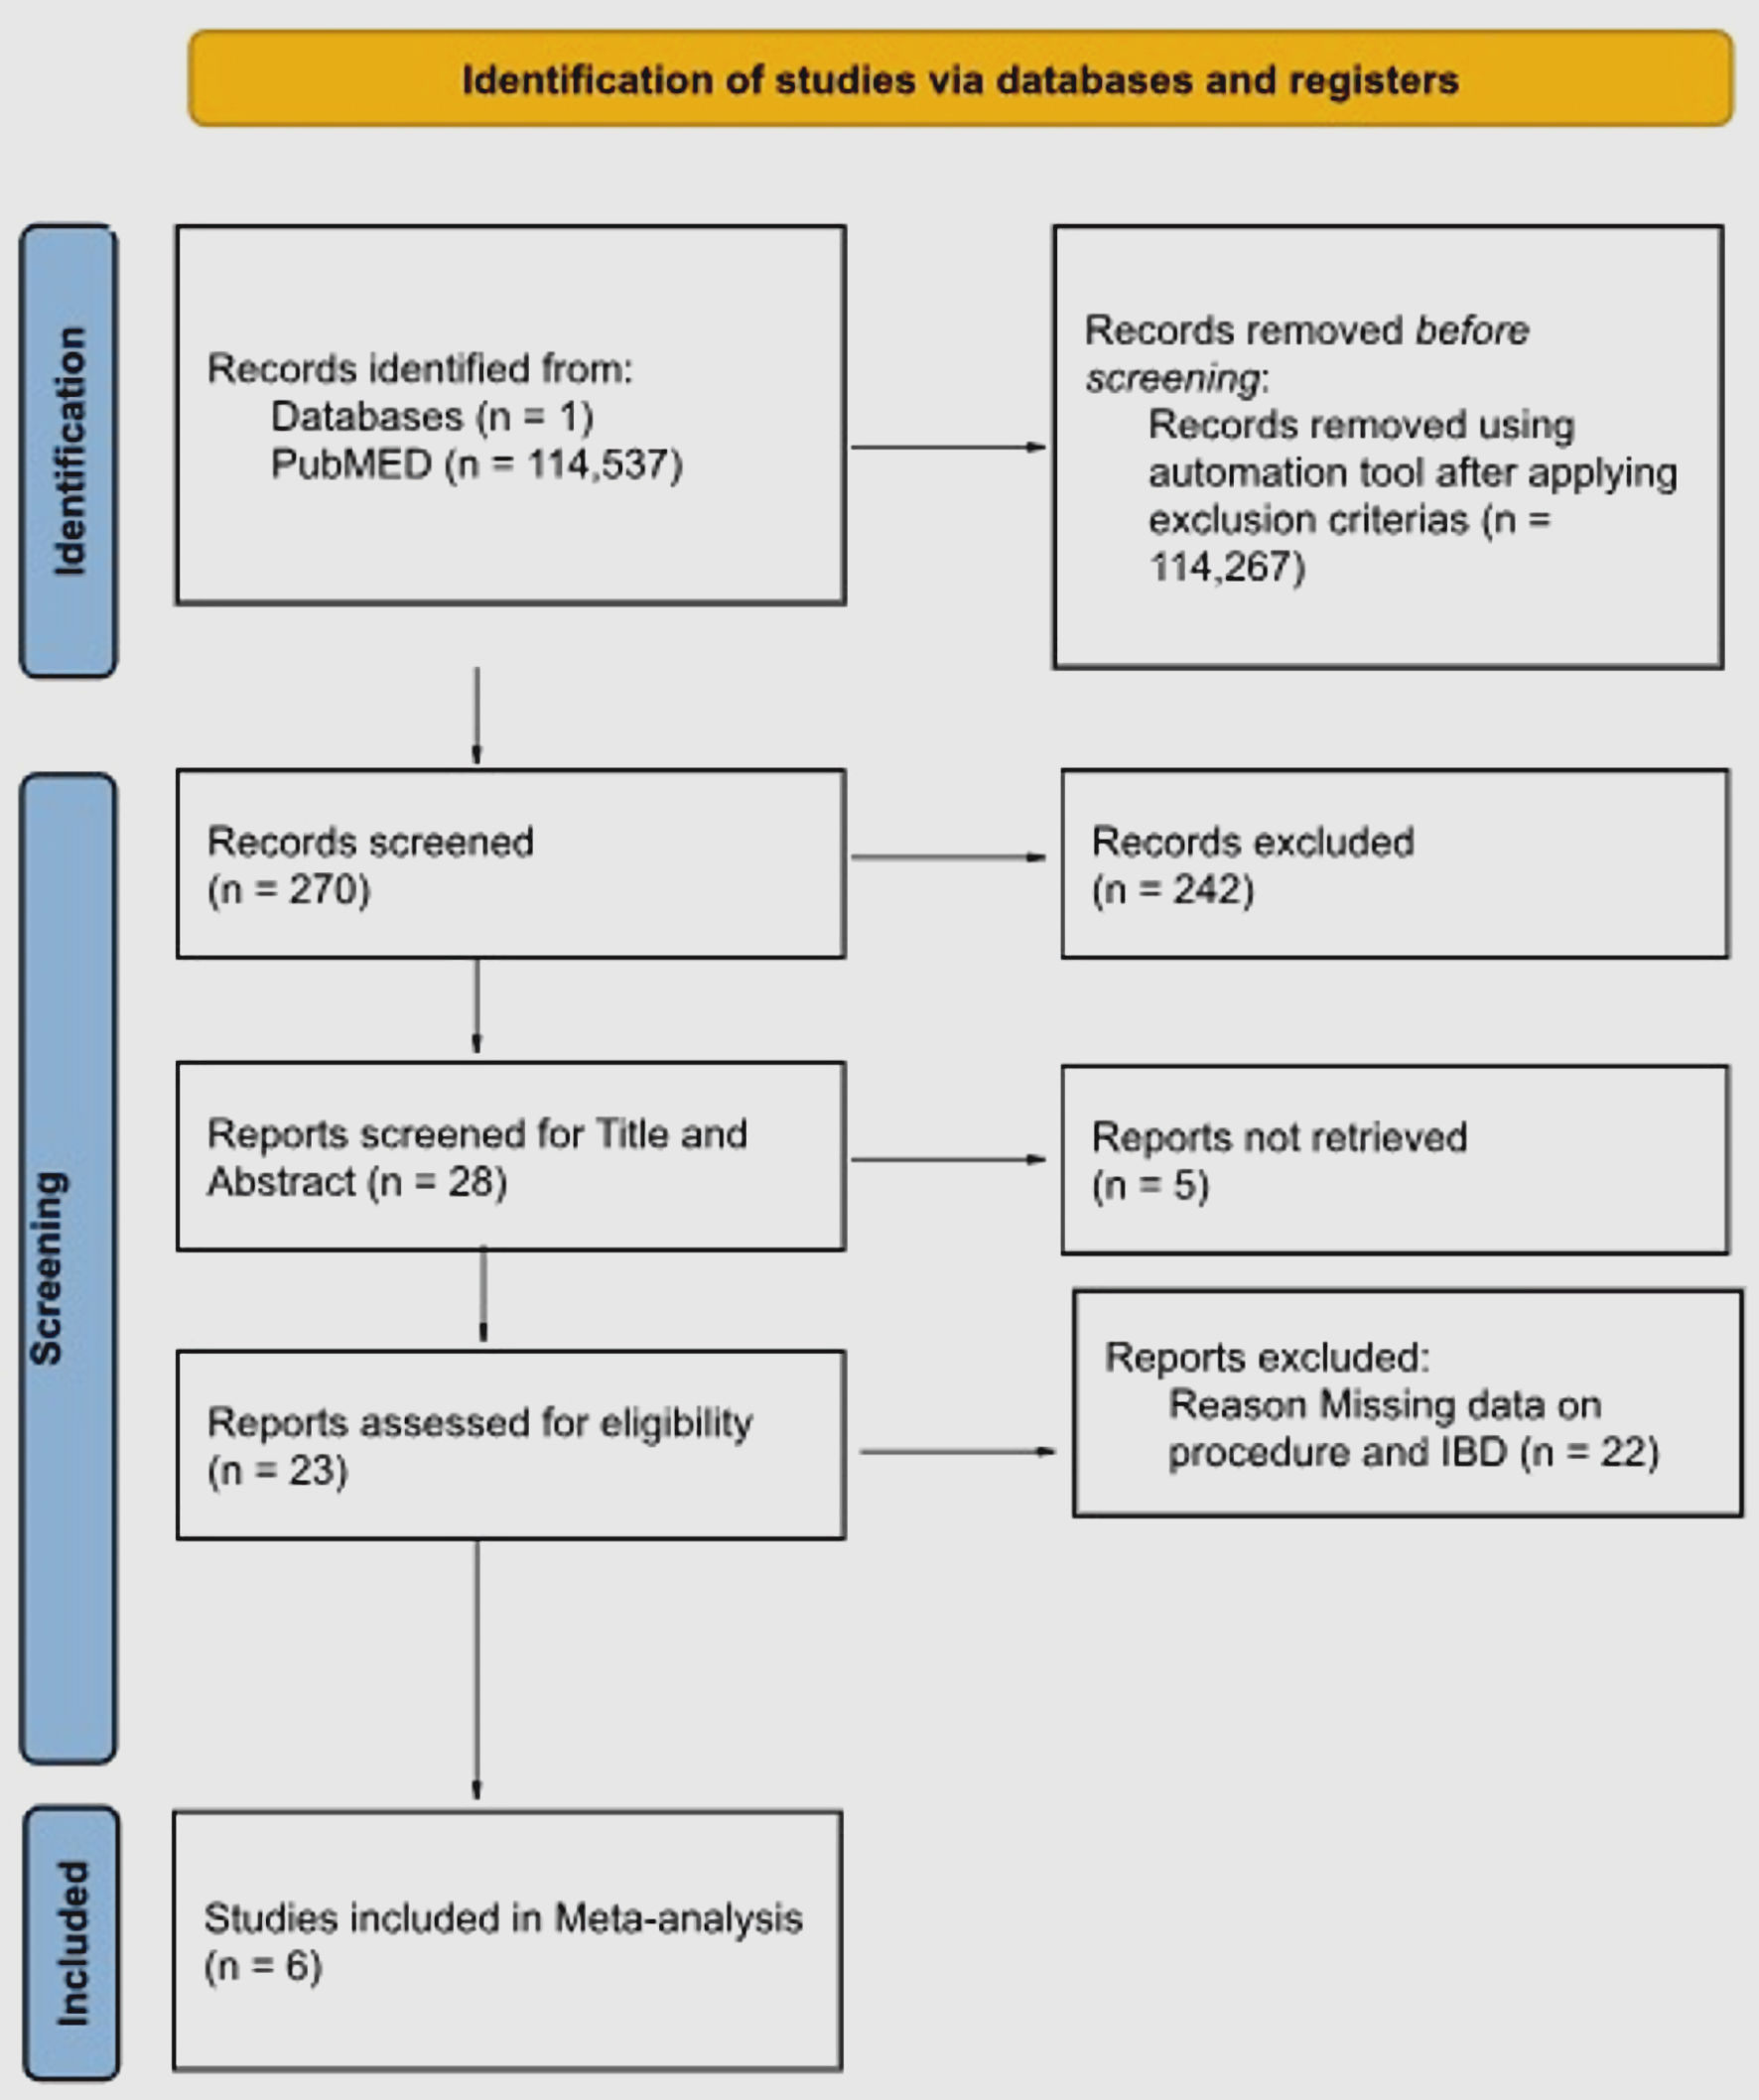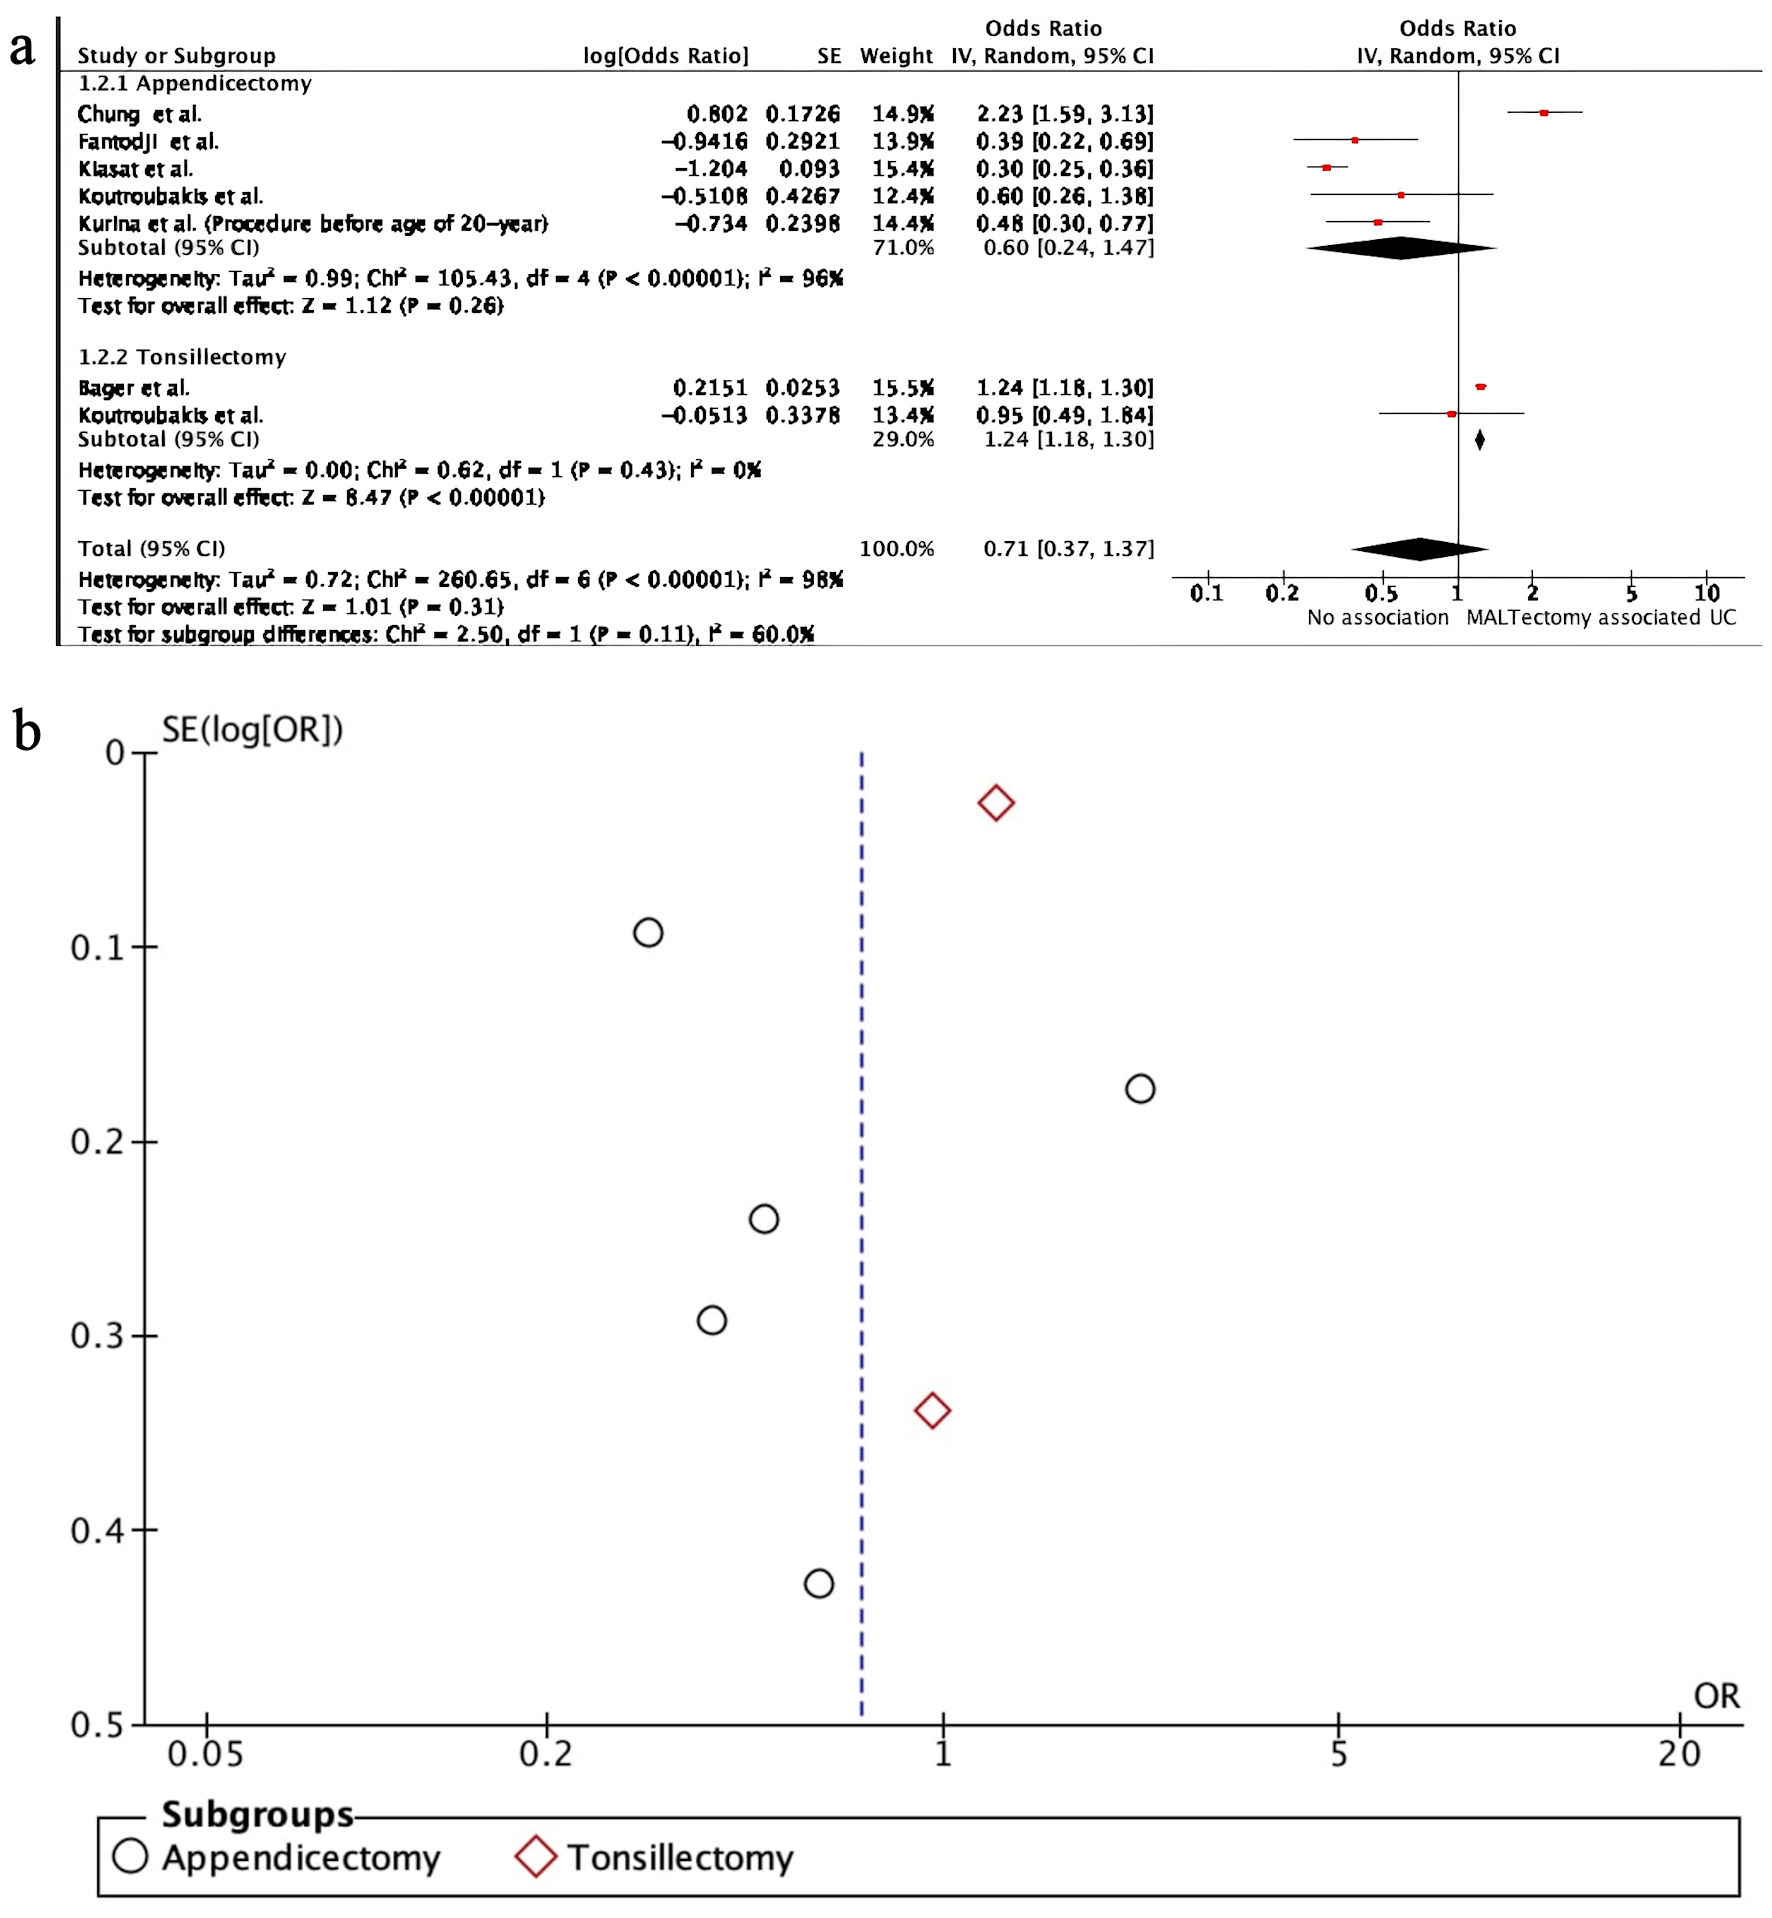
Figure 1. PRISMA flow diagram showing study selection. PRISMA: Preferred Reporting Items for Systematic Reviews and Meta Analysis.
| Gastroenterology Research, ISSN 1918-2805 print, 1918-2813 online, Open Access |
| Article copyright, the authors; Journal compilation copyright, Gastroenterol Res and Elmer Press Inc |
| Journal website https://www.gastrores.org |
Original Article
Volume 17, Number 2, April 2024, pages 90-99
Mucosa-Associated Lymphoid Tissue Surgeries as a Possible Risk for Inflammatory Bowel Disease: A Systematic Review and Meta-Analysis
Figures


Tables
| Study | Study design | Population of interest (P) | Study sample | Surgical procedure (intervention/comparison) | Outcomes | Conclusion |
|---|---|---|---|---|---|---|
| IBD: inflammatory bowel disease; OR: odds ratio; CI: confidence interval; CD: Crohn’s disease; UC: ulcerative colitis; RR: relative risk; AHR: adjusted hazard ratio; HR: hazard ratio; H/o: history of. | ||||||
| Koutroubakis et al, 1999 [13] | Case-control study | IBD vs. non-IBD | UC: n = 134; CD: n = 76; non-IBD: n = 210 | Appendicectomy: n = 58; UC: n = 11; CD: n = 19 | Possibility of having appendicectomy (a risk factor) for developing IBD: 1) UC: OR: 0.6, 95% CI: 0.26 - 1.27; 2) CD: OR: 2.2, 95% CI: 0.94 - 5.12 | 1) History of tonsillectomy was associated with 229 higher odds of developing Crohn’s disease in comparison to non-IBD. 2) History of appendicectomy was associated with 120 higher odds of developing CD in comparison to non-IBD. 3) No association was seen between tonsillectomy and appendicectomy with UC. |
| Non appendicectomy: n = 362 | Tonsillectomy: 1) UC: OR: 0.95, 95% CI: 0.49 - 1.82; 2) CD: OR: 3.29, 95% CI: 1.29 - 8.37 | |||||
| Kurina et al, 2002 [16] | Nested case-control study | IBD vs. non-IBD | UC: n = 7,273; CD: n = 5,023; non-IBD: n = 749,322 | Appendectomy: n = 281 | Appendicectomy: 1) UC < 20 years: RR: 0.48, 95% Cl: 0.30 - 0.73; 2) CD ≥ 20 years: RR: 1.92, 95% CI: 1.58 - 2.32, < 20 years: RR: 0.71, 95% CI: 0.47 - 1.03 | 1) Appendicectomy is associated with reduced risk of UC, more specifically to young age groups. 2) Appendicectomy at age 20 or more correlated with Crohn’s disease; negative association when done at age less than 20. Increased risk of appendicectomy is probably attributable to the misdiagnosis of CD as appendicitis |
| Tonsillectomy: n = 274 | ||||||
| No data on tonsillectomy | ||||||
| Bager et al, 2019 [15] | Cohort study | Tonsillectomy vs. non-tonsillectomy | UC: n = 49,550; CD: n = 22,015; non-IBD: n = 6,973,723 | Tonsillectomy: n = 276,673 | 1) UC: RR: 1.24, 95% CI: 1.18 - 1.29; 2) CD: RR: 1.52, 95% CI: 1.43 - 1.61 | Tonsillectomy increased the risk for both UC and CD |
| Non-tonsillectomy: n = 6,768,615 | ||||||
| Chen et al, 2019 [17] | Retrospective case-control study | CD vs. non-IBD | CD: n = 617; non-IBD: n = 617 | Appendectomy: n = 64 | CD: OR: 1.878, 95% CI: 1.111 - 3.174, P = 0.019 | Prior appendectomy is a risk factor for CD; prior appendectomy did not affect the course or symptoms of the disease |
| Non-appendicectomy: n = 1,170 | ||||||
| Chung et al, 2021 [18] | Cohort study | Appendicectomy vs. non-appendicectomy | UC: n = 165; CD: n = 177; non-IBD: n = 492,782 | Appendicectomy: n = 246,562 | 1) UC: AHR: 2.23, 95% CI: 1.59 - 3.12; 2) CD: AHR: 3.48, 95% CI: 2.42 - 4.99 | Increased risk of IBD in patients undergoing appendectomy |
| Non-appendicectomy: n = 246,562 | ||||||
| Fantodji et al, 2022 [19] | Cohort study | Appendicectomy vs. non-appendicectomy | UC: n = 1,134; CD: n = 2,545; non-IBD: n = 396,841 | Appendicectomy: n = 17,205 | UC: HR: 0.39, 95% CI: 0.22 - 0.71 | Increased risk of CD related to appendicectomy; protective effects for UC with appendectomy observed after 5 years |
| Non-appendicectomy: n = 383,315 | ||||||
| CD: HR 2.02, 95% CI: 1.66 - 2.44 | ||||||
| Kiasat et al, 2022 [14] | Cohort study | H/o appendicitis | UC: n = 619; CD: n = 529; non-IBD: n = 102,658 | H/o appendicitis: n = 52,391 | Appendicectomy: 1) IBD: AHR: 0.48, 95% CI: 0.42 - 0.55; 2) UC: AHR: 0.30, 95% CI: 0.25 - 0.36; 3) CD: AHR: 0.82, 95% CI: 0.68 - 0.97 | Childhood appendicitis treated with appendectomy has lower risk of IBD |
| No H/o appendicitis: n = 51,415 | ||||||
| No H/o appendicitis | ||||||
| Appendicectomy: n = 50,421 | ||||||
| Non-appendicectomy: n = 53,385 | ||||||
| No appendectomy: 1) UC: AHR: 0.29, 95% CI: 0.12 - 0.69; 2) CD: AHR 1.12, 95% CI: 0.61 - 2.06 | ||||||
| Study | Newcastle-Ottawa Scale | |||
|---|---|---|---|---|
| Selection | Comparability | Outcome | Overall risk of bias | |
| *A lower bias, rated 1/5. **A relatively higher bias, rated 2/5. | ||||
| Koutroubakis et al, 1999 [13] | ** | * | ** | Moderate |
| Kurina et al, 2002 [16] | *** | * | * | Moderate |
| Bager et al, 2019 [15] | *** | * | ** | Moderate |
| Chen et al, 2019 [17] | ** | * | ** | Moderate |
| Chung et al, 2021 [18] | *** | * | ** | Moderate |
| Fantodji et al, 2022 [19] | *** | * | ** | Moderate |