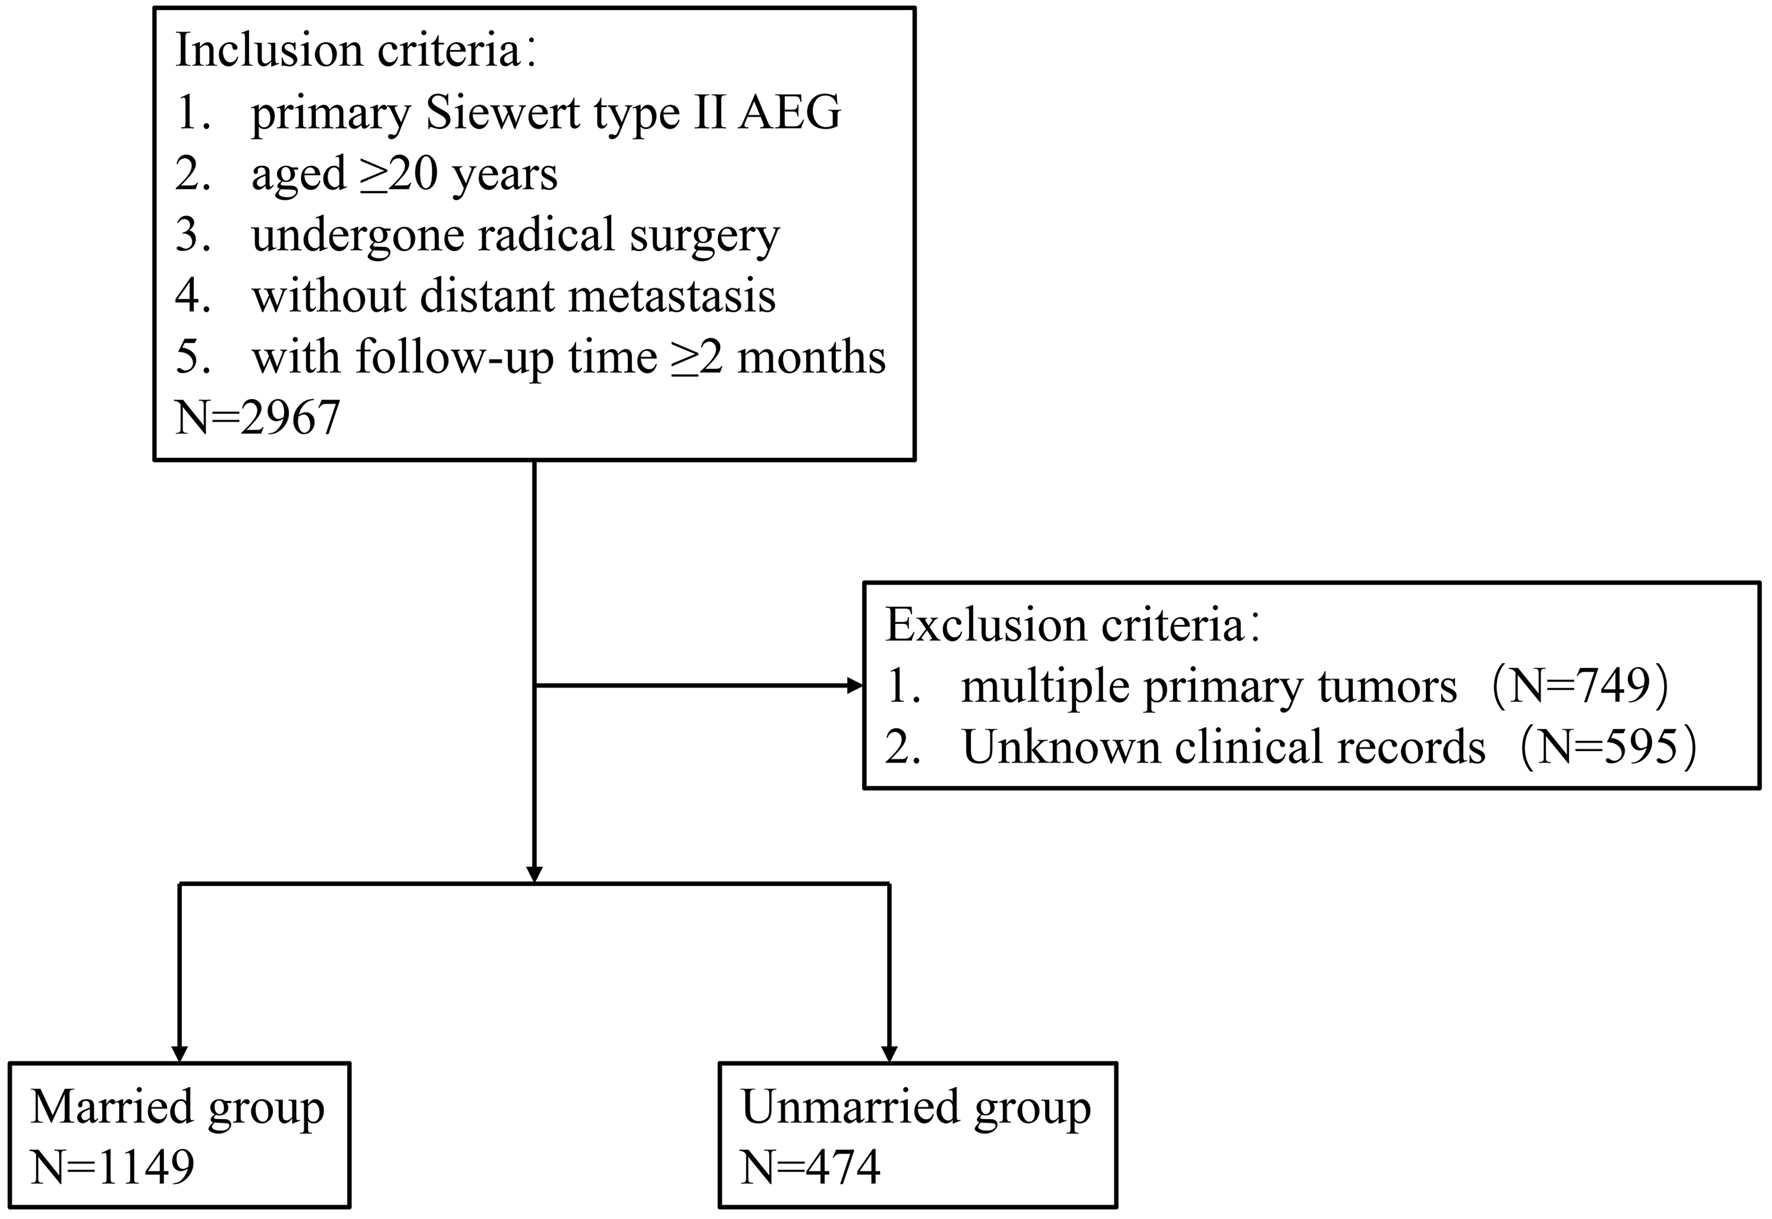
Figure 1. Eligibility, inclusion, and exclusion criteria of the study population. AEG: adenocarcinoma of the esophagogatric junction.
| Gastroenterology Research, ISSN 1918-2805 print, 1918-2813 online, Open Access |
| Article copyright, the authors; Journal compilation copyright, Gastroenterol Res and Elmer Press Inc |
| Journal website https://www.gastrores.org |
Original Article
Volume 16, Number 6, December 2023, pages 307-317
Marital Status Is a Prognostic Factor for Cardiovascular Mortality but Not a Prognostic Factor for Cancer Mortality in Siewert Type II Adenocarcinoma of the Esophagogastric Junction
Figures
Tables
| Variables | Before PSM, N (%) | After PSM, N (%) | ||||
|---|---|---|---|---|---|---|
| Married | Unmarried | P | Married | Unmarried | P | |
| AEG: adenocarcinoma of the esophagogatric junction; LNR: lymph node metastasis ratio; PSM: propensity score matching; RLN: number of removed lymph nodes. | ||||||
| N | 1149 | 474 | 474 | 474 | ||
| Age | 0.025 | 0.22 | ||||
| ≤ 56 | 296 (25.8%) | 148 (31.2%) | 135 (28.5%) | 148 (31.2%) | ||
| 56 - 75 | 725 (63.1%) | 265 (55.9%) | 290 (61.2%) | 265 (55.9%) | ||
| > 75 | 128 (11.1%) | 61 (12.9%) | 49 (10.3%) | 61 (12.9%) | ||
| Sex | < 0.001 | 0.04 | ||||
| Male | 981 (85.4%) | 347 (73.2%) | 375 (79.1%) | 347 (73.2%) | ||
| Female | 168 (14.6%) | 127 (26.8%) | 99 (20.9%) | 127 (26.8%) | ||
| Race | < 0.001 | < 0.001 | ||||
| White | 1003 (85.4%) | 404 (85.2%) | 404 (85.2%) | 404 (85.2%) | ||
| Black | 41 (3.6%) | 39 (8.2%) | 12 (2.5%) | 39 (8.2%) | ||
| Other | 105 (9.1%) | 31 (6.5%) | 58 (12.2%) | 31 (6.5%) | ||
| Grade | 0.882 | 0.462 | ||||
| G1 | 69 (6.0%) | 33 (7.0%) | 22 (4.6%) | 33 (7.0%) | ||
| G2 | 436 (37.9%) | 177 (37.3%) | 178 (37.6%) | 177 (37.3%) | ||
| G3 | 624 (54.3%) | 257 (54.2%) | 265 (55.9%) | 257 (54.2%) | ||
| G4 | 20 (1.7%) | 7 (1.5%) | 9 (1.9%) | 7 (1.5%) | ||
| Stage | 0.088 | 0.105 | ||||
| I | 234 (20.4%) | 85 (17.9%) | 93 (19.6%) | 85 (17.9%) | ||
| II | 285 (24.8%) | 142 (30.0%) | 113 (23.8%) | 142 (30.0%) | ||
| III | 630 (54.8%) | 247 (52.1%) | 268 (56.5%) | 247 (52.1%) | ||
| T stage | 0.232 | 0.228 | ||||
| T1 | 229 (19.9%) | 95 (20.0%) | 83 (17.5%) | 95 (20.0%) | ||
| T2 | 179 (15.6%) | 58 (12.2%) | 79 (16.7%) | 58 (12.2%) | ||
| T3 | 680 (59.2%) | 288 (60.8%) | 283 (59.7%) | 288 (60.8%) | ||
| T4 | 61 (5.3%) | 33 (7.0%) | 29 (6.1%) | 33 (7.0%) | ||
| N stage | 0.077 | 0.076 | ||||
| N0 | 428 (37.2%) | 191 (40.3%) | 174 (36.7%) | 191 (40.3%) | ||
| N1 | 399 (34.7%) | 143 (30.2%) | 174 (36.7%) | 143 (30.2%) | ||
| N2 | 205 (17.8%) | 76 (16.0%) | 80 (16.9%) | 76 (16.0%) | ||
| N3 | 117 (10.2%) | 64 (13.5%) | 46 (9.7%) | 64 (13.5%) | ||
| RLN | 0.911 | 0.799 | ||||
| ≤ 10 | 294 (25.6%) | 120 (25.3%) | 117 (24.7%) | 120 (25.3%) | ||
| 10 - 16 | 308 (26.8%) | 132 (27.8%) | 125 (26.4%) | 132 (27.8%) | ||
| > 16 | 547 (47.6%) | 222 (46.8%) | 232 (48.9%) | 222 (46.8%) | ||
| LNR | 0.118 | 0.177 | ||||
| ≤ 4.2 | 619 (53.9%) | 258 (54.4%) | 264 (55.7%) | 258 (54.4%) | ||
| 4.2 - 16.7 | 245 (21.3%) | 82 (17.3%) | 98 (20.7%) | 82 (17.3%) | ||
| > 16.7 | 285 (24.8%) | 134 (28.3%) | 112 (23.6%) | 134 (28.3%) | ||
| Tumor size | 0.338 | 0.966 | ||||
| ≤ 19 | 207 (15.6%) | 74 (15.6%) | 73 (15.4%) | 74 (15.6%) | ||
| 19 - 44 | 522 (45.4%) | 211 (44.5%) | 215 (45.4%) | 211 (44.5%) | ||
| > 44 | 420 (36.6%) | 189 (39.9%) | 186 (39.2%) | 189 (39.9%) | ||
| Chemotherapy | 0.148 | 0.042 | ||||
| Yes | 840 (73.1%) | 329 (69.4%) | 358 (75.5%) | 329 (69.4%) | ||
| No | 309 (26.9%) | 145 (30.6%) | 116 (24.5%) | 145 (30.6%) | ||
| Radiotherapy | 0.325 | 0.064 | ||||
| Yes | 677 (58.9%) | 266 (56.1%) | 295 (62.2%) | 266 (56.1%) | ||
| No | 472 (41.1%) | 208 (43.9%) | 179 (37.8%) | 208 (43.9%) | ||
| Dead | < 0.001 | < 0.001 | ||||
| Alive | 516 (44.9%) | 170 (35.9%) | 213 (44.9%) | 170 (35.9%) | ||
| AEG | 547 (47.6%) | 247 (52.1%) | 228 (48.1%) | 247 (52.1%) | ||
| Cardiovascular | 33 (2.9%) | 26 (5.5%) | 8 (1.7%) | 26 (5.5%) | ||
| Other | 53 (4.6%) | 31 (6.5%) | 25 (5.3%) | 31 (6.5%) | ||
| Variables | Before PSM, N (%) | After PSM, N (%) | ||
|---|---|---|---|---|
| HR (95% CI) | P | HR (95% CI) | P | |
| AEG: adenocarcinoma of the esophagogatric junction; CI: confidence interval; HR: hazard ratio; RLN: number of removed lymph nodes; PSM: propensity score matching. | ||||
| Age | ||||
| ≤ 56 | Ref | Ref | ||
| 56 - 75 | 1.176 (1.001 - 1.380) | 0.048 | 1.197 (0.976 - 1.469) | 0.084 |
| > 75 | 1.223 (0.951 - 1.572) | 0.12 | 1.106 (0.795 - 1.539) | 0.550 |
| Sex | ||||
| Male | Ref | Ref | ||
| Female | 0.934 (0.773 - 1.129) | 0.48 | 1.047 (0.839 - 1.307) | 0.680 |
| Race | ||||
| White | Ref | Ref | ||
| Black | 0.930 (0.682 - 1.268) | 0.65 | 0.789 (0.521 - 1.195) | 0.260 |
| Other | 0.759 (0.576 - 0.999) | 0.049 | 0.797 (0.567 - 1.122) | 0.190 |
| Grade | ||||
| G1 | Ref | Ref | ||
| G2 | 1.232 (0.848 - 1.790) | 0.27 | 1.588 (0.925 - 2.724) | 0.093 |
| G3 | 1.594 (1.103 - 2.303) | 0.013 | 2.227 (1.311 - 3.785) | 0.003 |
| G4 | 1.575 (0.887 - 2.798) | 0.12 | 1.714 (0.814 - 3.609) | 0.160 |
| T stage | ||||
| T1 | Ref | Ref | ||
| T2 | 1.745 (1.254 - 2.429) | < 0.001 | 1.642 (1.070 - 2.521) | 0.023 |
| T3 | 2.053 (1.496 - 2.819) | < 0.001 | 1.801 (1.199 - 2.705) | 0.004 |
| T4 | 2.808 (1.843 - 4.279) | < 0.001 | 2.276 (1.346 - 3.848) | 0.002 |
| N stage | ||||
| N0 | Ref | Ref | ||
| N1 | 1.594 (1.292 - 1.966) | < 0.001 | 1.500 (1.143 - 1.968) | 0.004 |
| N2 | 2.452 (1.948 - 3.086) | < 0.001 | 2.517 (1.872 - 3.386) | < 0.001 |
| N3 | 3.178 (2.453 - 4.117) | < 0.001 | 2.790 (2.014 - 3.864) | < 0.001 |
| RLN | ||||
| ≤ 10 | Ref | Ref | ||
| 10 - 16 | 0.774 (0.640 - 0.937) | 0.008 | 0.844 (0.659 - 1.080) | 0.180 |
| > 16 | 0.618 (0.519 - 0.735) | < 0.001 | 0.634 (0.505 - 0.797) | < 0.001 |
| Tumor size | ||||
| ≤ 19 | Ref | Ref | ||
| 19 - 44 | 1.159 (0.880 - 1.526) | 0.30 | 1.223 (0.844 - 1.770) | 0.290 |
| > 44 | 1.313 (0.983 - 1.752) | 0.065 | 1.700 (1.155 - 2.503) | 0.007 |
| Chemotherapy | ||||
| Yes | Ref | Ref | ||
| No | 1.143 (0.896 - 1.457) | 0.28 | 1.120 (0.826 - 1.518) | 0.470 |
| Radiotherapy | ||||
| Yes | Ref | Ref | ||
| No | 1.046 (0.875 - 1.251) | 0.62 | 1.198 (0.948 - 1.514) | 0.130 |
| Marital status | ||||
| Married | Ref | Ref | ||
| Unmarried | 1.160 (0.994 - 1.354) | 0.060 | 1.179 (0.975 - 1.426) | 0.089 |
| Variables | Before PSM, N (%) | After PSM, N (%) | ||
|---|---|---|---|---|
| HR (95% CI) | P | HR (95% CI) | P | |
| AEG: adenocarcinoma of the esophagogatric junction; CI: confidence interval; HR: hazard ratio; PSM: propensity score matching; RLN: number of removed lymph nodes. | ||||
| Age | ||||
| ≤ 56 | Ref | Ref | ||
| 56 - 75 | 2.149 (0.986 - 4.680) | 0.054 | 1.477 (0.594 - 3.670) | 0.400 |
| > 75 | 3.298 (1.294 - 8.410) | 0.012 | 3.389 (1.124 - 10.220) | 0.030 |
| Sex | ||||
| Male | Ref | Ref | ||
| Female | 0.884 (0.452 - 1.730) | 0.720 | 0.915 (0.408 - 2.050) | 0.830 |
| Race | ||||
| White | Ref | Ref | ||
| Black | 1.983 (0.899 - 4.370) | 0.090 | 3.274 (1.398 - 7.670) | 0.006 |
| Other | 1.430 (0.616 - 3.320) | 0.410 | 1.412 (0.428 - 4.660) | 0.570 |
| Grade | ||||
| G1 | Ref | Ref | ||
| G2 | 0.394 (0.139 - 1.110) | 0.079 | 0.702 (0.140 - 3.520) | 0.670 |
| G3 | 0.667 (0.244 - 1.820) | 0.430 | 0.764 (0.153 - 3.820) | 0.740 |
| G4 | 0.645 (0.072 - 5.760) | 0.700 | 1.652 (0.132 - 20.700) | 0.700 |
| T stage | ||||
| T1 | Ref | Ref | ||
| T2 | 0.817 (0.308 - 2.170) | 0.690 | 0.987 (0.246 - 3.960) | 0.990 |
| T3 | 0.772 (0.338 - 1.770) | 0.540 | 0.927 (0.286 - 3.000) | 0.900 |
| T4 | 0.628 (0.165 - 2.390) | 0.490 | 0.796 (0.151 - 4.200) | 0.790 |
| N stage | ||||
| N0 | Ref | Ref | ||
| N1 | 1.520 (0.684 - 3.380) | 0.300 | 1.288 (0.448 - 3.700) | 0.640 |
| N2 | 1.209 (0.461 - 3.170) | 0.700 | 2.095 (0.685 - 6.410) | 0.190 |
| N3 | 1.870 (0.773 - 4.530) | 0.170 | 2.310 (0.847 - 6.300) | 0.100 |
| RLN | ||||
| ≤ 10 | Ref | Ref | ||
| 10 - 16 | 0.751 (0.370 - 1.530) | 0.430 | 0.628 (0.245 - 1.610) | 0.330 |
| > 16 | 0.850 (0.446 - 1.620) | 0.620 | 0.705 (0.316 - 1.570) | 0.390 |
| Tumor size | ||||
| ≤ 19 | Ref | Ref | ||
| 19 - 44 | 2.227 (0.914 - 5.430) | 0.078 | 1.925 (0.556 - 6.670) | 0.300 |
| > 44 | 1.755 (0.677 - 4.550) | 0.250 | 1.207 (0.319 - 4.560) | 0.780 |
| Chemotherapy | ||||
| Yes | Ref | Ref | ||
| No | 1.857 (0.850 - 4.060) | 0.120 | 1.405 (0.423 - 4.670) | 0.580 |
| Radiotherapy | ||||
| Yes | Ref | Ref | ||
| No | 0.865 (0.411 - 1.820) | 0.700 | 0.591 (0.196 - 1.780) | 0.350 |
| Marital status | ||||
| Married | Ref | Ref | ||
| Unmarried | 1.860 (1.096 - 3.160) | 0.021 | 3.066 (1.372 - 6.850) | 0.006 |