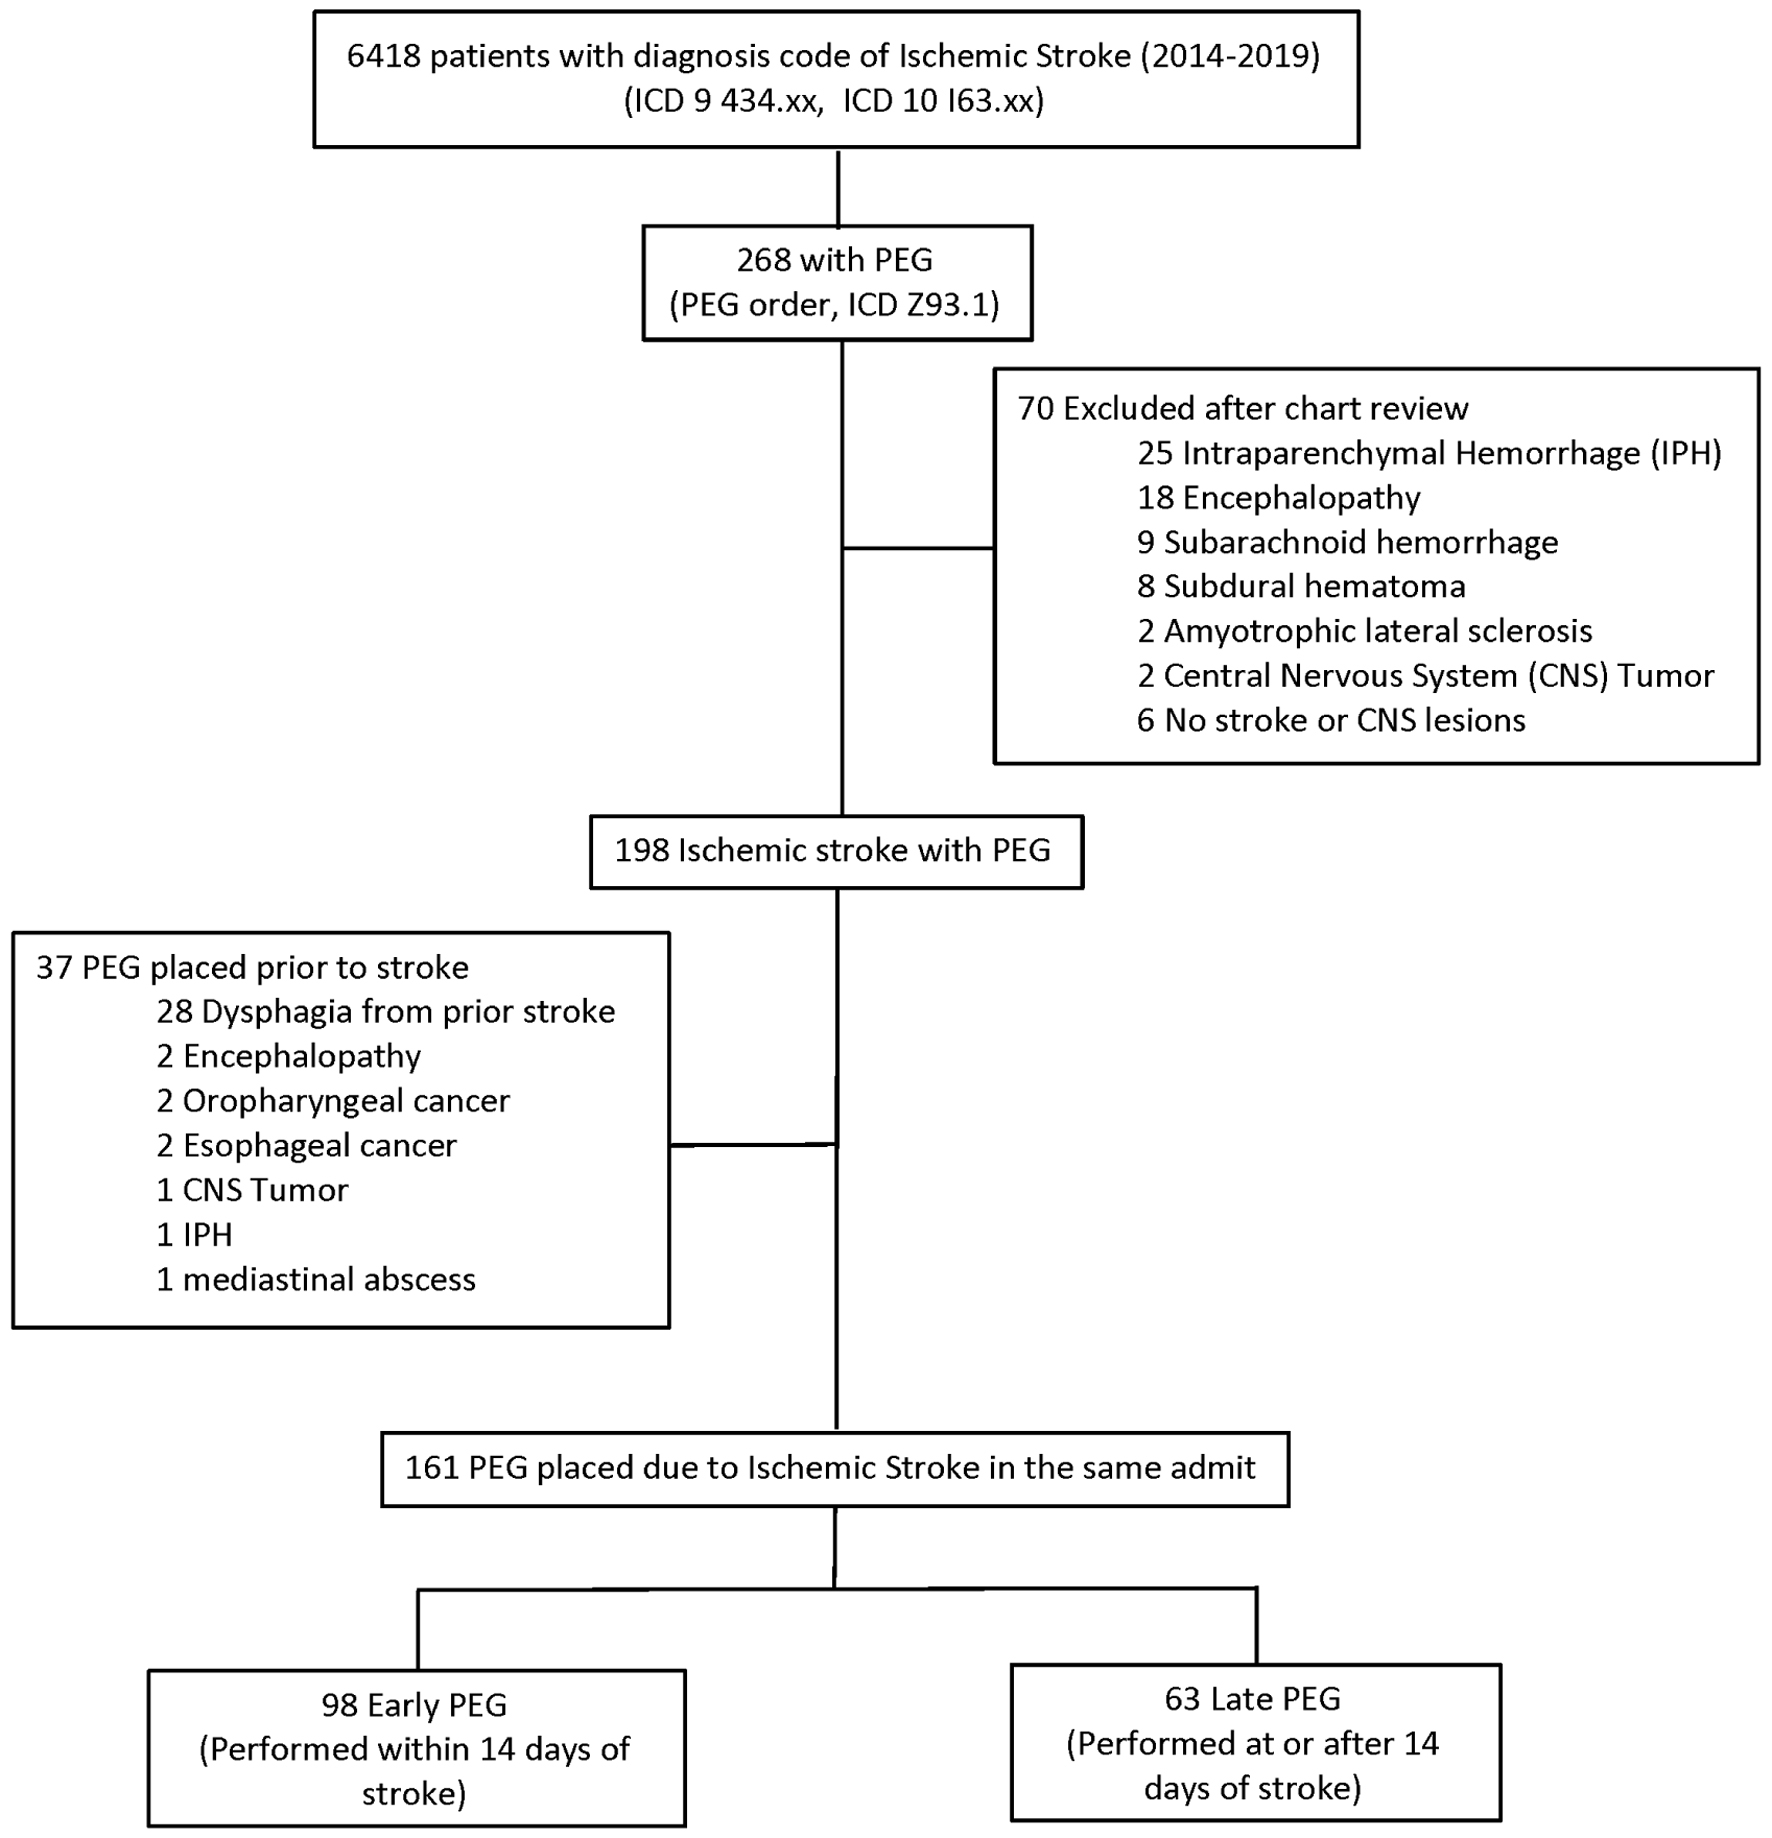
Figure 1. Distribution of the cohort.
| Gastroenterology Research, ISSN 1918-2805 print, 1918-2813 online, Open Access |
| Article copyright, the authors; Journal compilation copyright, Gastroenterol Res and Elmer Press Inc |
| Journal website https://www.gastrores.org |
Original Article
Volume 16, Number 6, December 2023, pages 281-288
Timing and Outcomes of Percutaneous Endoscopic Gastrostomy After Ischemic Stroke
Figures
Tables
| Characteristics | n | All PEG | Early PEG (n = 98) | Late PEG (n = 63) | P-value |
|---|---|---|---|---|---|
| CCI: Charlson Comorbidity Index; IQR: interquartile range; PEG: percutaneous endoscopic gastrostomy; SD: standard deviaton; NIHSS: National Institute of Health Stroke Scale. | |||||
| Age, years, median (IQR) | 161 | 66 (63 - 75) | 67 (56 - 77) | 65 (50 - 72) | 0.055 |
| Age, years, N (%) | 0.464 | ||||
| < 65 | 74 (45.9) | 43 (43.9) | 31 (49.2) | ||
| 65 - 75 | 51 (31.7) | 29 (29.6) | 22 (34.9) | ||
| 75 - 85 | 28 (17.4) | 20 (20.8) | 8 (12.7) | ||
| > 85 | 8 (4.9) | 6 (6.1 ) | 2 (3.17) | ||
| Gender, male, N (%) | 99 (61.5) | 56 (57.1) | 43 (68.2) | 0.157 | |
| Race/ethnicity, N (%) | 0.871 | ||||
| Non-Hispanic White | 89 (55.3) | 52 (53.1) | 37 (58.7) | ||
| Hispanic | 37 (22.9) | 23 (23.5) | 14 (22.2) | ||
| Black | 16 (9.9) | 11 (11.2) | 5 (7.9) | ||
| Other | 19 (11.8) | 12 (12.2) | 7 (11.1) | ||
| Comorbidities, N (%) | 161 | 0.351 | |||
| CCI score: 1 - 2 | 34 (21.1) | 23 (23.5) | 11 (17.5) | ||
| CCI score: 3 - 4 | 71 (44.1) | 45 (45.9) | 26 (41.3) | ||
| CCI score: > 5 | 56 (34.8) | 30 (30.6) | 26 (41.3) | ||
| Atrial fibrillation, N (%) | 62 (38.5) | 38 (38.8) | 24 (38.1) | 0.931 | |
| Mechanical ventilation, N (%) | 83 (51.5) | 46 (46.9) | 37 (58.7) | 0.144 | |
| Tracheostomy, N (%) | 38 (23.7) | 25 (25.77) | 13 (20.63) | 0.456 | |
| Hospital length of stay, mean (SD) | 17.4 (12.9) | 15.8 (1.4) | 20.11 (14.8) | 0.029 | |
| Stroke characteristics | |||||
| NIHSS, median (IQR) | 120 | 16.5 (7 - 23.5) | 16 (7 - 24) | 17 (7 - 23) | 0.968 |
| Characteristics | Early PEG (n = 98) | Late PEG (n = 63) | P-value |
|---|---|---|---|
| PEG: percutaneous endoscopic gastrostomy. | |||
| 30-day mortality | 7 (7.14) | 4 (6.35) | 0.558 |
| PEG-related complications, N (%) | 9 (9.18) | 2 (3.17) | 0.204 |
| PEG removal and functional swallow recovery | |||
| PEG removed, N (%) | 20 (20.41) | 23 (36.51) | 0.024 |
| PEG present, partial swallow recovery, N (%) | 10 (10.20) | 8 (12.7) | 0.624 |
| PEG dependent, N (%) | 46 (46.94) | 26 (41.27) | 0.48 |
| Patient characteristics | Univariable | Multivariable | ||||
|---|---|---|---|---|---|---|
| Odds ratio | 95% CI | P-value | Odds ratio | 95% CI | P-value | |
| Dash (-) indicates that the variable was included in the multivariable model but was not statistically significant. CCI: Charles Comorbidity Index; CI: confidence interval; NIHSS: National Institute of Health Stroke Scale; PEG: percutaneous endoscopic gastrostomy. | ||||||
| Age, years | 0.97 | 0.95 - 0.99 | 0.08 | - | - | - |
| Male gender (compared to females) | 0.70 | 0.34 - 1.47 | 0.35 | - | - | - |
| Late PEG (compared to early PEG) | 2.24 | 1.10 - 4.56 | 0.03 | 3.27 | 1.22 - 8.74 | 0.02 |
| Hispanic race (compared to white) | 0.56 | 0.15 - 2.12 | 0.39 | - | - | - |
| Black race (compared to white) | 0.57 | 0.22 - 1.45 | 0.2 | - | - | - |
| Other race (compared to white) | 1.41 | 0.50 - 3.99 | 0.51 | - | - | |
| NIHSS | 0.95 | 0.91 - 0.99 | 0.04 | 0.95 | 0.89 - 0.99 | 0.045 |
| CCI score: 3 - 4 (compared to 1 - 2) | 0.82 | 0.35 - 1.95 | 0.66 | - | - | - |
| CCI score > 5 (compared to 1 - 2) | 0.35 | 0.13 - 0.95 | 0.04 | - | - | - |
| Palliative care | 0.22 | 0.05 - 0.99 | 0.48 | |||
| Patient characteristics | Univariable | Multivariable | ||||
|---|---|---|---|---|---|---|
| Odds ratio | 95% CI | P-value | Odds ratio | 95% CI | P-value | |
| Dash (-) indicates that the variable was included in the multivariable model but was not statistically significant. CCI: Charles Comorbidity Index; CI: confidence interval; NIHSS: National Institute of Health Stroke Scale; PEG: percutaneous endoscopic gastrostomy; SNF: skilled nursing facility. | ||||||
| Age, years | 1.08 | 0.99 - 1.04 | 0.07 | - | - | - |
| Male gender (compared to females) | 1.6 | 0.83 - 3.13 | 0.16 | - | - | - |
| Race | 1.07 | 0.81 - 1.43 | 0.61 | |||
| CCI score | 0.73 | 0.47 - 1.13 | 0.16 | - | - | - |
| NIHSS | 0.99 | 0.96 - 1.03 | 0.92 | 0.95 | 0.90 - 0.99 | 0.02 |
| Speech therapy evaluation | 0.69 | 0.31 - 153 | 0.36 | |||
| Tracheostomy status | 1.33 | 0.62 - 2.85 | 0.46 | |||
| Intubation status | 0.62 | 0.33 - 1.18 | 0.16 | - | - | - |
| All infection | 0.54 | 0.28 - 1.01 | 0.06 | 0.32 | 0.14 - 0.73 | 0.007 |
| Hospice (compared to home/acute rehabilitation) | 1.89 | 0.42 - 8.6 | 0.41 | |||
| SNF (compared to home/Acute rehabilitation facility) | 2.69 | 1.37 - 5.28 | 0.004 | 3.4 | 1.48 - 7.8 | 0.004 |