Gastroenterology Research, ISSN 1918-2805 print, 1918-2813 online, Open Access
Article copyright, the authors; Journal compilation copyright, Gastroenterol Res and Elmer Press Inc
Journal website https://www.gastrores.org

Original Article

Volume 16, Number 4, August 2023, pages 226-233


Effects of Helicobacter pylori Infection on the Prognosis of Chronic Atrophic Gastritis by Inducing the Macrophage Polarization

Figures

Figure 1.
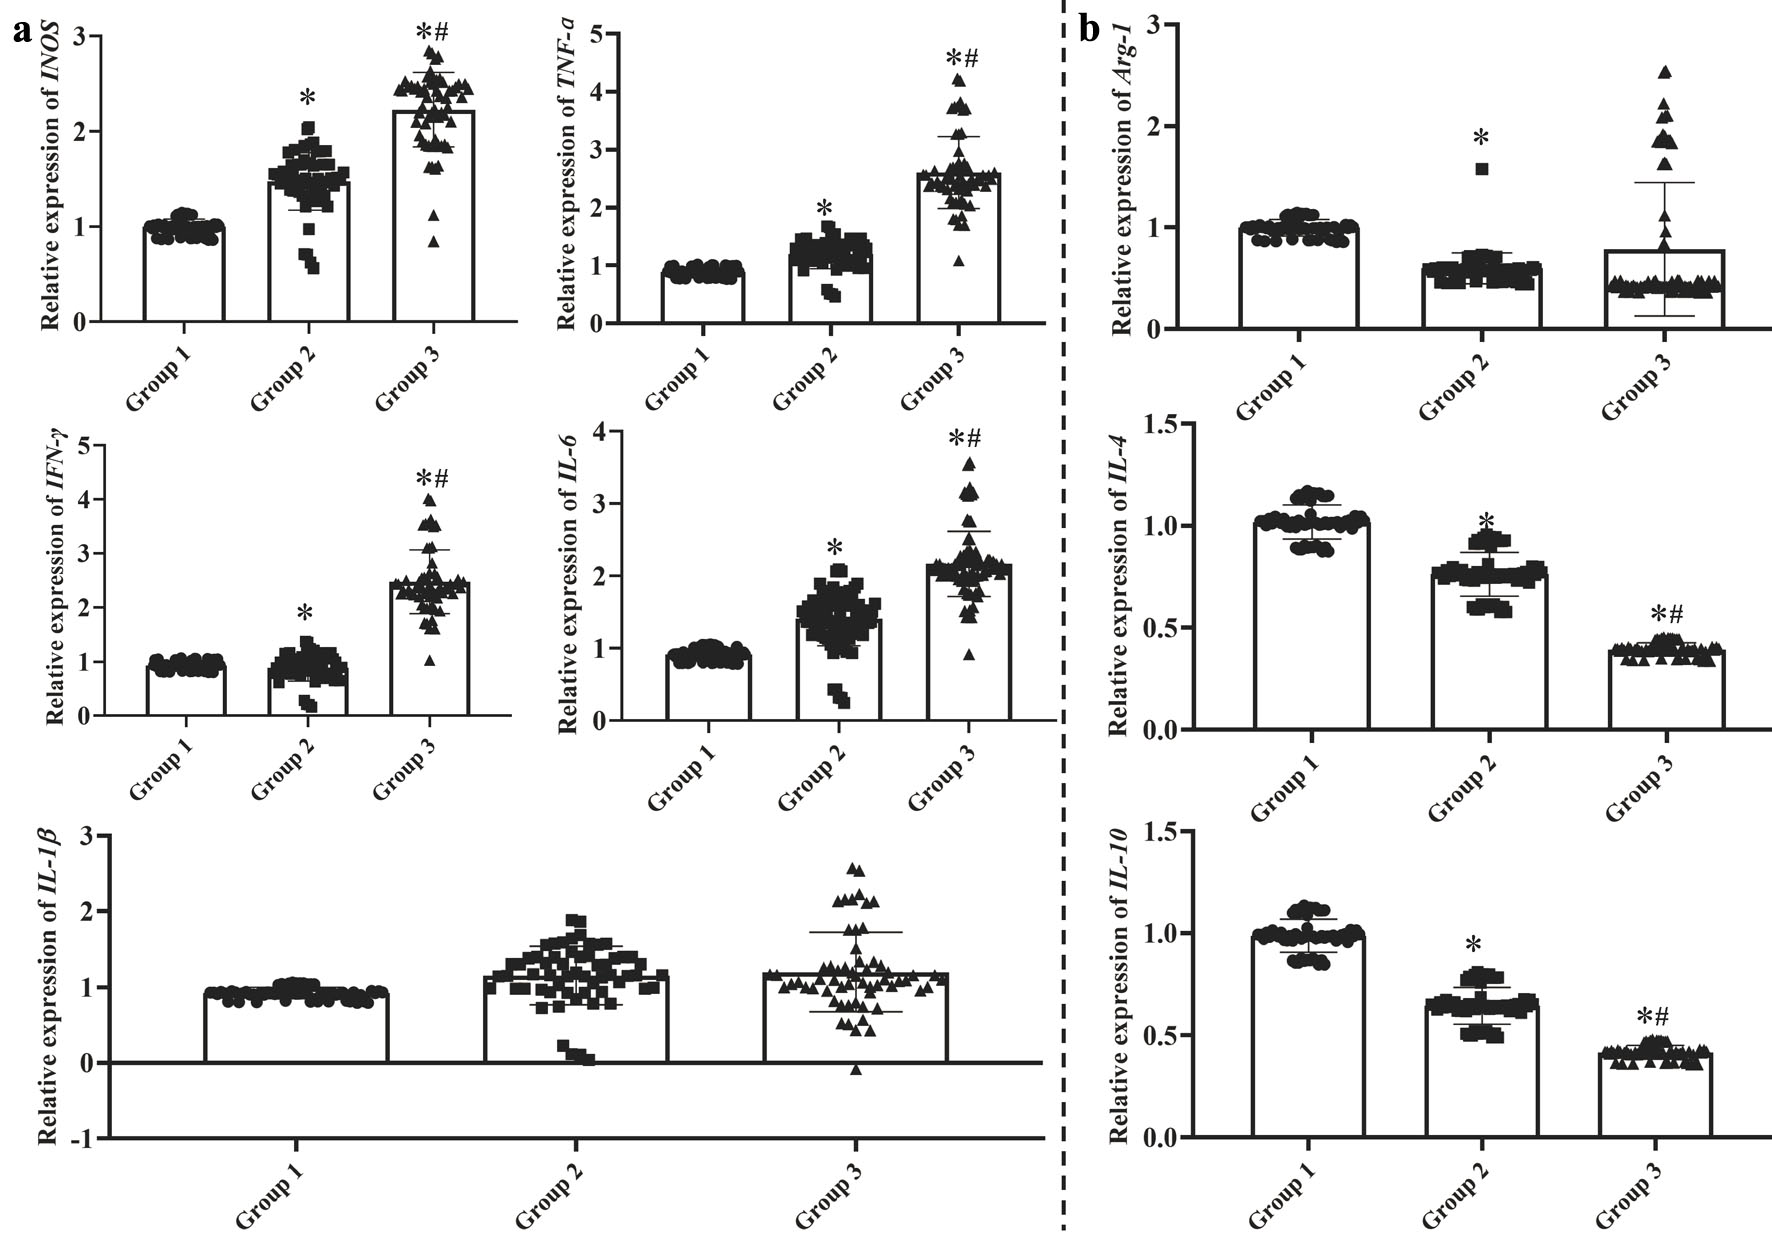
Figure 1. The mRNA expression on the M1 macrophage (a) and M2 macrophage (b) polarization in the gastric mucosa. Group 1: control group with health subjects; group 2: chronic atrophic gastritis patients without H. pylori infection; group 3: H. pylori-associated chronic atrophic gastritis patients. One-way analysis of variance (ANOVA) was performed to compare the means of these indexes, then the Student-Newman-Keuls (SNK) test was used to determine where the differences were existed between each two groups. *P < 0.05 compared with the group 1. #P < 0.05 compared with the group 2.
Figure 2.
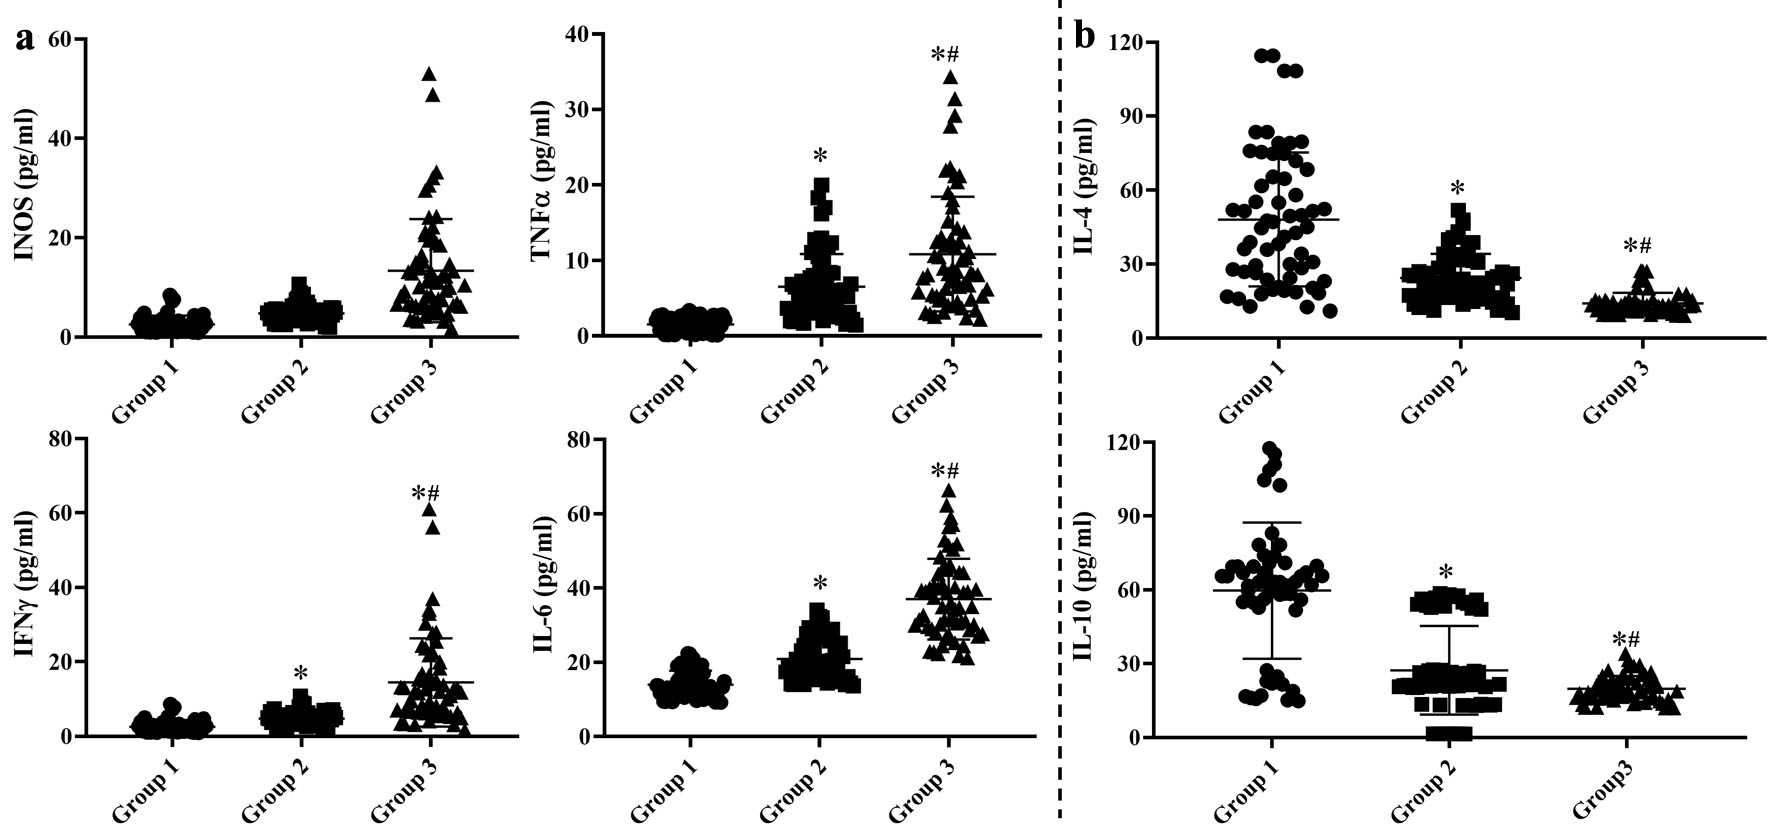
Figure 2. Concentrations of serum pro-inflammatory (a) and anti-inflammatory (b) cytokines. Group 1: control group with health subjects; group 2: chronic atrophic gastritis patients without H. pylori infection; group 3: H. pylori-associated chronic atrophic gastritis patients. One-way analysis of variance (ANOVA) was performed to compare the means of these indexes, then the Student-Newman-Keuls (SNK) test was used to determine where the differences were existed between each two groups. *P < 0.05 compared with the group 1. #P < 0.05 compared with the group 2.
Figure 3.
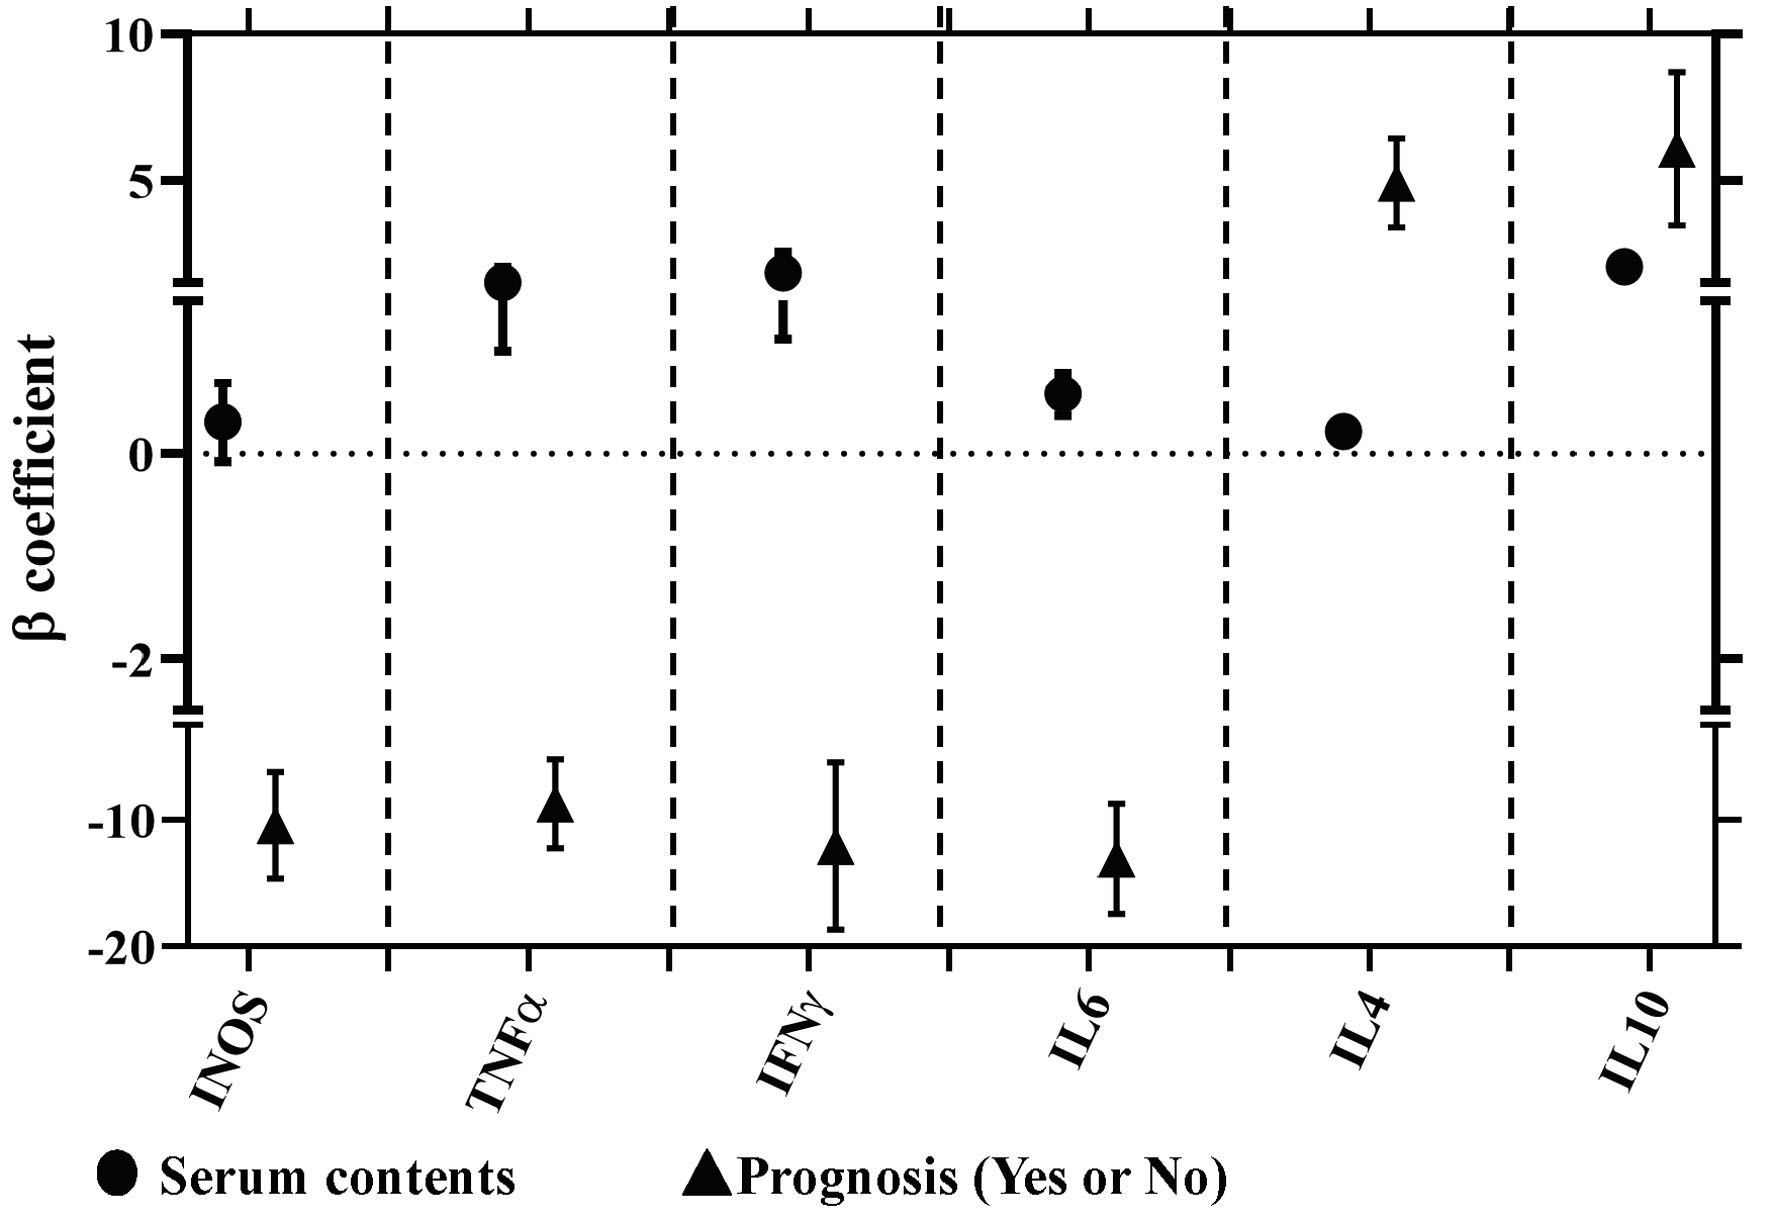
Figure 3. Correlations between the mRNA expressions in the gastric mucosa with their concentrations of serum cytokines and the prognosis of CAG using the multiple linear regression models. Circle represents the correlations between the concentrations of serum cytokines and related mRNA expression in the gastric mucosa. Triangle represents the correlations between the expressions of mRNA expressions in the gastric mucosa and the prognosis of CAG. Meanwhile, the positive, negative and no correlations were respectively represented by the β coefficient with more than zero (positive correlation), less than zero (negative correlation) and cross zero (no correlation).

Tables

Table 1. Primer Sequences of Related Genes for RT-PCR
 
GeneForward primer (5’-3’)Reverse primer (5’-3’)
Arg-1: arginase-1; IFN-γ: interferon-γ; IL-1β: interleukin-1β; iNOS: inducible nitric oxide synthase; TNF-α: tumor necrosis factor-alpha.
iNOSTTCAGTATCACAACCTCAGCAAGTGGACCTGCAAGTTAAAATCCC
IFN-γTCGGTAACTGACTTGAATGTCCATCGCTTCCCTGTTTTAGCTGC
IL-1βATGATGGCTTATTACAGTGGCAAGTCGGAGATTCGTAGCTGGA
TNF-αCCTCTCTCTAATCAGCCCTCTGGAGGACCTGGGAGTAGATGAG
IL-6ACTCACCTCTTCAGAACGAATTGCCATCTTTGGAAGGTTCAGGTTG
Arg-1GTGGAAACTTGCATGGACAACAATCCTGGCACATCGGGAATC
IL-4CCAACTGCTTCCCCCTCTGTCTGTTACGGTCAACTCGGTG
IL-10GACTTTAAGGGTTACCTGGGTTGTCACATGCGCCTTGATGTCTG
β-actinCATGTACGTTGCTATCCAGGCCTCCTTAATGTCACGCACGAT


Table 2. Characteristics of the Subjects in Each Group
 
IndicatorsGroup 1 (n = 60)Group 2 (n = 60)Group 3 (n = 60)P*
Smoking status referred to suck at least one cigar per day and last more than 1 year, and smoking quit but less than 1 year was also included. Drinking status was definitive as weekly drinking more than three times. Group 1: control group with health subjects. Group 2: chronic atrophic gastritis (CAG) patients without H. pylori infection. Group 3: H. pylori-associated CAG patients. *χ2 test was used to compare the gender, smoking, drinking, types of CAG and prognosis of CAG in these three groups. The difference of age was compared by Mann-Whitney U-test, while one-way analysis of variance (ANOVA) was performed to compare the means of height, weight and BMI among these three groups. And the atrophy severity scores were determined between the groups 2 and 3 using the t-test. BMI: body mass index; IQR: interquartile distance.
Age (years) (mean, IQR)46 (34 - 52)48 (36 - 62)43 (37 - 62)0.945
Male (n, %)39 (65.00)42 (70.00)38 (63.34)0.806
Height (cm)174.07 ± 21.05173.53 ± 15.64174.08 ± 18.550.994
Weight (kg)73.15 ± 8.0175.08 ± 6.8269.34 ± 5.490.226
BMI (kg/m2)24.17 ± 3.1524.93 ± 2.8422.88 ± 2.040.145
Smoking (n, %)29 (48.33)32 (53.33)27 (45.00)0.825
Drinking (n, %)28 (46.67)27 (45.00)32 (53.33)0.746
Types-38 (63.33)34 (56.67)0.854
  Mild (%)
  Moderate/severe (%)-22 (36.67)26 (43.33)
Atrophy severity scores-1.47 ± 0.341.58 ± 0.320.241
Prognosis-< 0.001
  Yes (n, %)57 (95.00)39 (65.00)
  No (n, %)-3 (5.00)21 (35.00)