Figures
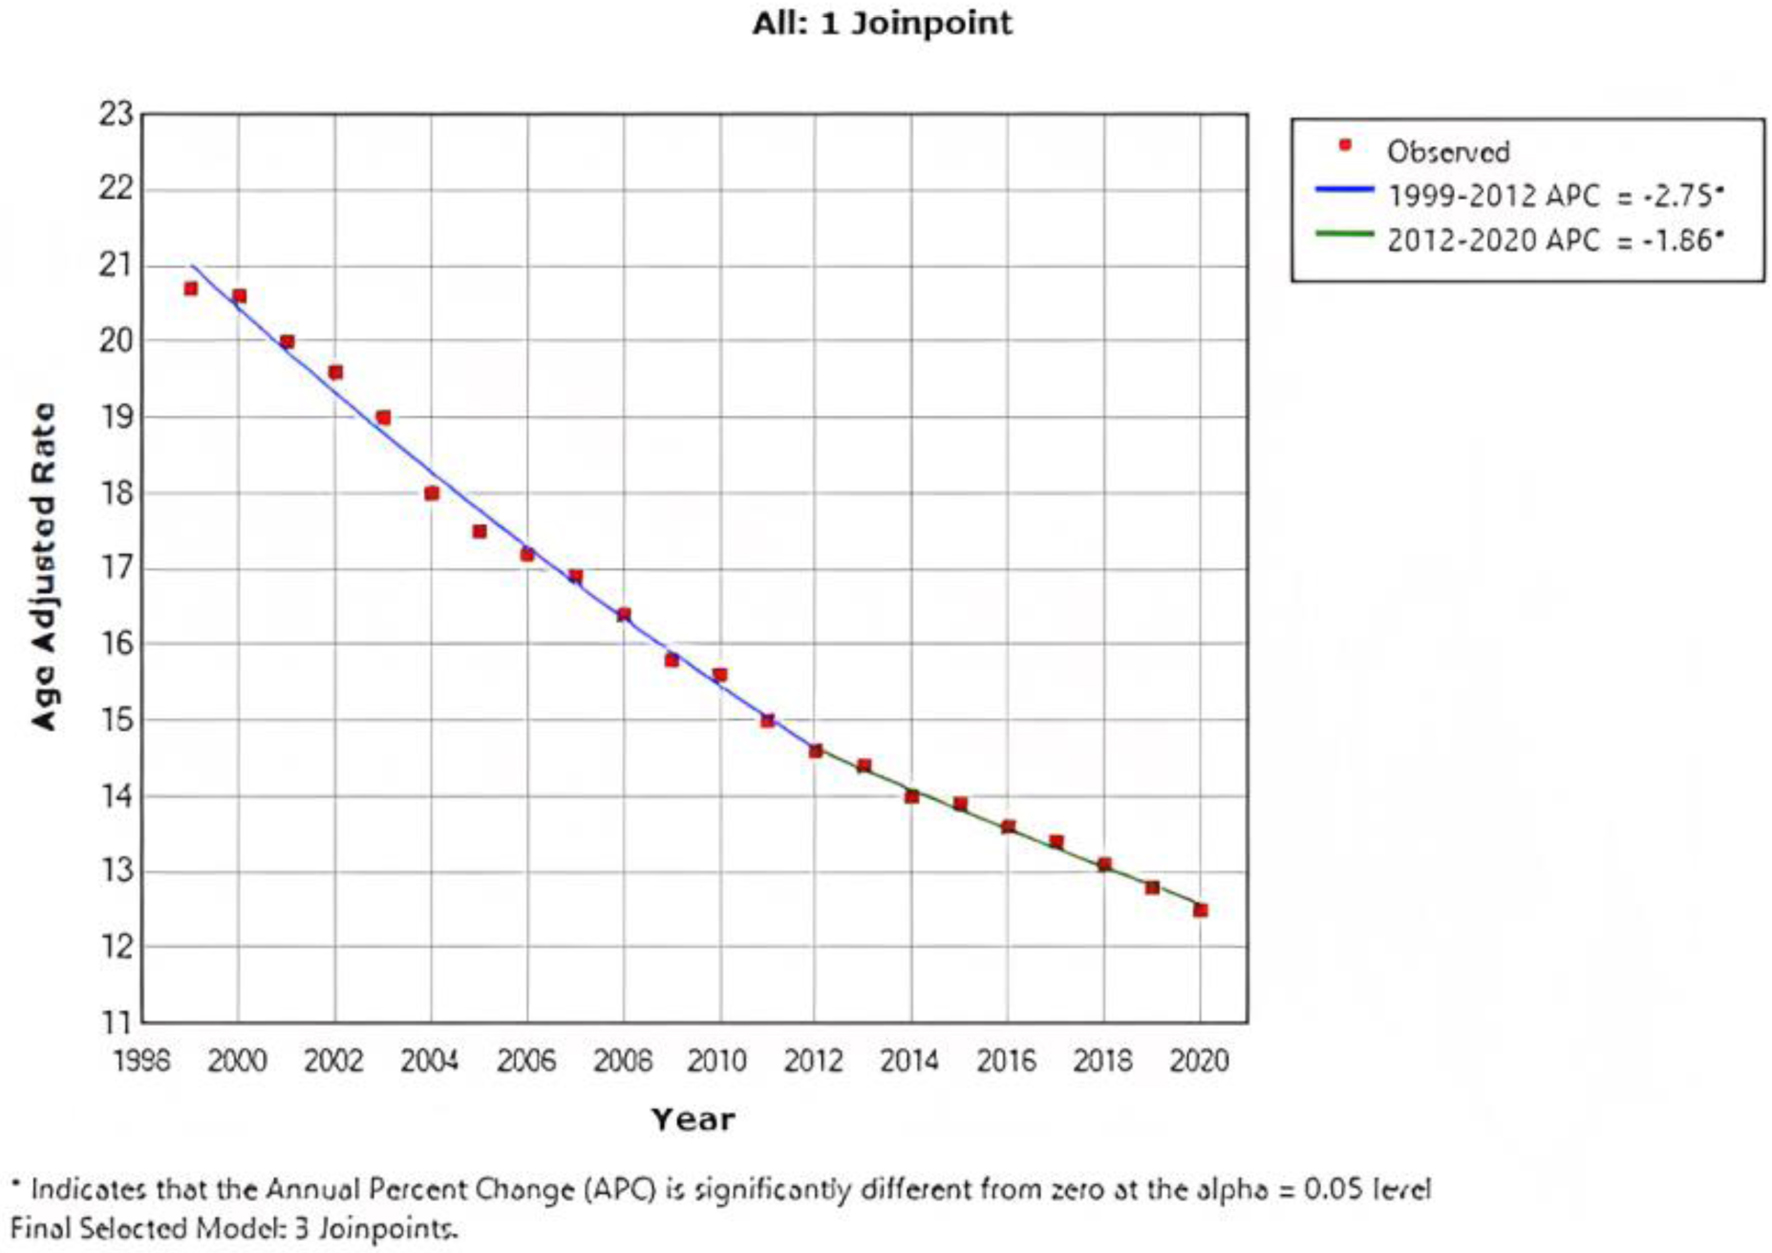
Figure 1. Combined AAMR for both males and females. AAMR is represented on y-axis, while x-axis indicates the years spanning from 1999 to 2020. This graph demonstrates a consistent decrease in the AAMR for CRC from 20.7 per 100,000 population in 1999 to 12.5 per 100,000 population in 2020, indicating a significant improvement in the AAMR for CRC over the specified time period. AAMR: age-adjusted mortality rate; CRC: colorectal cancer.
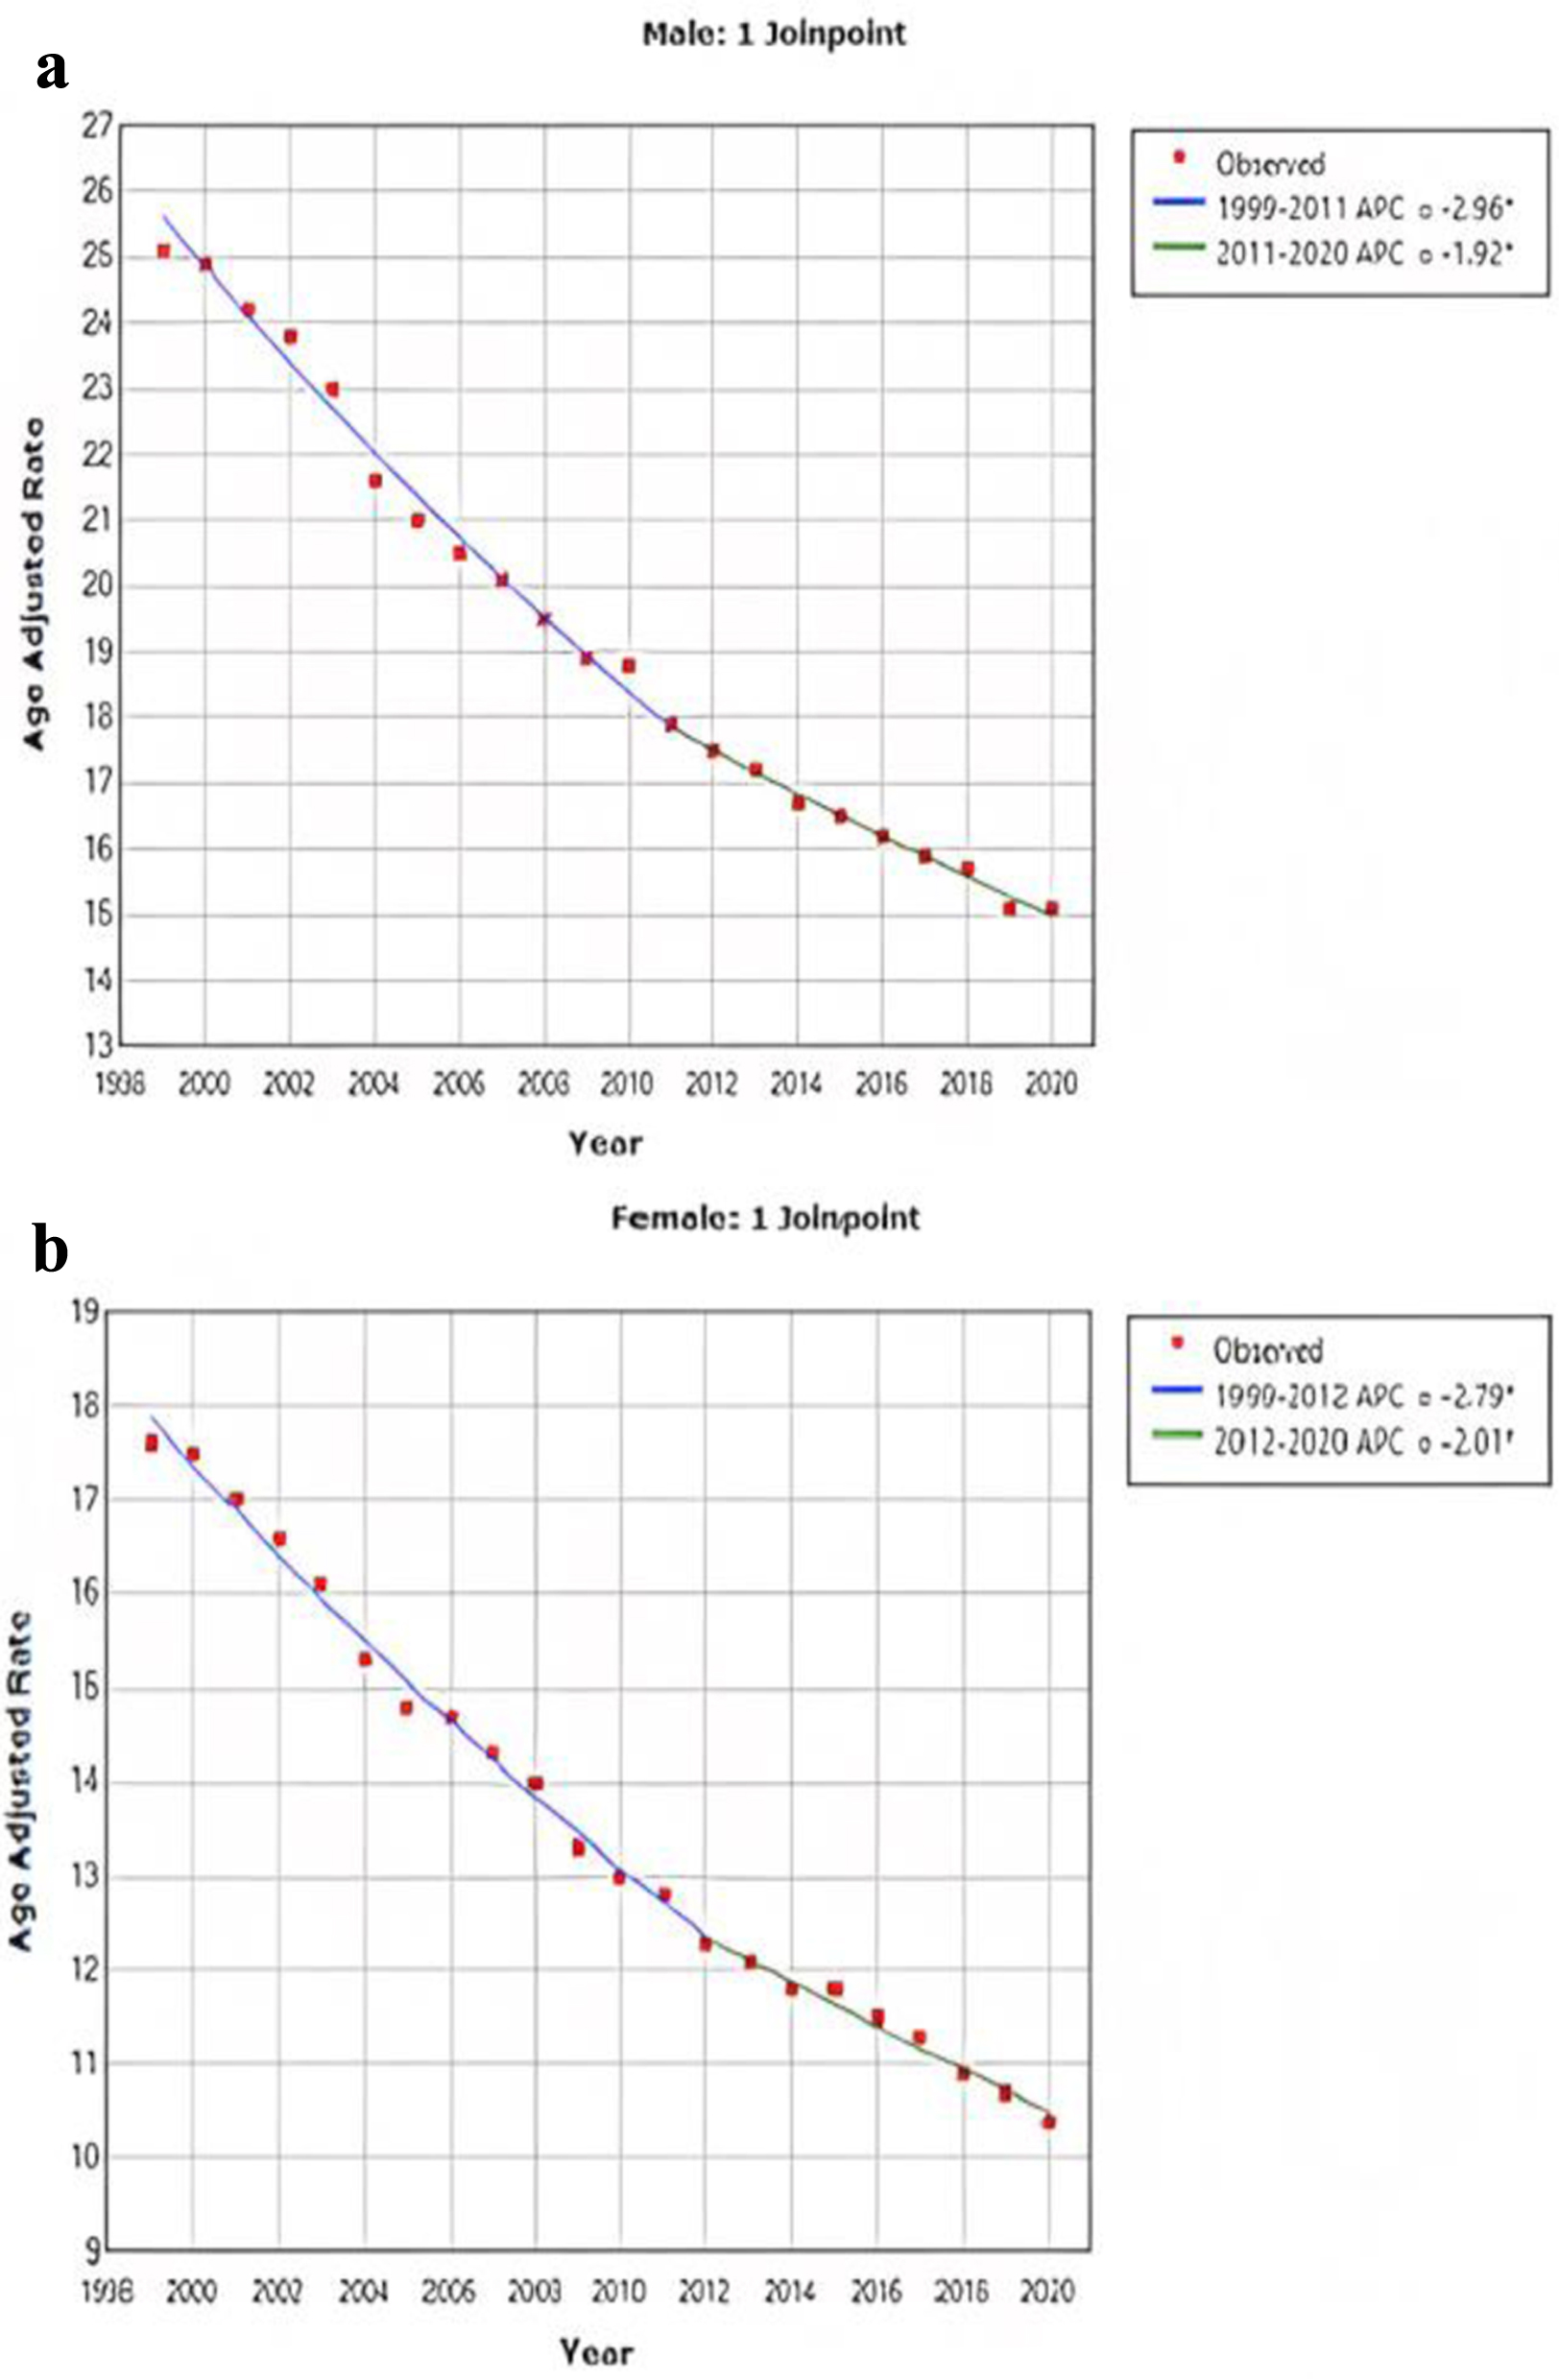
Figure 2. AAMR for CRC is stratified for male (a) and female (b). Y-axis on both graphs represents AAMR, while x-axis represents the years spanning from 1999 to 2020. Both graphs demonstrate a significant improvement in the AAMR. For men, the AAMR decreased from 25.1 to 15.1, and for women, it decreased from 17.6 to 10.4. AAMR: age-adjusted mortality rate; CRC: colorectal cancer.
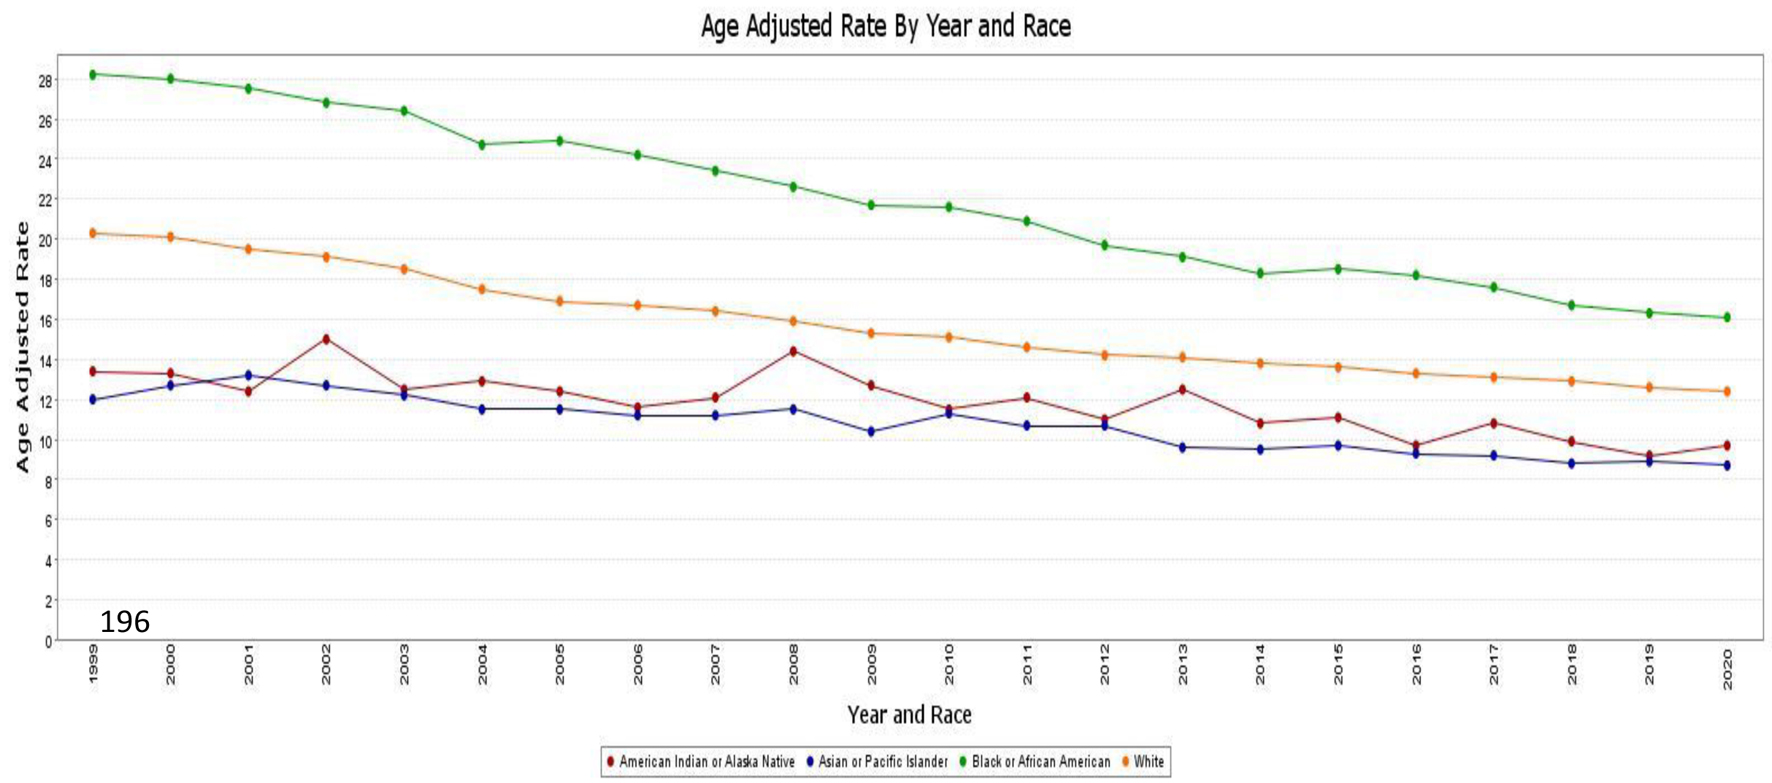
Figure 3. AAMR associated with CRC is stratified by race/ethnicity, with x-axis representing the year and race and y-axis indicating the AAMR. Green line: African American patients (AAMR decreased from 28.2 in 1999 to 16.1 in 2020). Orange line: White patients (AAMR decreased from 20.3 in 1999 to 12.4 in 2020). Red line: American Indian or Alaska native patients (AAMR decreased from 13.4 in 1999 to 9.7 in 2020). Blue line: Asian and Pacific Islander patients (AAMR decreased from 12 in 1999 to 8.7 in 2020). AAMR: age-adjusted mortality rate; CRC: colorectal cancer.
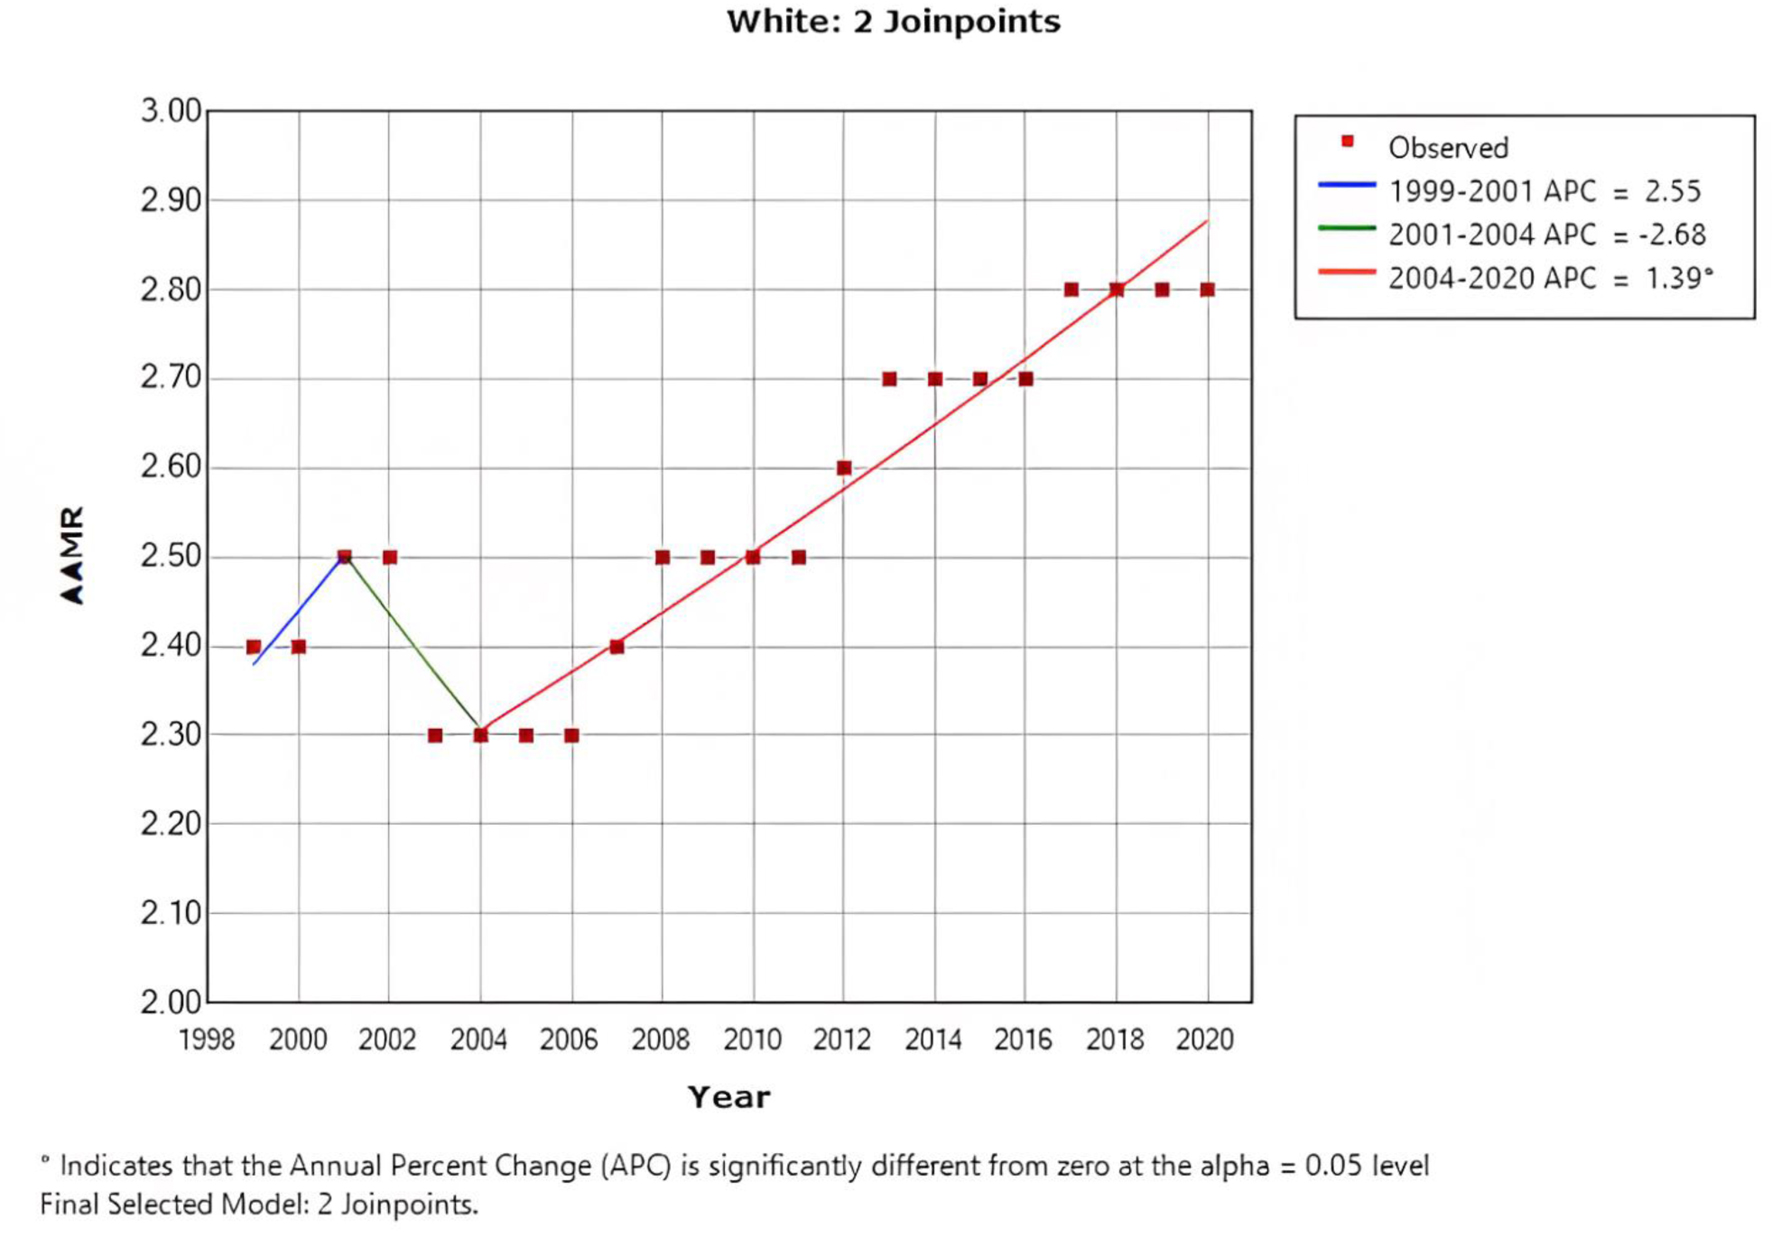
Figure 4. AAMR in white patients below the age of < 55 years, indicating an increase in the mortality rate from 2.4 to 2.8. AAMR: age-adjusted mortality rate.