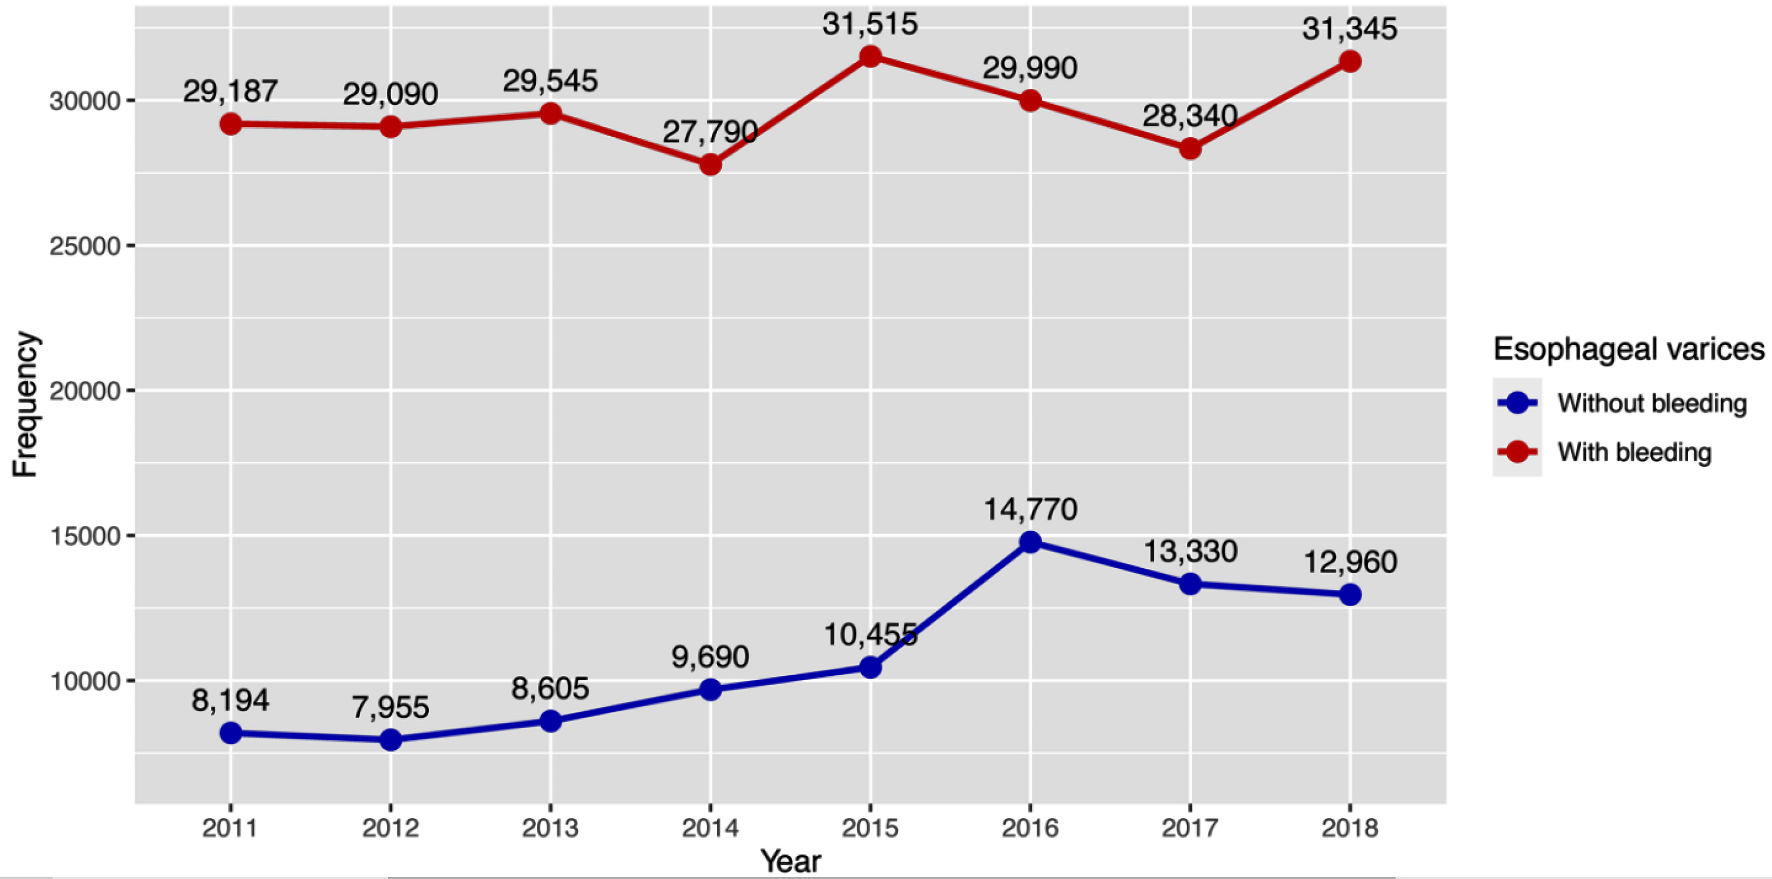
Figure 1. Trend of hospital admissions of esophageal varices with and without bleeding.
| Gastroenterology Research, ISSN 1918-2805 print, 1918-2813 online, Open Access |
| Article copyright, the authors; Journal compilation copyright, Gastroenterol Res and Elmer Press Inc |
| Journal website https://www.gastrores.org |
Original Article
Volume 16, Number 3, June 2023, pages 171-183
Trends in Hospitalizations of Esophageal Varices From 2011 to 2018: A United States Nationwide Study
Figures
Tables
| Characteristics | EV without bleeding | EV with bleeding | P value |
|---|---|---|---|
| EV: esophageal varices; SD: standard deviation. | |||
| Total number (weighted) | 85,959 | 236,802 | |
| Age (mean (SD)) | 57.83 (11.96) | 57.80 (13.52) | 0.762 |
| Female (%) | 31,390 (36.5) | 78,693 (33.2) | < 0.001 |
| Race (%) | < 0.001 | ||
| White | 54,281 (66) | 149,284 (66.1) | |
| Black | 6,306 (7.7) | 17,926 (7.9) | |
| Hispanic | 16,621 (20.2) | 42,085 (18.6) | |
| Others | 5,086 (6.3) | 16,459 (7.3) | |
| Expected primary payer (%) | < 0.001 | ||
| Medicare | 35,073 (40.9) | 89,665 (38) | |
| Medicaid | 20,241 (23.6) | 53,690 (22.7) | |
| Private insurance | 20,602 (24.0) | 56,264 (23.8) | |
| Self-pay/others/no charge | 9,787 (11.4) | 36,530 (15.5) | |
| Median household income for patients ZIP code (%) | < 0.001 | ||
| 0 to 25th percentile | 27,056 (32.4) | 79,344 (34.4) | |
| 26th to 50th percentile | 22,258 (26.6) | 61,760 (26.8) | |
| 51st to 75th percentile | 19,750 (23.6) | 52,120 (22.6) | |
| 76th to 100th percentile | 14,494 (17.3) | 37,116 (16.1) | |
| Weighted Elixhauser comorbidity (mean (SD)) | 16.13 (18.2) | 20 (19.78) | < 0.001 |
| Sepsis | 1,103 (1.3) | 5,805 (2.5) | < 0.001 |
| Acute kidney injury | 7,033 (8.2) | 43,897 (18.5) | < 0.001 |
| Weekend admissions (%) | 18,971 (22.1) | 60,791 (25.7) | < 0.001 |
| Location/teaching status of hospital | < 0.001 | ||
| Rural | 13,122 (15.2) | 33,243 (14.0) | |
| Urban nonteaching | 23,202 (26.9) | 69,308 (29.2) | |
| Urban teaching | 49,792 (57.8) | 134,671 (56.8) | |
| Bed size of the hospital (%) | < 0.001 | ||
| Small | 13,122 (15.2) | 33,243 (14.0) | |
| Medium | 23,202 (26.9) | 69,308 (29.2) | |
| Large | 49,792 (57.8) | 134,671 (56.8) | |
| Region of the hospital (%) | < 0.001 | ||
| Northeast | 16,077 (18.6) | 35,168 (14.8) | |
| Midwest | 16,116 (18.7) | 40,737 (17.1) | |
| South | 33,752 (39.1) | 105,821 (44.5) | |
| West | 20,300 (23.5) | 5,615 (23.6) | |
| Comorbidity | EV without bleeding | EV with bleeding | P value |
|---|---|---|---|
| EV: esophageal varices; SD: standard deviation; AIDS: acquired immunodeficiency syndrome; HIV: human immunodeficiency virus. | |||
| Weighted Elixhauser score (mean (SD)) | 16.13 (18.2) | 20 (19.78) | < 001 |
| Congestive heart failure (%) | 13,686 (15.9) | 44,087 (18.6) | < 0.001 |
| Cardiac arrhythmias (%) | 17,023 (19.8) | 58,266 (24.6) | < 0.001 |
| Valvular heart disease (%) | 10,881 (12.7) | 34,611 (14.6) | < 0.001 |
| Pulmonary circulation disorders (%) | 9,970 (11.6) | 32,580 (13.8) | < 0.001 |
| Peripheral vascular disorders (%) | 11,032 (12.8) | 36,238 (15.3) | < 0.001 |
| Uncomplicated hypertension (%) | 40,524 (47.1) | 106,297 (44.9) | < 0.001 |
| Complicated hypertension (%) | 15,614 (18.2) | 49,574 (20.9) | < 0.001 |
| Paralysis (%) | 7,273 (8.5) | 25,394 (10.7) | < 0.001 |
| Other neurological disorders (%) | 12,296 (14.3) | 45,828 (19.4) | < 0.001 |
| Chronic pulmonary disease (%) | 21,949 (25.5) | 59,993 (25.3) | 0.717 |
| Uncomplicated diabetes (%) | 27,834 (32.4) | 76,129 (32.1) | 0.67 |
| Complicated diabetes (%) | 17,474 (20.3) | 48,838 (20.6) | 0.586 |
| Hypothyroidism (%) | 17,514 (20.4) | 49,443 (20.9) | 0.354 |
| Renal failure (%) | 16,493 (19.2) | 52,400 (22.1) | < 0.001 |
| Liver disease (%) | 85,959 (100) | 207,942 (87.8) | < 0.001 |
| Peptic ulcer disease (%) | 11,560 (13.4) | 40,648 (17.2) | < 0.001 |
| AIDS/HIV (%) | 5,459 (6.4) | 18,627 (7.9) | 0.001 |
| Lymphoma (%) | 5,539 (6.4) | 22,604 (9.5) | < 0.001 |
| Metastatic cancer (%) | 8,478 (9.9) | 34,028 (14.4) | < 0.001 |
| Solid tumor without metastasis (%) | 12,018 (14) | 44,755 (18.9) | < 0.001 |
| Rheumatic disease (%) | 9,825 (11.4) | 32,968 (13.9) | < 0.001 |
| Coagulopathy (%) | 37,934 (44.1) | 120,617 (50.9) | < 0.001 |
| Obesity (%) | 17,217 (20) | 47,954 (20.3) | 0.684 |
| Weight loss (%) | 12,230 (14.2) | 50,634 (21.4) | < 0.001 |
| Fluid and electrolytes disorders (%) | 32,524 (37.8) | 116,208 (49.1) | < 0.001 |
| Blood loss anemia (%) | 12,143 (14.1) | 49,675 (21) | < 0.001 |
| Deficiency anemia (%) | 15,883 (18.5) | 40,592 (17.1) | 0.015 |
| Alcohol abuse | 49,894 (58) | 142,227 (60.1) | < 0.001 |
| Drug abuse (%) | 14,397 (16.7) | 45,745 (19.3) | < 0.001 |
| Psychoses (%) | 9,198 (10.7) | 30,960 (13.1) | < 0.001 |
| Depression (%) | 21,209 (24.7) | 54,712 (23.1) | 0.004 |
| Year | 2011 | 2012 | 2013 | 2014 | 2015 | 2016 | 2017 | 2018 | P value |
|---|---|---|---|---|---|---|---|---|---|
| SD: standard deviation. | |||||||||
| Total number (weighted) | 37,381 | 37,045 | 38,150 | 37,480 | 41,970 | 44,760 | 41,670 | 44,305 | |
| Esophageal varices (%) | < 0.001 | ||||||||
| With bleeding | 29,187 (78.1) | 29,090 (78.5) | 29,545 (77.4) | 27,790 (74.1) | 31,515 (75.1) | 29,990 (67) | 28,340 (68) | 31,345 (70.7) | |
| Without bleeding | 819 (21.9) | 7,955 (21.5) | 8,605 (22.6) | 9,690 (25.9) | 10,455 (24.9) | 14,770 (33) | 13,330 (32) | 12,960 (29.3) | |
| Age (mean (SD)) | 58.65 (14.25) | 58.27 (13.82) | 58.49 (13.62) | 58.49 (13.36) | 57.97 (13.13) | 56.93 (129) | 56.92 (12.36) | 57.10 (12.43) | < 0.001 |
| Female (%) | 12,968.1 (34.7) | 12,685 (34.2) | 12,925 (33.9) | 12,910 (34.5) | 14,330 (34.2) | 15,125 (33.8) | 14,275 (34.3) | 14,865 (33.6) | 0.877 |
| Race (%) | < 0.001 | ||||||||
| White | 23,284.3 (67.6) | 23,830 (67.7) | 24,490 (67.8) | 24,095 (67.6) | 26,265 (65.6) | 27,545 (64.2) | 26,160 (64.8) | 27,895 (64.3) | |
| Black | 3,056.8 (8.9) | 2,990 (8.5) | 3,380 (9.4) | 3,110 (8.7) | 3,210 (8) | 3,150 (7.3) | 2,510 (6.2) | 2,825 (6.5) | |
| Hispanic | 6,161.4 (17.9) | 5,815 (16.5) | 5,895 (16.3) | 6,100 (17.1) | 7,780 (19.4) | 9,105 (21.2) | 8,815 (21.9) | 9,035 (20.8) | |
| Others | 1,939.1 (5.6) | 2,540 (7.2) | 2,370 (6.6) | 2,360 (6.6) | 2,785 (7) | 3,100 (7.2) | 2,855 (7.1) | 3,595 (8.3) | |
| Expected primary payer (%) | < 0.001 | ||||||||
| Medicare | 15,342.9 (41.2) | 15,555 (42.1) | 16,000 (42) | 15,410 (41.3) | 16,270 (38.9) | 15,880 (35.5) | 14,520 (34.9) | 15,760 (35.7) | |
| Medicaid | 6,716.2 (18.1) | 6,950 (18.8) | 7,375 (19.4) | 8,245 (22.1) | 10,265 (24.5) | 11,785 (26.4) | 11,010 (26.5) | 11,585 (26.2) | |
| Private insurance | 8,790.8 (23.6) | 8,070 (21.9) | 8,195 (21.5) | 8,580 (23) | 10,270 (24.5) | 11,400 (25.5) | 10,450 (25.1) | 11,110 (25.1) | |
| Self-pay/others | 6,356.5 (17.1) | 6,340 (17.2) | 6,515 (17.1) | 5,120 (13.7) | 5,065 (12.1) | 5,610 (12.6) | 5,580 (13.4) | 5,730 (13) | |
| Median household income for patients ZIP code (%) | < 0.010 | ||||||||
| 0 to 25th percentile | 11,739.7 (32.2) | 12,720 (35.4) | 12,735 (34.4) | 12,320 (33.9) | 14,015 (34.4) | 15,300 (35.1) | 13,770 (33.9) | 13,800 (32.1) | |
| 26th to 50th percentile | 9,588.2 (26.3) | 9,220 (25.6) | 10,015 (27) | 10,545 (29) | 10,250 (25.1) | 11,250 (25.8) | 10,880 (26.8) | 12,270 (28.5) | |
| 51st to 75th percentile | 8,890.8 (24.4) | 8,015 (22.3) | 8,600 (23.2) | 7,695 (21.1) | 9,440 (23.2) | 9,715 (22.3) | 9,770 (24.1) | 9,745 (22.6) | |
| 76th to 100th percentile | 6,279.7 (17.2) | 6,005 (16.7) | 5,685 (15.4) | 5,825 (16) | 7,070 (17.3) | 7,385 (16.9) | 6,140 (15.1) | 7,220 (16.8) | |
| Sepsis | 447.9 (1.2) | 425 (1.1) | 465 (1.2) | 540 (1.4) | 820 (2) | 1,495 (3.3) | 1195 (2.9) | 1,520 (3.4) | < 0.001 |
| Acute kidney injury | 5,108.8 (13.7) | 5,555 (15) | 6,220 (16.3) | 6,190 (16.5) | 6,910 (16.5) | 6,840 (15.3) | 6,425 (15.4) | 7,505 (16.9) | < 0.001 |
| Location/teaching status of hospital | < 0.001 | ||||||||
| Rural | 3,148.1 (8.6) | 3,200 (8.6) | 3,650 (9.6) | 2,675 (7.1) | 2,495 (5.9) | 2,895 (6.5) | 2,730 (6.6) | 2,600 (5.9) | |
| Urban nonteaching | 16,043.2 (43.8) | 13,905 (37.5) | 14,225 (37.3) | 9,980 (26.6) | 11,530 (27.5) | 12,205 (27.3) | 9,855 (23.7) | 9,185 (20.7) | |
| Urban teaching | 17,427.2 (47.6) | 19,940 (53.8) | 20,275 (53.1) | 24,825 (66.2) | 27,945 (66.6) | 29,660 (66.3) | 29,085 (69.8) | 32,520 (73.4) | |
| Bed size of the hospital (%) | < 0.001 | ||||||||
| Small | 2,934.4 (8) | 4,210 (11.4) | 4,065 (10.7) | 6,130 (16.4) | 6,440 (15.3) | 7,245 (16.2) | 7,065 (17) | 8,000 (18.1) | |
| Medium | 8,728.8 (23.8) | 10,420 (28.1) | 10,650 (27.9) | 11,060 (29.5) | 12,510 (29.8) | 13,260 (29.6) | 12,705 (30.5) | 12,860 (29) | |
| Large | 24,955.4 (68.1) | 22,415 (60.5) | 23,435 (61.4) | 20,290 (54.1) | 23,020 (54.8) | 24,255 (54.2) | 21,900 (52.6) | 23,445 (52.9) | |
| Region of the hospital (%) | < 0.001 | ||||||||
| Northeast | 6,398.9 (17.1) | 6,340 (17.1) | 6,530 (17.1) | 6,310 (16.8) | 6,665 (15.9) | 7,020 (15.7) | 4,520 (10.8) | 7,090 (16) | |
| Midwest | 7,988.2 (21.4) | 6,230 (16.8) | 6,540 (17.1) | 6,730 (18) | 6,570 (15.7) | 7,380 (16.5) | 7,630 (18.3) | 7,460 (16.8) | |
| South | 15,663.1 (41.9) | 16,660 (45) | 17,260 (45.2) | 16,945 (45.2) | 17,005 (40.5) | 19,115 (42.7) | 18,265 (43.8) | 18,260 (41.2) | |
| West | 7,330.6 (19.6) | 7,815 (21.1) | 7,820 (20.5) | 7,495 (20) | 11,730 (27.9) | 11,245 (25.1) | 11,255 (27) | 11,495 (25.9) | |
| Outcomes/year | 2011 | 2012 | 2013 | 2014 | 2015 | 2016 | 2017 | 2018 | |
|---|---|---|---|---|---|---|---|---|---|
| LOS: length of stay; EV: esophageal varices; VNA: visiting nursing assistance; CI: confidence interval. | |||||||||
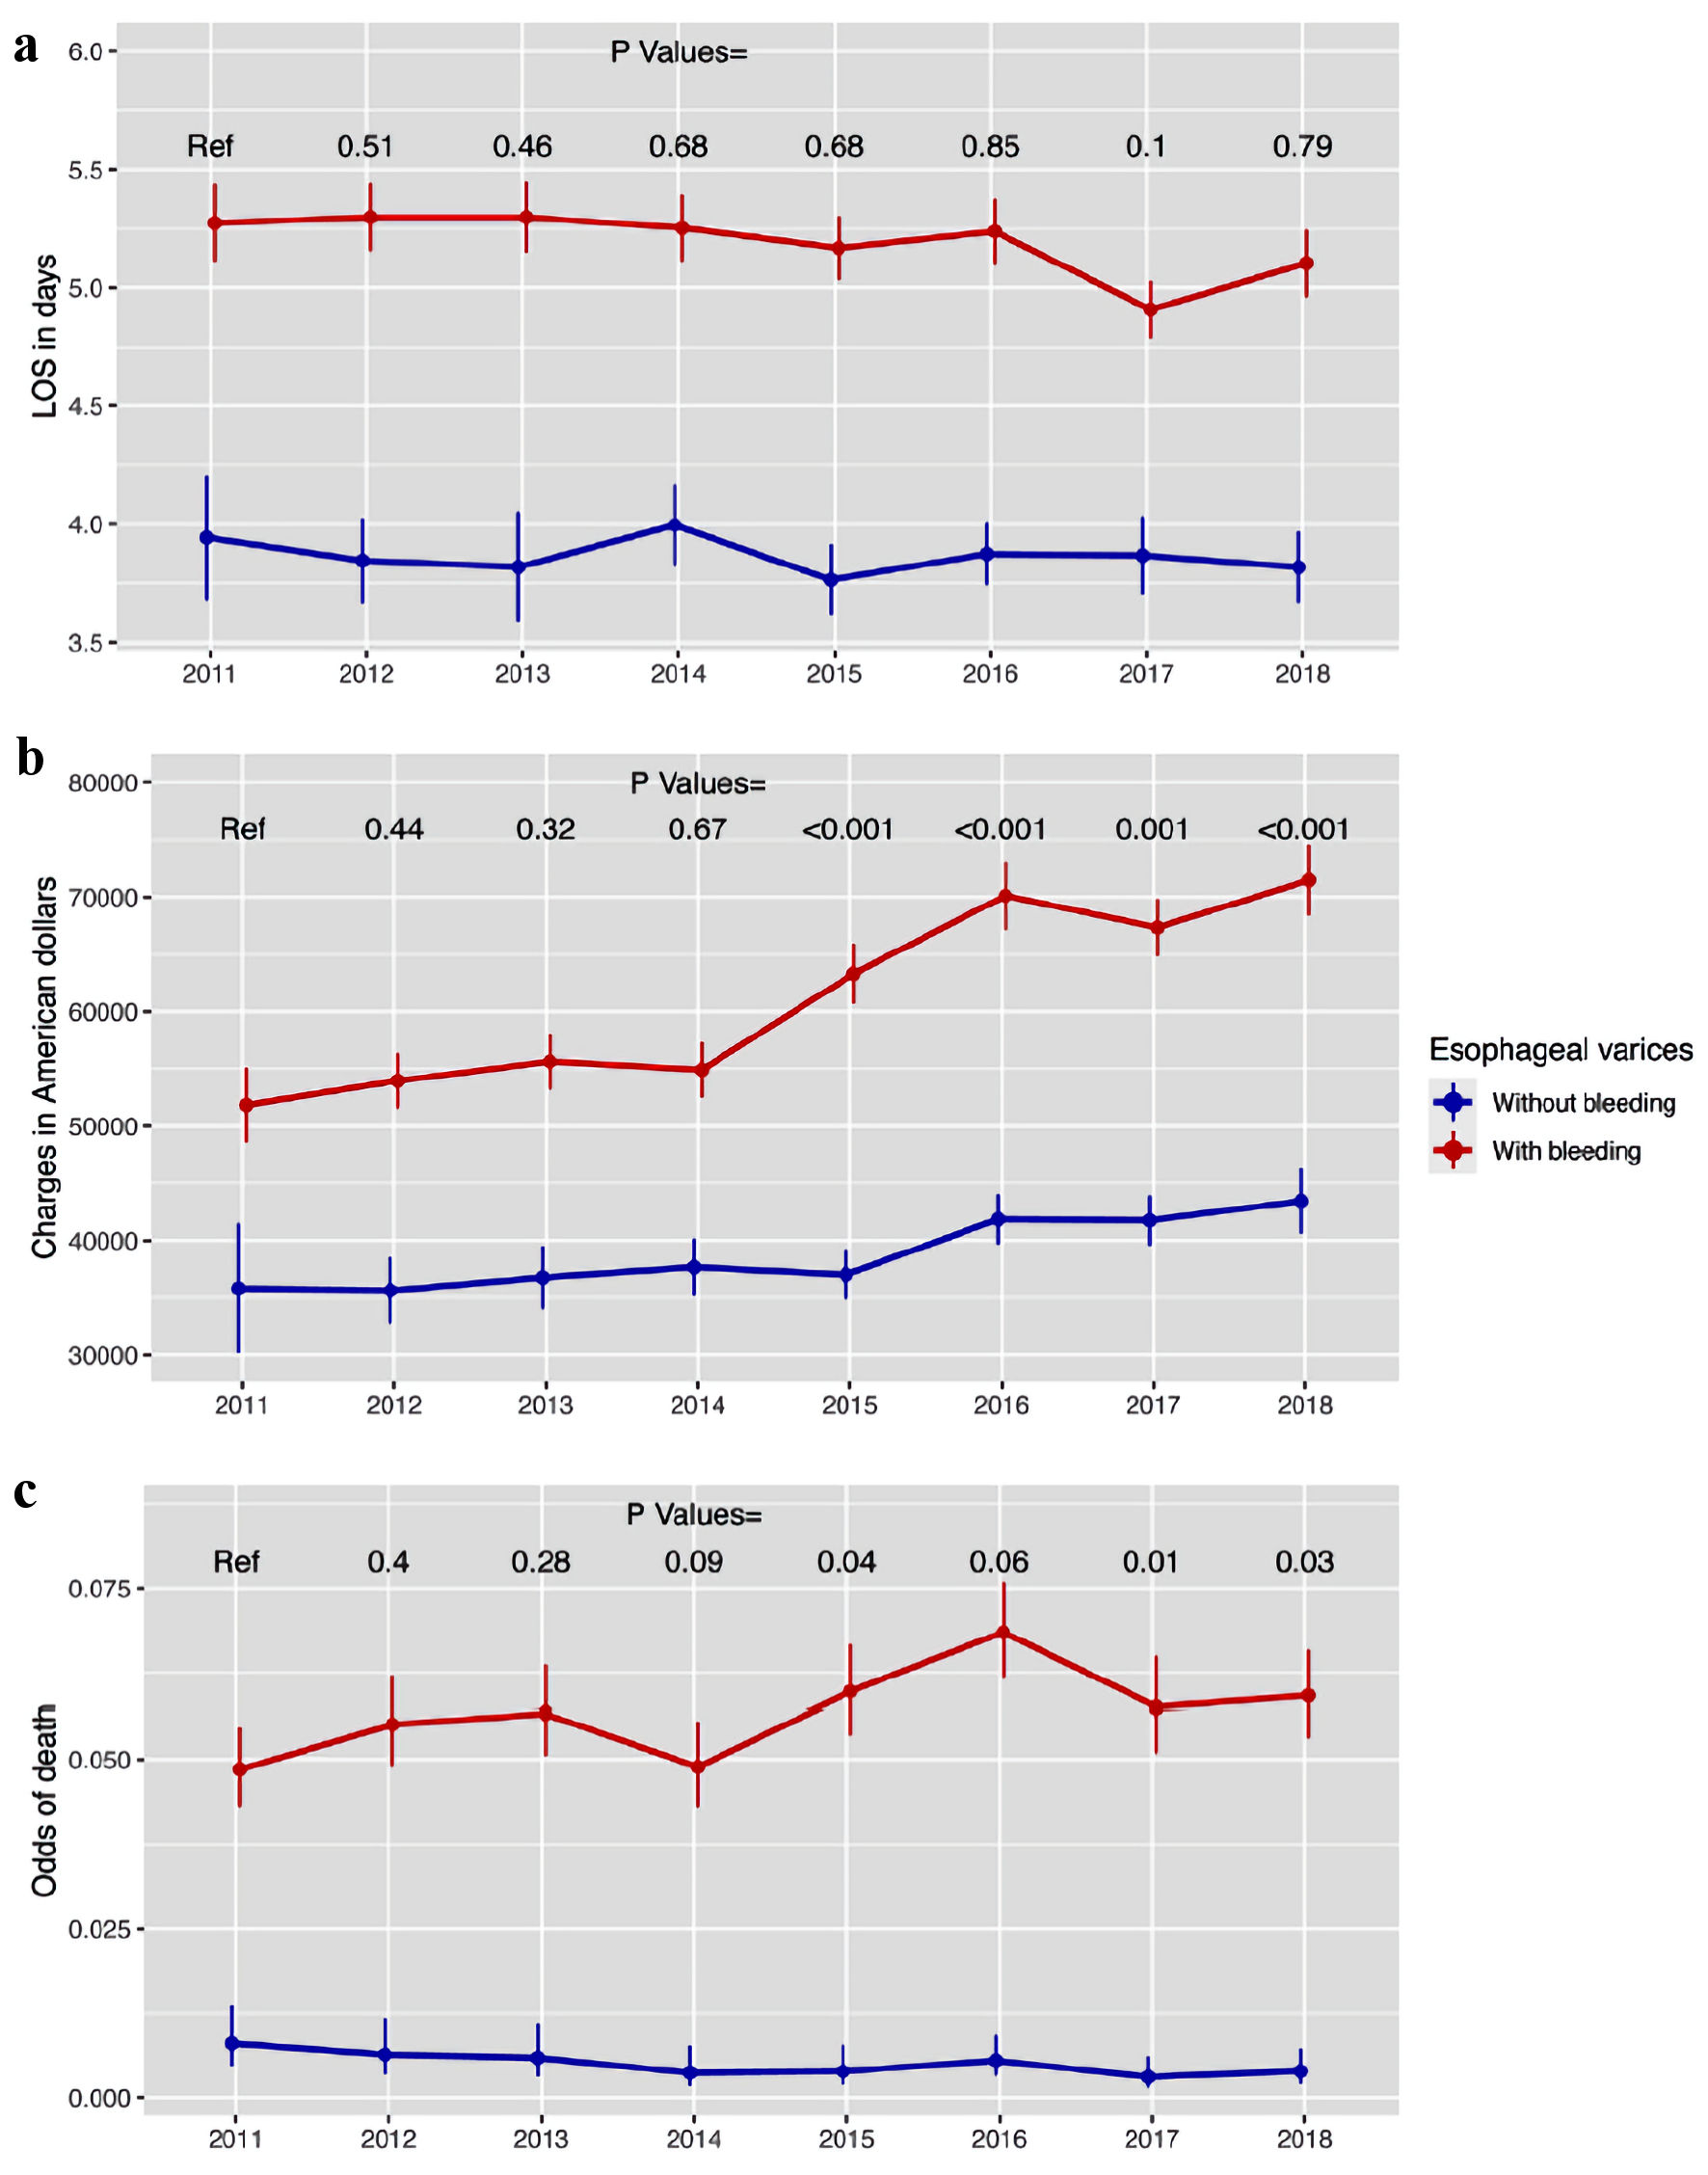
| LOS (days) (mean (95% CI)) | EVs with bleeding | 5.27 (5.11 - 5.44) | 5.3 (5.15 - 5.44) | 5.3 (5.15 - 5.45) | 5.25, (5.11 - 5.39) | 5.17 (5.03 - 5.3) | 5.24 (5.1 - 5.38) | 4.91 (4.79 - 5.03) | 5.1 (4.96 - 5.24) |
| EVs without bleeding | 3.94 (3.68 - 4.21) | 3.85 (3.67 - 4.02) | 3.82 (3.59 - 4.05) | 3.99, (3.83 - 4.16) | 3.76 (3.61 - 3.91) | 3.87 (3.74 - 4.01) | 3.87 (3.7 - 4.03) | 3.82 (3.67 - 3.97) | |
| Hospital charges ($) (mean (95% CI)) | EVs with bleeding | 51,839.98 (48,578.07 - 55,101.89) | 53,953.48 (51,555.32 - 56,351.64) | 55,633.86 (53,211.07 - 58,056.64) | 54,912.26, (52,501.92 - 57,322.6) | 63,297.49 (60,677.55 - 65,917.43) | 70,114.39 (67,114.6 - 73,114.19) | 67,328.94 (64,821.58 - 69,836.3) | 71,473.25 (68,378.91 - 74,567.59) |
| EVs without bleeding | 35,827.21 (30,163.75 - 41,490.67) | 35,649.92, (32,773.95 - 38,525.9) | 36,773.85 (34,042.04 - 39,505.66) | 37,672.14, (35,165.29 - 40,179) | 37,029.87 (34,889.26 - 39,170.47) | 41,856.72 (39,690.38 - 44,023.05) | 41,756.69 (39,579.09 - 43,934.29) | 43,452.13 (40630.1 - 46,274.15) | |
| Hospital mortality (odds (95% CI)) | EVs with bleeding | 0.049 (0.043 - 0.055) | 0.055 (0.049 - 0.062) | 0.057 (0.051 - 0.064) | 0.049 (0.043 - 0.056) | 0.06 (0.054 - 0.067) | 0.068 (0.062 - 0.076) | 0.058 (0.051 - 0.065) | 0.059 (0.053 - 0.066) |
| EVs without bleeding | 0.008 (0.005 - 0.014) | 0.006 (0.003 - 0.012) | 0.006 (0.003 - 0.011) | 0.004 (0.002 - 0.008) | 0.004 (0.002 - 0.008) | 0.005 (0.003 - 0.009) | 0.003 (0.002 - 0.006) | 0.004 (0.002 - 0.007) | |
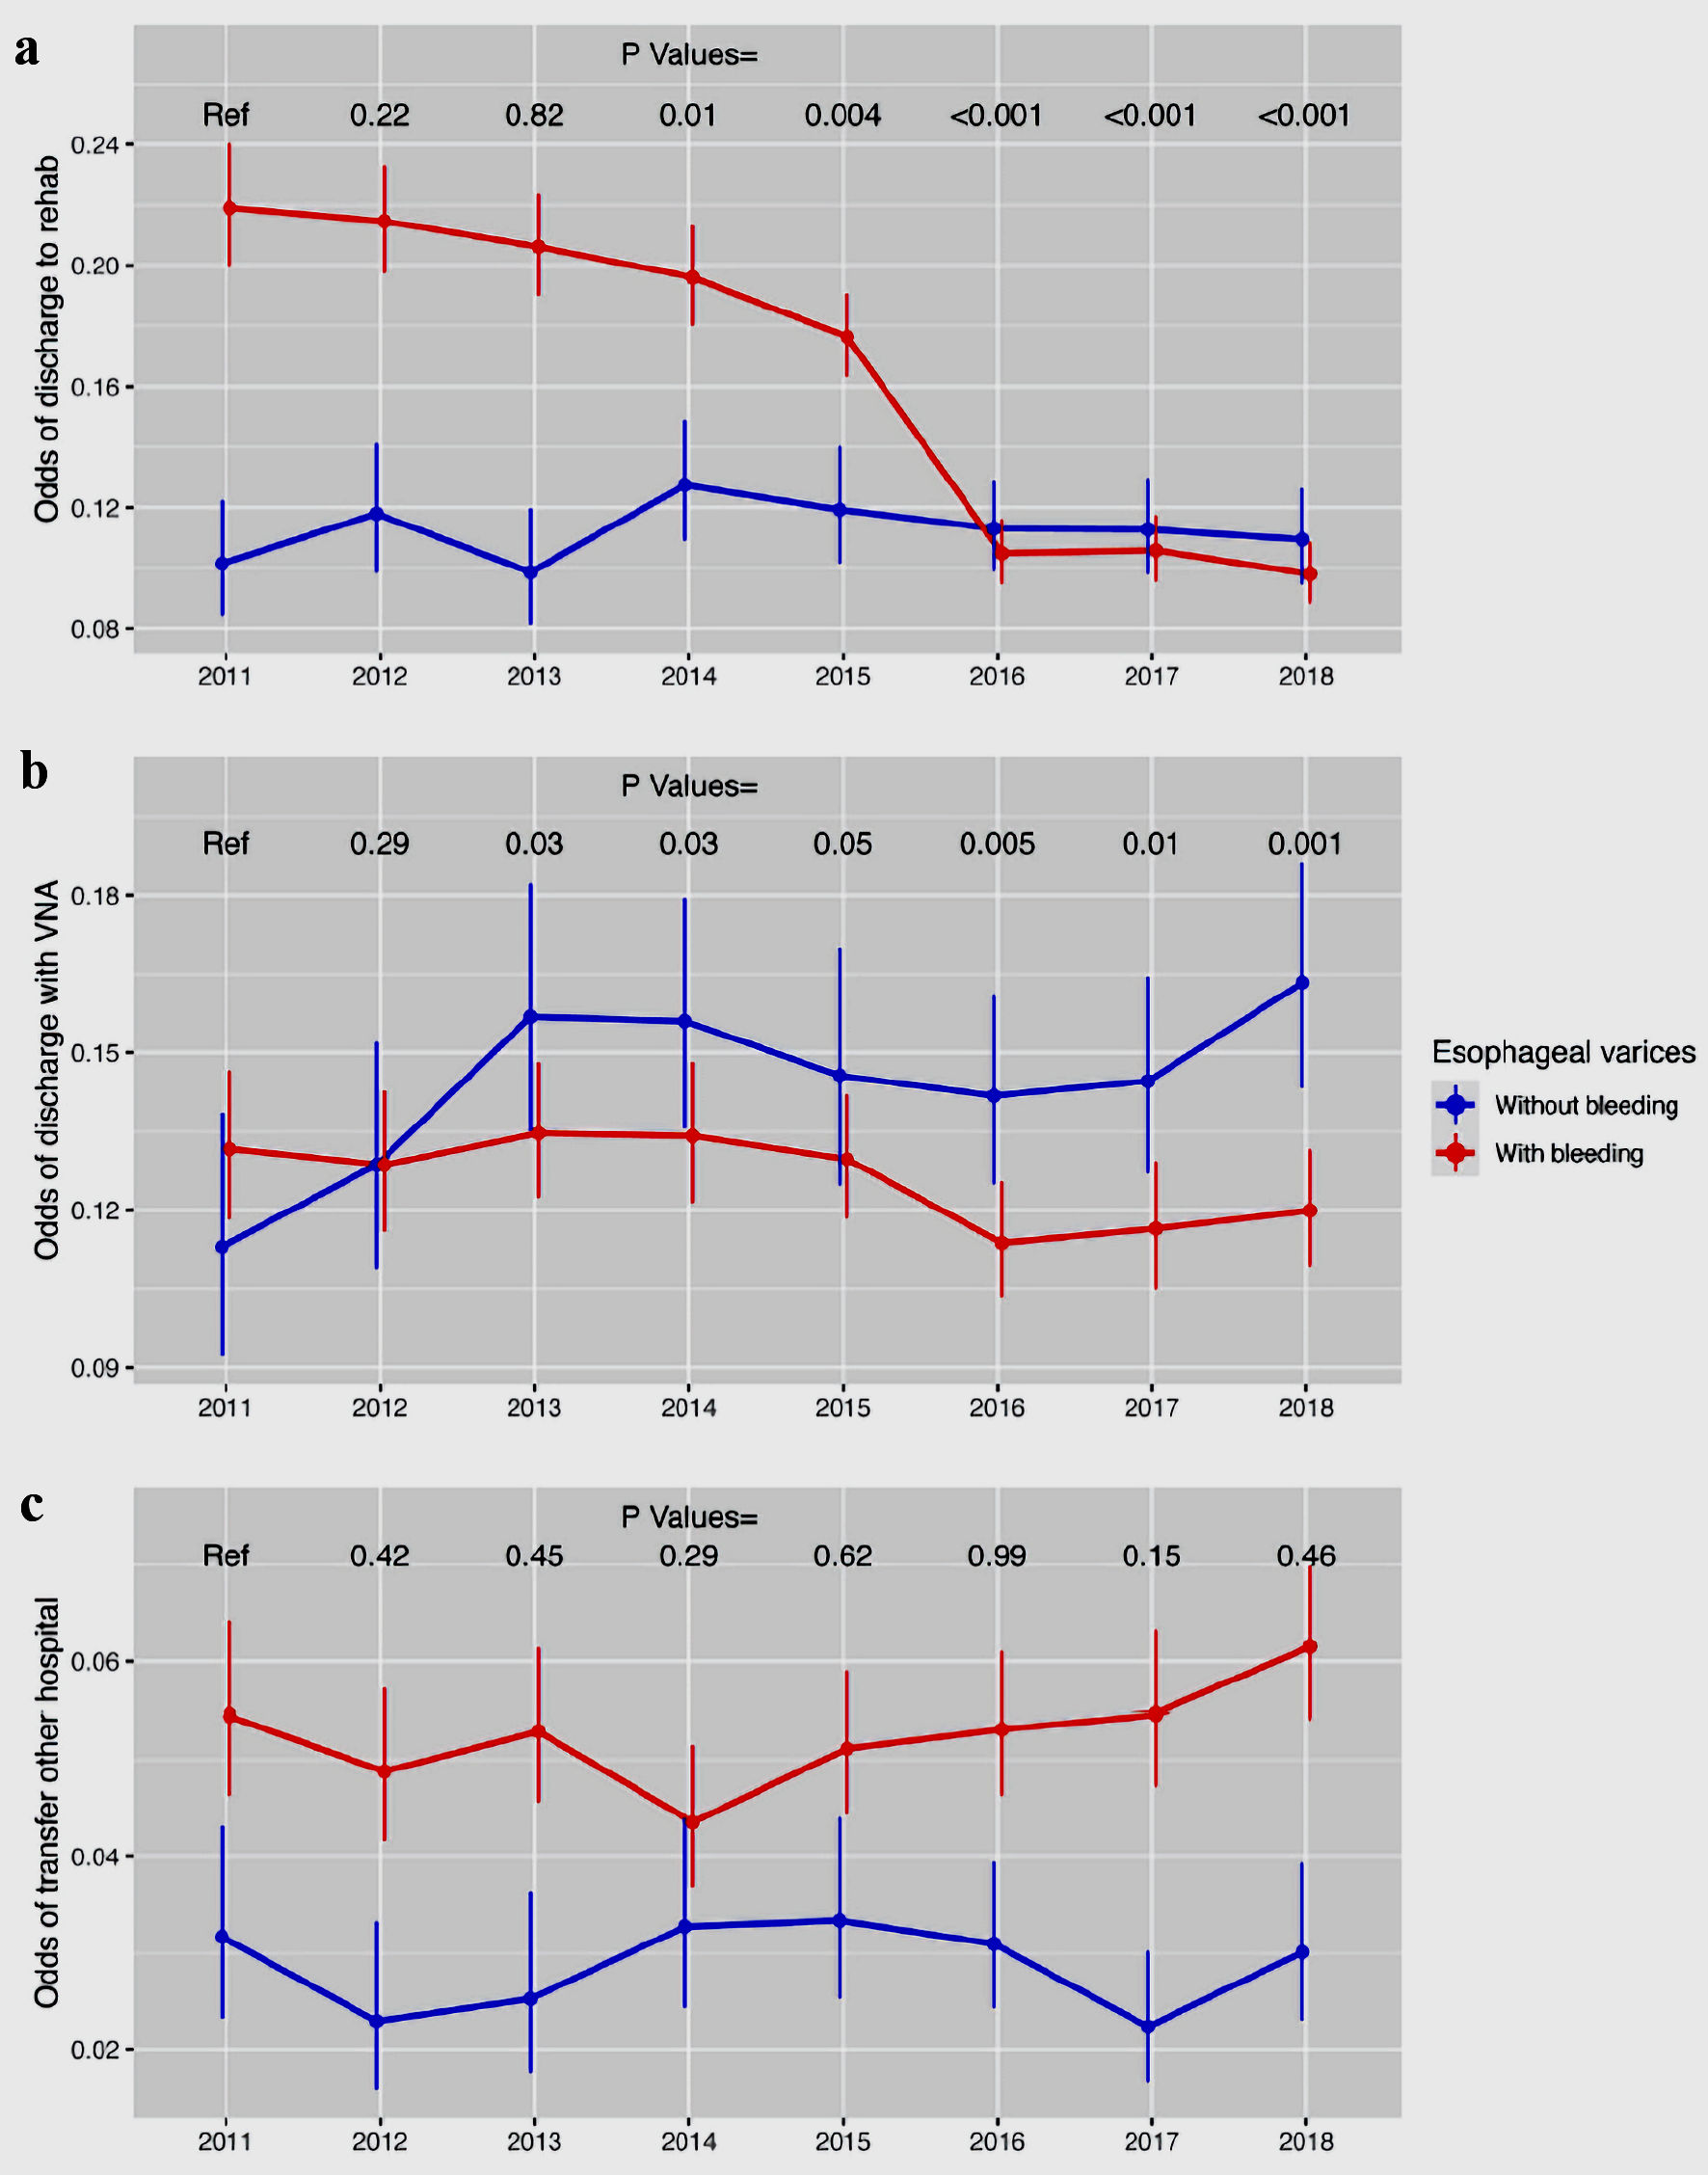
| Discharge to rehab (odds (95% CI)) | EVs with bleeding | 0.219 (0.2 - 0.24) | 0.215 (0.198 - 0.233) | 0.206 (0.19 - 0.224) | 0.196 (0.18 - 0.213) | 0.176 (0.163 - 0.191) | 0.105 (0.095 - 0.116) | 0.106 (0.095 - 0.117) | 0.098 (0.088 - 0.109) |
| EVs without bleeding | 0.102 (0.084 - 0.122) | 0.118 (0.099 - 0.141) | 0.099 (0.081 - 0.12) | 0.127 (0.109 - 0.149) | 0.119 (0.102 - 0.14) | 0.113 (0.099 - 0.129) | 0.113 (0.098 - 0.13) | 0.109 (0.095 - 0.126) | |
| Discharge with VNA (odds (95% CI)) | EVs with bleeding | 0.132 (0.118 - 0.147) | 0.129 (0.116 - 0.143) | 0.135 (0.122 - 0.148) | 0.134 (0.121 - 0.148) | 0.13 (0.118 - 0.142) | 0.114 (0.103 - 0.125 | 0.116 (0.105 - 0.129) | 0.12 (0.109 - 0.132) |
| EVs without bleeding | 0.113 (0.092 - 0.139) | 0.129 (0.109 - 0.152) | 0.157 (0.135 - 0.182) | 0.156 (0.136 - 0.179) | 0.146 (0.125 - 0.17) | 0.142 (0.125 - 0.161) | 0.145 (0.127 - 0.164) | 0.163 (0.143 - 0.186) | |
| Transfer other hospital (odds (95% CI)) | EVs with bleeding | 0.055 (0.046 - 0.064) | 0.049 (0.042 - 0.057) | 0.053 (0.046 - 0.061) | 0.044 (0.037 - 0.051) | 0.051 (0.044 - 0.059) | 0.053 (0.046 - 0.061) | 0.055 (0.047 - 0.063) | 0.061 (0.054 - 0.07) |
| EVs without bleeding | 0.032 (0.023 - 0.043) | 0.023 (0.016 - 0.033) | 0.025 (0.018 - 0.036) | 0.033 (0.024 - 0.044) | 0.031 (0.024 - 0.039) | 0.022 (0.017 - 0.03) | 0.03 (0.023 - 0.039) | 0.03 (0.023 - 0.039) | |