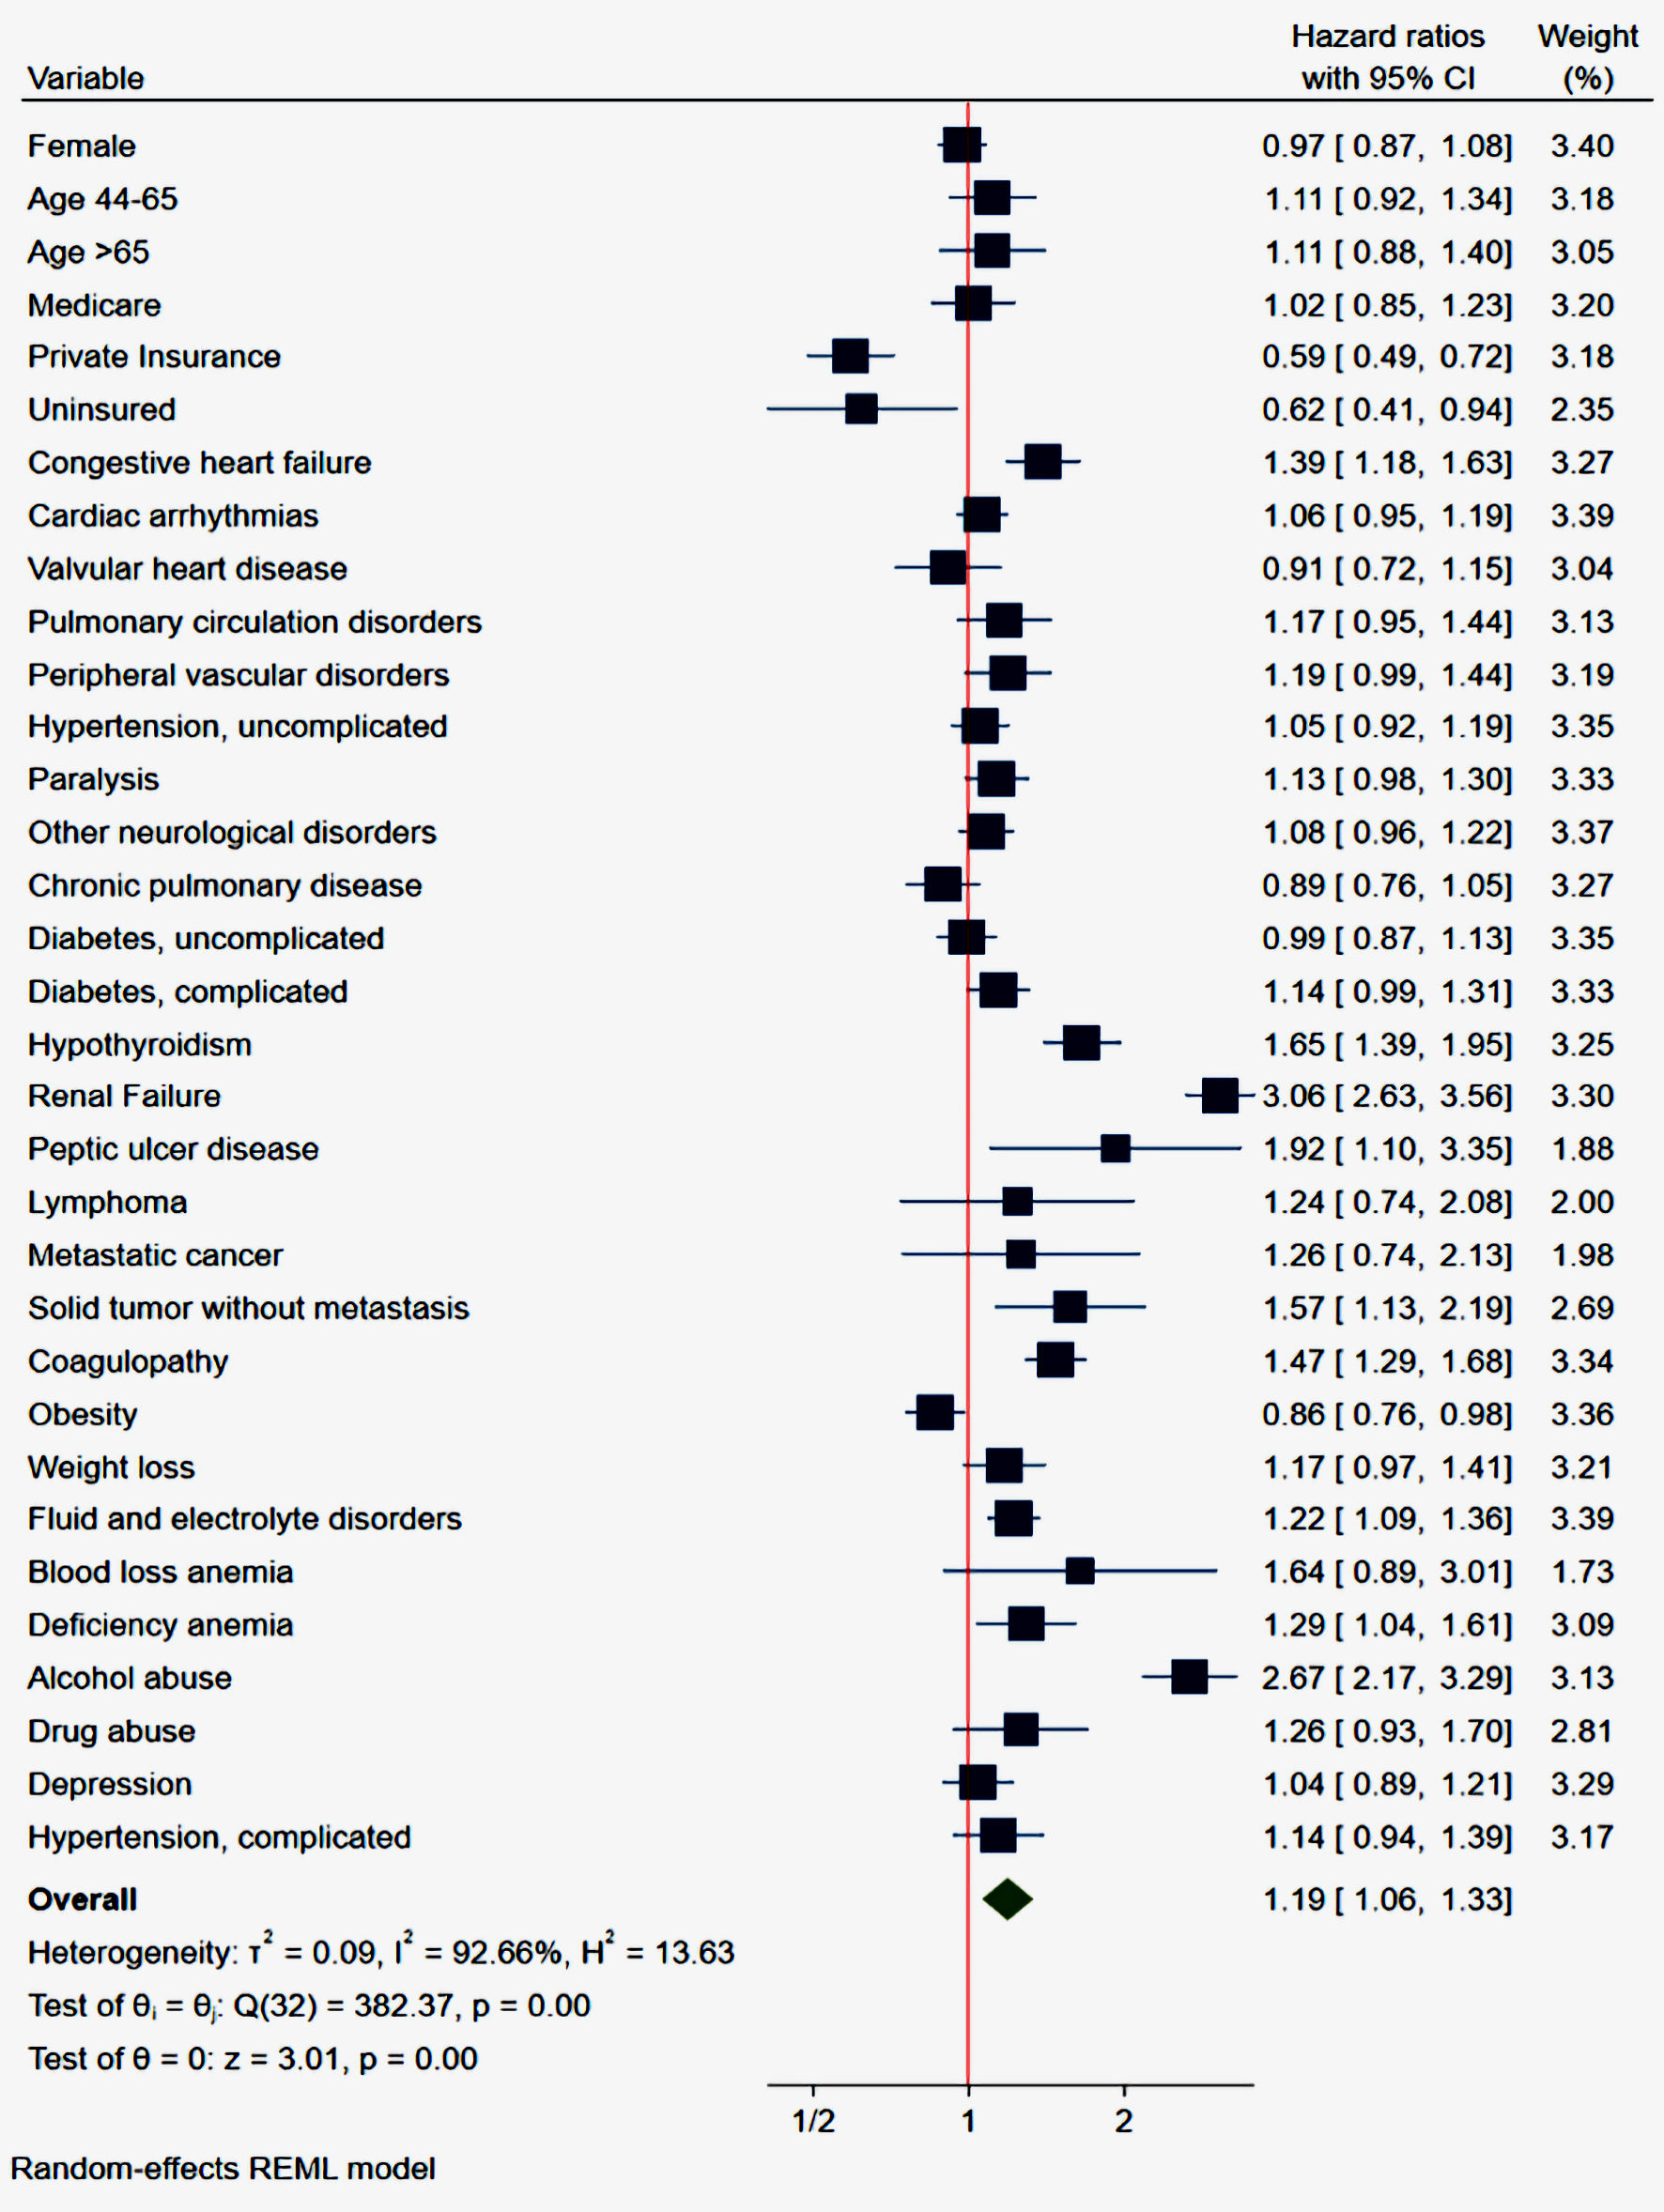
Figure 1. Forrest plot of multivariate analysis of independent predictors associated with 30-day readmissions. CI: confidence interval.
| Gastroenterology Research, ISSN 1918-2805 print, 1918-2813 online, Open Access |
| Article copyright, the authors; Journal compilation copyright, Gastroenterol Res and Elmer Press Inc |
| Journal website https://www.gastrores.org |
Original Article
Volume 16, Number 3, June 2023, pages 157-164
Independent Predictors and Causes of Thirty-Day Gastrointestinal Readmissions Following COVID-19-Related Hospitalizations: Analysis of the National Readmission Database
Figure
Tables
| Characteristic | Males | Females | P value |
|---|---|---|---|
| COVID-19: coronavirus disease 2019; SD: standard deviation. | |||
| N = 3,276 | 54% | 46% | |
| Mean age ± SD (years) | 66.4 ± 15.1 | 69.1 ± 16.1 | < 0.001 |
| Age category | 0.005 | ||
| 18 - 44 | 9.2 | 8.8 | |
| 45 - 64 | 33.6 | 26.2 | |
| ≥ 65 | 57.2 | 65.0 | |
| Insurance type (%) | 0.005 | ||
| Medicaid | 63.5 | 71.0 | |
| Medicare | 16.5 | 11.0 | |
| Private | 17.4 | 15.1 | |
| Uninsured | 2.6 | 2.9 | |
| Elixhauser Comorbidity Index score (%) | 0.066 | ||
| 0 | 2.8 | 2.4 | |
| 1 | 6.2 | 3.7 | |
| 2 | 11.6 | 9.5 | |
| 3 | 15.9 | 15.6 | |
| 4 | 63.5 | 68.8 | |
| Median household income (%) | 0.311 | ||
| < $49,999 | 34.8 | 37.7 | |
| ≥ $50,000 to < $64,999 | 31.4 | 27.7 | |
| ≥ $65,000 to < $85,999 | 19.1 | 20.7 | |
| ≥ 86,000 | 14.7 | 13.9 | |
| Location/teaching status of the hospital (%) | 0.791 | ||
| Rural | 17.4 | 18.8 | |
| Urban non-teaching | 72.4 | 71.0 | |
| Urban teaching | 10.2 | 10.2 | |
| Hospital bed size (%) | 0.403 | ||
| Small | 17.3 | 19.4 | |
| Medium | 24.3 | 25.6 | |
| Large | 58.4 | 55.0 | |
| N= 3,276 | Proportion (%) |
|---|---|
| COVID-19: coronavirus disease 2019. | |
| Gastrointestinal hemorrhage | 29.7 |
| Intestinal obstruction | 5.5 |
| Diverticulitis | 4.3 |
| Acute pancreatitis | 3.8 |
| Acute cholecystitis | 3.1 |
| Outcomes | Index admission | 30-day readmission |
|---|---|---|
| SD: standard deviation. | ||
| Mortality (%) | 11.6 | 5.1 |
| Length of stay (days ± SD) | 8.1 ± 0.1 | 6.4 ± 0.2 |
| Total hospitalization charges ($) | 20,135 | 16,738 |
| Outcomes | Male | Female | P value |
|---|---|---|---|
| SD: standard deviation. | |||
| Mortality (%) | 4.94 | 5.35 | 0.700 |
| Length of stay (days ± SD) | 6.4 ± 0.3 | 6.5 ± 0.1 | 0.952 |
| Total hospitalization charges ($) | 16,770 | 16,700 | 0.962 |
| Variable | Hazard ratio (adjusted) | P value | Confidence interval |
|---|---|---|---|
| COVID-19: coronavirus disease 2019; SD: standard deviation; GI: gastrointestinal. | |||
| Female | 0.96 | 0.521 | 0.87 - 1.07 |
| Age 44 - 65 | 1.11 | 0.281 | 0.92 - 1.35 |
| Age > 65 | 1.11 | 0.381 | 0.88 - 1.40 |
| Medicare | 1.02 | 0.816 | 0.85 - 1.23 |
| Private insurance | 0.59 | 0.000 | 0.49 - 0.72 |
| Uninsured | 0.62 | 0.027 | 0.41 - 0.95 |
| Congestive heart failure | 1.39 | 0.000 | 1.18 - 1.63 |
| Cardiac arrhythmias | 1.06 | 0.311 | 0.95 - 1.19 |
| Valvular heart disease | 0.91 | 0.415 | 0.72 - 1.15 |
| Pulmonary circulation disorders | 1.17 | 0.116 | 0.96 - 1.45 |
| Peripheral vascular disorders | 1.19 | 0.069 | 0.99 - 1.44 |
| Hypertension, uncomplicated | 1.05 | 0.432 | 0.93 - 1.20 |
| Paralysis | 1.13 | 0.082 | 0.98 - 1.29 |
| Other neurological disorders | 1.08 | 0.216 | 0.96 - 1.22 |
| Chronic pulmonary disease | 0.89 | 0.181 | 0.76 - 1.05 |
| Diabetes, uncomplicated | 0.99 | 0.879 | 0.87 - 1.13 |
| Diabetes, complicated | 1.14 | 0.061 | 0.99 - 1.30 |
| Hypothyroidism | 1.65 | 0.000 | 1.39 - 1.95 |
| Renal failure | 3.06 | 0.000 | 2.63 - 3.56 |
| Peptic ulcer disease | 1.92 | 0.021 | 1.10 - 3.35 |
| Lymphoma | 1.24 | 0.415 | 0.74 - 2.09 |
| Metastatic cancer | 1.26 | 0.393 | 0.74 - 2.12 |
| Solid tumor without metastasis | 1.57 | 0.008 | 1.13 - 2.19 |
| Coagulopathy | 1.47 | 0.000 | 1.29 - 1.68 |
| Obesity | 0.86 | 0.025 | 0.76 - 0.98 |
| Weight loss | 1.17 | 0.096 | 0.97 - 1.40 |
| Fluid and electrolyte disorders | 1.22 | 0.000 | 1.09 - 1.36 |
| Blood loss anemia | 1.64 | 0.109 | 0.89 - 3.00 |
| Deficiency anemia | 1.29 | 0.021 | 1.04 - 1.61 |
| Alcohol abuse | 2.67 | 0.000 | 2.17 - 3.29 |
| Drug abuse | 1.26 | 0.119 | 0.94 - 1.71 |
| Depression | 1.04 | 0.626 | 0.89 - 1.21 |
| Hypertension, complicated | 1.14 | 0.170 | 0.94 - 1.39 |