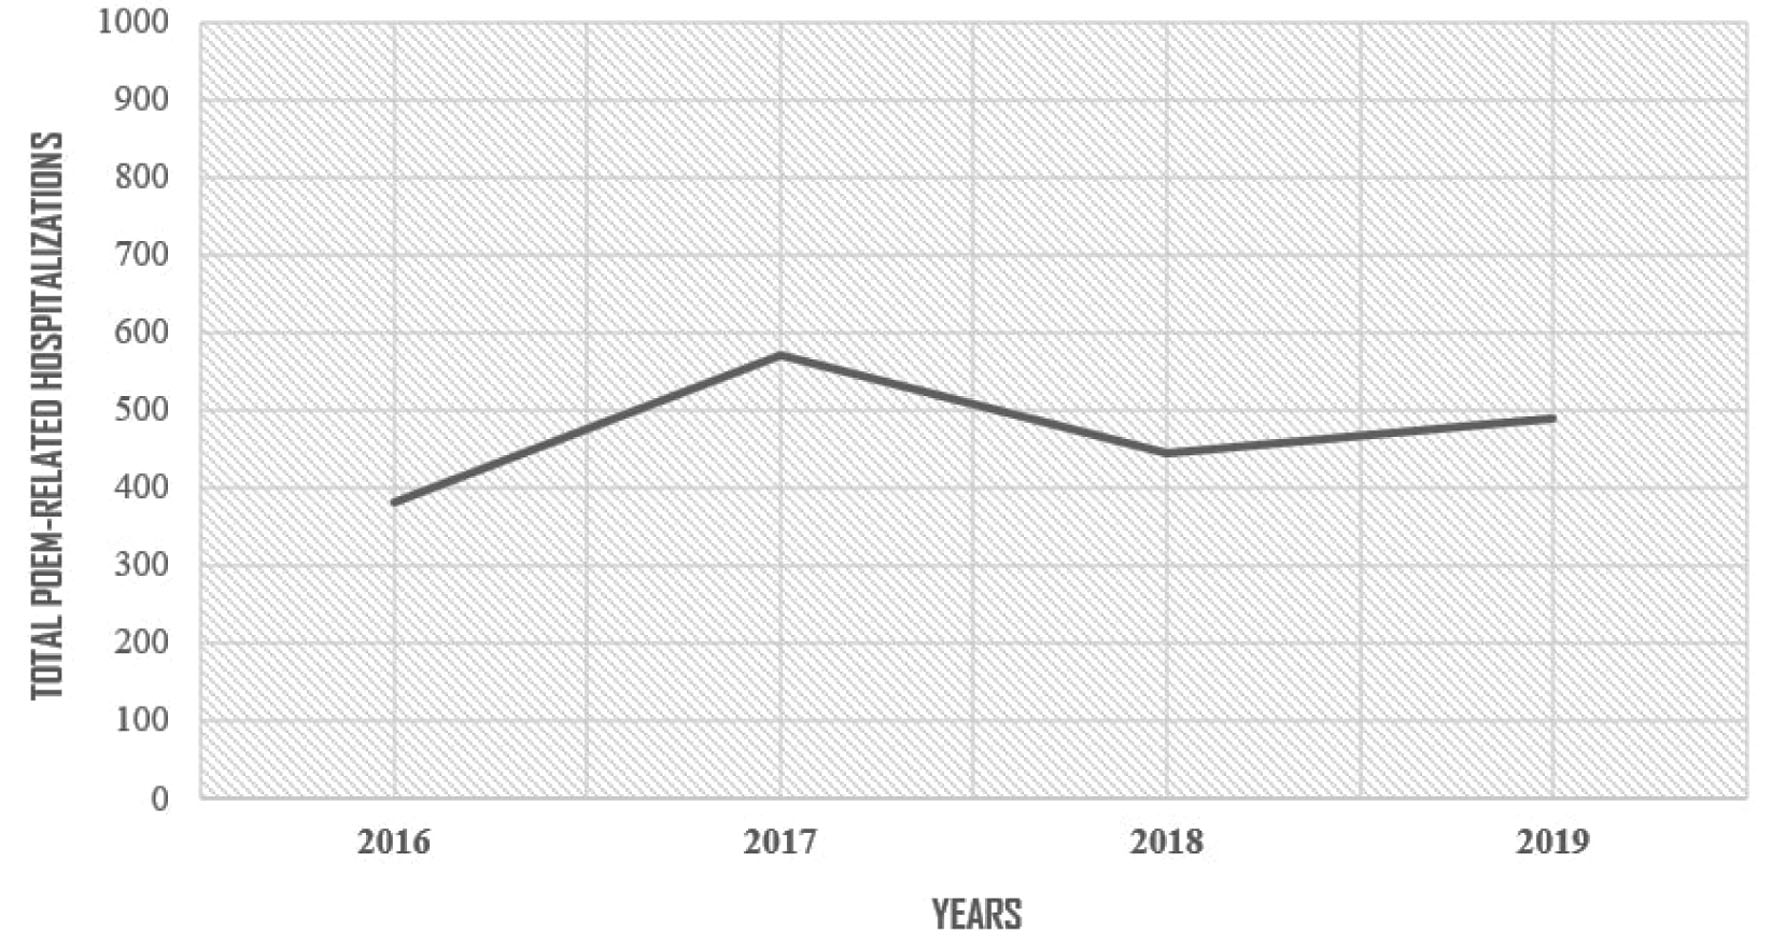
Figure 1. Achalasia patients requiring hospitalizations after per-oral endoscopic myotomy (POEM) in the United States from 2016 to 2019.
| Gastroenterology Research, ISSN 1918-2805 print, 1918-2813 online, Open Access |
| Article copyright, the authors; Journal compilation copyright, Gastroenterol Res and Elmer Press Inc |
| Journal website https://www.gastrores.org |
Original Article
Volume 16, Number 3, June 2023, pages 141-148
Clinical Outcomes and Complications for Achalasia Patients Admitted After Per-Oral Endoscopic Myotomy
Figures
Tables
| Variable | Years | ||||
|---|---|---|---|---|---|
| 2016 | 2017 | 2018 | 2019 | 2016 - 2019 (overall) | |
| CCI: Charlson Comorbidity Index; POEM: per-oral endoscopic myotomy. | |||||
| Total number of POEM | 380 | 570 | 445 | 490 | 1,885 |
| Mean age (years) ± standard error | 54.2 ± 1.4 | 56.8 ± 1.5 | 59.6 ± 1.9 | 59.3 ± 2.0 | 57.6 ± 0.9 |
| Age group distribution (years) | |||||
| 18 - 34 | 80 (21.1%) | 105 (18.4%) | 40 (9.0%) | 60 (12.2%) | 285 (15.1%) |
| 35 - 49 | 75 (19.7%) | 80 (14.0%) | 75 (16.9%) | 75 (15.3%) | 305 (16.2%) |
| 50 - 64 | 115 (30.3%) | 155 (27.2%) | 155 (34.8%) | 115 (23.5%) | 540 (28.7%) |
| 65 - 79 | 90 (23.7%) | 195 (34.2%) | 115 (25.8%) | 200 (40.8%) | 600 (31.8%) |
| ≥ 80 | 20 (5.3%) | 35 (6.1%) | 60 (13.5%) | 40 (8.2%) | 155 (8.2%) |
| Gender | |||||
| Male | 185 (48.7%) | 270 (47.4%) | 220 (49.4%) | 260 (53.1%) | 935 (49.6%) |
| Female | 195 (51.3%) | 300 (52.6%) | 225 (50.6%) | 230 (46.9%) | 950 (50.4%) |
| Race | |||||
| White | 275 (76.4%) | 380 (69.7%) | 270 (62.1%) | 320 (66.7%) | 1,245 (68.4%) |
| Black | 45 (12.5%) | 90 (16.5%) | 75 (17.2%) | 60 (12.5%) | 270 (14.8%) |
| Hispanic | 30 (8.3%) | 45 (8.3%) | 50 (11.5%) | 50 (10.4%) | 175 (9.6%) |
| Asian | < 11 (1.4%) | 0 (0.00%) | 15 (3.5%) | 30 (6.3%) | 50 (2.8%) |
| Others | < 11 (1.4%) | 30 (5.5%) | 25 (5.8%) | 20 (4.2%) | 80 (4.4%) |
| CCI | |||||
| CCI = 0 | 230 (60.5%) | 350 (61.4%) | 220 (49.4%) | 260 (53.1%) | 1,060 (56.2%) |
| CCI = 1 | 55 (14.5%) | 130 (22.8%) | 120 (27.0%) | 150 (30.6%) | 455 (24.1%) |
| CCI = 2 | 50 (13.2%) | 40 (7.0%) | 50 (11.2%) | 40 (8.2%) | 180 (9.6%) |
| CCI ≥ 3 | 45 (11.8%) | 50 (8.8%) | 55 (12.4%) | 40 (8.2%) | 190 (10.1%) |
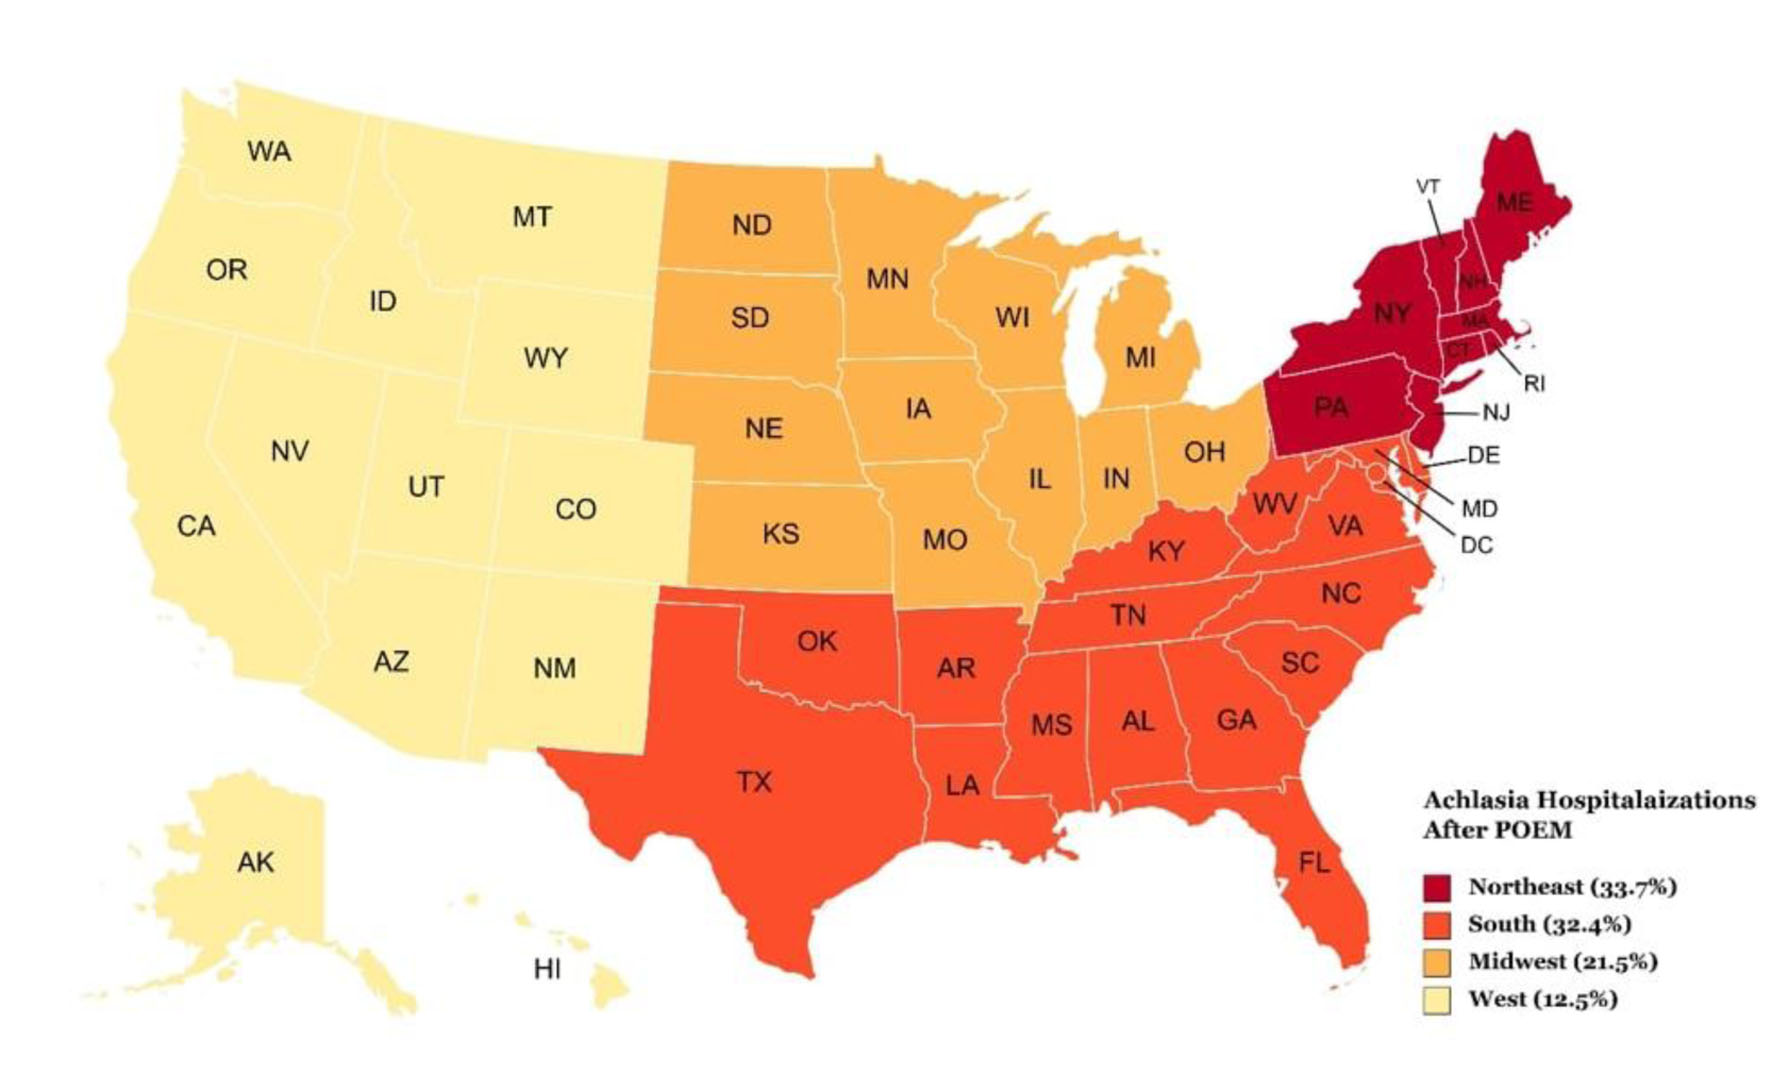
| Hospital region | |||||
| Northeast | 135 (35.5%) | 205 (36.0%) | 120 (27.0%) | 175 (35.7%) | 635 (33.7%) |
| Midwest | 125 (32.9%) | 135 (23.7%) | 85 (19.1%) | 60 (12.2%) | 405 (21.5%) |
| South | 80 (21.1%) | 165 (29.0%) | 170 (38.2%) | 195 (39.8%) | 610 (32.4%) |
| West | 40 (10.5%) | 65 (11.4%) | 70 (15.7%) | 60 (12.2%) | 235 (12.5%) |
| Hospital bed size | |||||
| Small | < 11 (1.3%) | 0 (0.0%) | 15 (3.4%) | 25 (5.1%) | 45 (2.4%) |
| Medium | 25 (6.6%) | 95 (16.7%) | 45 (10.1%) | 50 (10.2%) | 215 (11.4%) |
| Large | 350 (92.1%) | 475 (83.3%) | 385 (86.5%) | 415 (84.7%) | 1,625 (86.2%) |
| Hospital location and teaching status | |||||
| Rural | < 11 (1.3%) | < 11 (0.9%) | 0 (0.0%) | 0 (0.0%) | < 11 (0.5%) |
| Urban nonteaching | 15 (4.0%) | 25 (4.4%) | < 11 (1.1%) | 15 (3.1%) | 60 (3.2%) |
| Urban teaching | 360 (94.7%) | 540 (94.7%) | 440 (98.9%) | 475 (96.9%) | 1,815 (96.3%) |
| Expected primary payer | |||||
| Medicare | 140 (36.8%) | 250 (43.9%) | 205 (46.1%) | 230 (46.9%) | 825 (43.8%) |
| Medicaid | 65 (17.1%) | 55 (9.7%) | 35 (7.9%) | 60 (12.2%) | 215 (11.4%) |
| Private | 165 (43.4%) | 230 (40.4%) | 170 (38.2%) | 175 (35.7%) | 740 (39.3%) |
| Self-pay | < 11 (1.3%) | < 11 (1.8%) | 20 (4.5%) | 15 (3.2%) | 50 (2.7%) |
| Other | < 11 (1.3%) | 25 (4.4%) | 15 (3.4%) | < 11 (2.0%) | 55 (2.9%) |
| Median household income (quartile) | |||||
| First (0 - 25th) | 100 (27.0%) | 105 (18.4%) | 125 (28.1%) | 110 (23.2%) | 440 (23.7%) |
| Second (26th - 50th) | 90 (24.3%) | 165 (29.0%) | 145 (32.6%) | 110 (23.2%) | 510 (27.4%) |
| Third (51st - 75th) | 75 (20.3%) | 150 (26.3%) | 70 (15.7%) | 100 (21.1%) | 395 (21.2%) |
| Fourth (76th - 100th) | 105 (28.4%) | 150 (26.3%) | 105 (23.6%) | 155 (32.6%) | 515 (27.7%) |
| Outcomes | Years | ||||
|---|---|---|---|---|---|
| 2016 | 2017 | 2018 | 2019 | 2016 - 2019 (overall) | |
| ICF: intermediate care facility; POEM: per-oral endoscopic myotomy; SNF: skilled nursing facility; USD: United States Dollars. | |||||
| Disposition | |||||
| Routine (home) | 340 (89.5%) | 495 (86.8%) | 390 (87.6%) | 440 (89.8%) | 1,665 (88.3%) |
| Transfer to short-term hospital | 0 (0.0%) | 10 (1.8%) | < 11 (1.1%) | < 11 (1.0%) | 20 (1.1%) |
| Transfer to another type of facility (SNF and ICF) | 20 (5.3%) | 20 (3.5%) | 20 (4.5%) | 20 (4.1%) | 80 (4.2%) |
| Home health care | 15 (4.0%) | 45 (7.9%) | 25 (5.6%) | 25 (5.1%) | 110 (5.8%) |
| Discharge against medical advice | < 11 (1.3%) | 0 (0.00%) | < 11 (1.1%) | 0 (0.00%) | < 11 (0.5%) |
| Inpatient mortality | 0 (0.0%) | 0 (0.0%) | 0 (0.0%) | 0 (0.0%) | 0 (0.0%) |
| Length of stay (days) | 4.0 | 3.7 | 3.9 | 3.2 | 3.7 |
| Total healthcare charge (USD) | 52,057 | 75,240 | 67,520 | 65,109 | 66,151 |
| Complications | |||||
| Major post-procedural hemorrhage | 0 (0.0%) | 0 (0.0%) | 0 (0.0%) | 0 (0.0%) | 0 (0.0%) |
| Esophageal perforation | < 11 (1.3%) | < 11 (0.9%) | < 11 (1.1%) | < 11 (2.0%) | 25 (1.3%) |
| Post-procedure sepsis | 0 (0.0%) | 0 (0.0%) | 0 (0.0%) | 0 (0.0%) | 0 (0.0%) |
| Post-procedure pneumonia | < 11 (1.3%) | 0 (0.0%) | < 11 (1.1%) | < 11 (1.0%) | 15 (0.8%) |