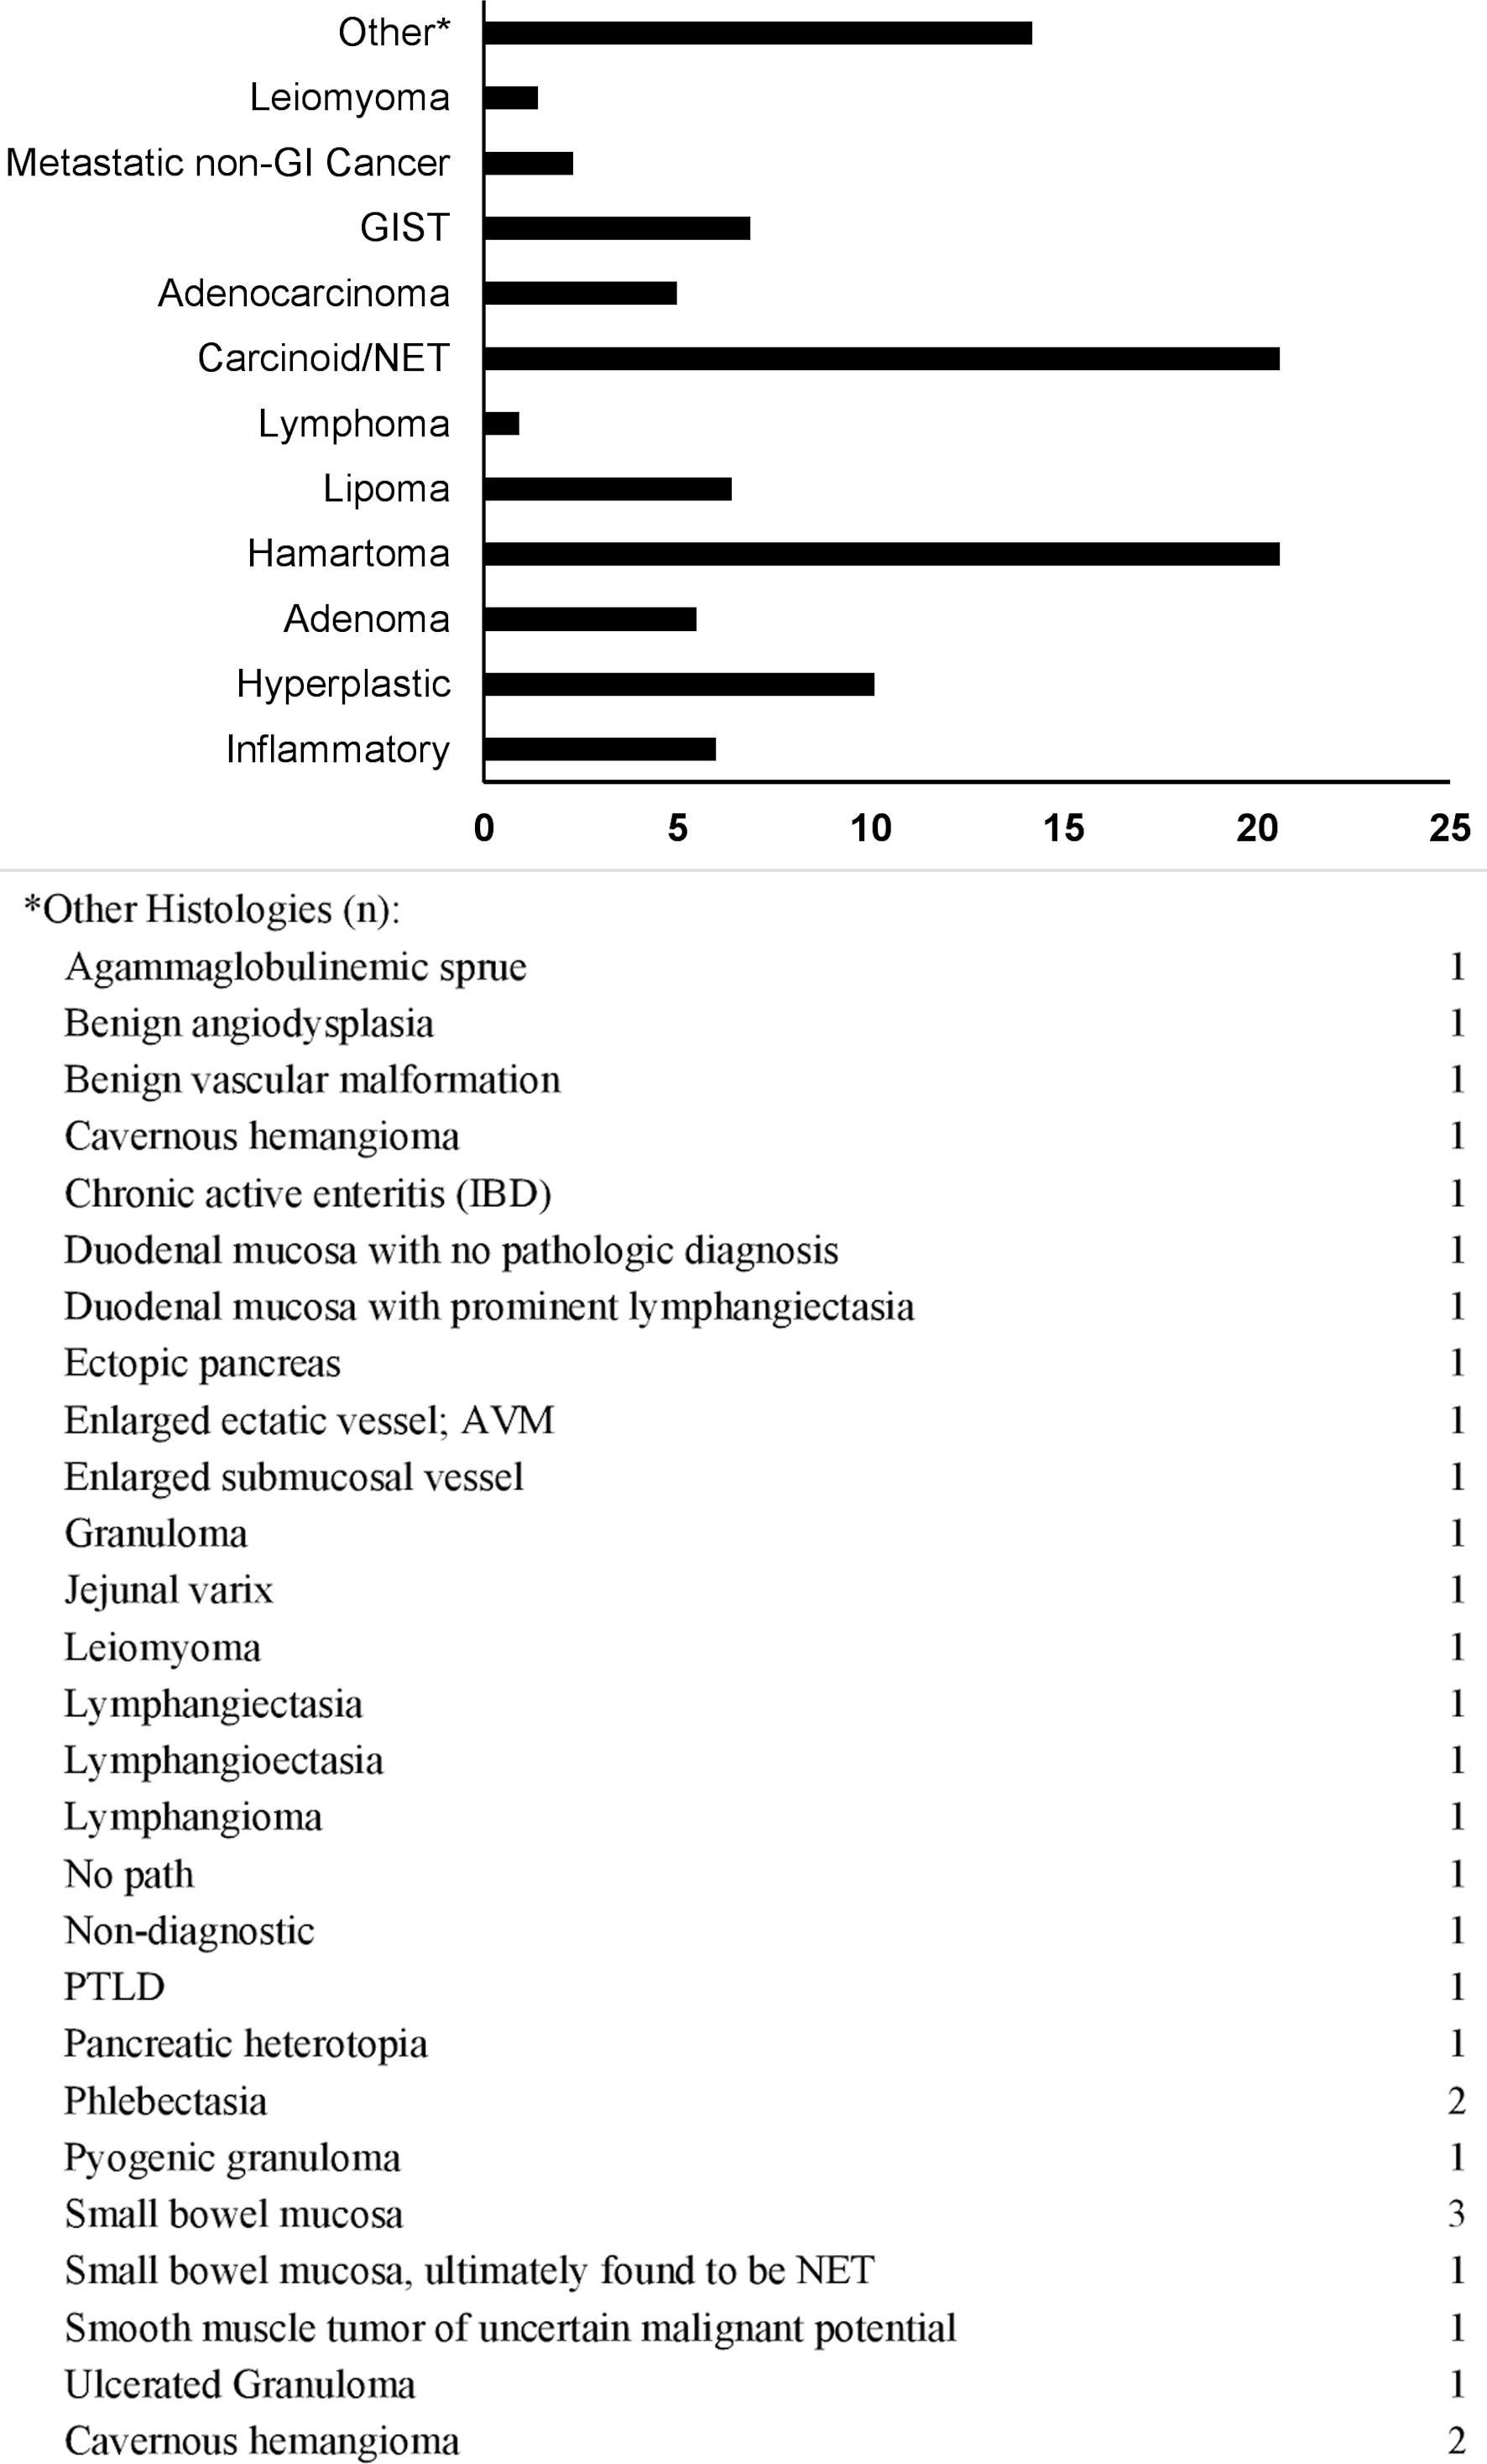
Figure 1. Lesion histology frequency (%). GIST: gastrointestinal stromal tumor; NET: neuroendocrine tumor; GI: gastrointestinal.
| Gastroenterology Research, ISSN 1918-2805 print, 1918-2813 online, Open Access |
| Article copyright, the authors; Journal compilation copyright, Gastroenterol Res and Elmer Press Inc |
| Journal website https://www.gastrores.org |
Original Article
Volume 15, Number 6, December 2022, pages 353-363
Clinical Features and Management of Small Bowel Masses Detected During Device-Assisted Enteroscopy: A Multi-Center Experience
Figures
Tables
| All patients (n = 218) | |
|---|---|
| Frequency (%) | |
| Values are n (%) unless otherwise specified. BMI: body mass index; GI: gastrointestinal. | |
| Age, years (median (Q1, Q3)) | 63 (47, 71) |
| Gender | |
| Female | 100 (45.9) |
| Male | 118 (54.1) |
| BMI at diagnosis (kg/m2) | |
| < 18.5 | 4 (1.8) |
| 18.5 - 24.9 | 51 (23.4) |
| 25 - 29.9 | 64 (29.4) |
| 30 - 39.9 | 69 (31.7) |
| > 40 | 19 (8.7) |
| Unknown | 11 (5.0) |
| Race | |
| Caucasian | 149 (68.3) |
| African American | 50 (22.9) |
| Other | 8 (3.7) |
| Unknown | 11 (5.0) |
| Family history GI malignancies | |
| Yes | 38 (17.4) |
| Colorectal cancer | 29 (13.3) |
| Gastric cancer | 5 (2.3) |
| Small bowel cancer | 6 (2.8) |
| Pancreatic cancer | 2 (0.9) |
| Multi-site GI cancer | 1 (0.5) |
| No | 180 (82.6) |
| History of hereditary cancer or polyposis syndrome | |
| No | 171 (78.4) |
| Peutz-Jeghers syndrome | 40 (18.3) |
| Familial adenomatous polyposis | 3 (1.4) |
| Other | 3 (1.4) |
| Unknown | 1 (0.46) |
| Tobacco use | |
| Former | 51 (23.4) |
| Current | 17 (7.8) |
| No | 144 (66.1) |
| Unknown | 5 (2.3) |
| All patients (n = 218) | |
|---|---|
| Frequency (%) | |
| Values are n (%) unless otherwise specified. | |
| Presenting symptoms | |
| Iron-deficiency anemia/bleeding | 160 (73.4) |
| Abnormal imaging study | 73 (33.5) |
| Abdominal pain | 27 (12.4) |
| Diarrhea | 24 (11.0) |
| Weight loss | 8 (3.7) |
| Bowel obstruction | 7 (3.2) |
| Constitutional symptoms | 4 (1.8) |
| Other | 31 (14.2) |
| Duration of presenting symptoms (months) | |
| < 1 | 18 (8.3) |
| 1 - 6 | 55 (25.7) |
| 6 - 12 | 17 (7.8) |
| > 12 | 75 (34.4) |
| Unknown | 52 (23.9) |
| All patients (n = 218) | ||
|---|---|---|
| Values are n (%) unless otherwise specified. aPositive finding that correlated to final DAE findings/location. bN = 176 due to information on 42 patients missing or unknown. cMissing information. DAE: device-assisted enteroscopy; EGD: esophagogastroduodenoscopy; VCE: video capsule endoscopy; CT: computed tomography; CTE: computed tomography enterography; MRI: magnetic resonance imaging; MRE magnetic resonance enterography; DBE: double-balloon enteroscopy; SBE: single-balloon enteroscopy; SE: spiral enteroscopy. | ||
| Endoscopy | Overall (n = 218) | Positive findinga, b |
| EGD | 136 (62.4) | -c |
| Ileo-colonoscopy | 126 (57.8) | 2 (1.6) |
| Push enteroscopy | 21 (9.6) | 6 (28.6) |
| VCE | 156 (71.6) | 131 (84.0) |
| Antegrade DAE | 10 (4.6) | -c |
| Retrograde DAE | 2 (0.9) | -c |
| Radiology | ||
| CT | 45 (20.6) | 22 (49) |
| CTE | 18 (8.3) | 11 (61) |
| MRI/MRE | 2 (0.9) | 0 (0) |
| Unknown | 19 (8.7) | - |
| DAE modality used to find lesion | All patients (n = 218) | |
| Antegrade DBE | 122 (56.0) | |
| Retrograde DBE | 65 (29.8) | |
| Antegrade SBE | 11 (5.0) | |
| Retrograde SBE | 1 (0.5) | |
| Antegrade SE | 19 (8.7) | |
| All patients (n = 218) | |
|---|---|
| Frequency (%) | |
| Values are n (%) unless otherwise specified. aIndicates benign epithelial tumors (e.g., adenoma, hamartoma, Brunner gland lesions). bIndicates malignant epithelial tumors (e.g., carcinoid and adenocarcinoma). cIndicates mesenchymal tumors (e.g., lipoma, liposarcoma, GIST, leiomyoma, hemangioma, etc.) dIndicates lymphoproliferative disorders (e.g., B-cell and T-cell lymphomas). GIST: gastrointestinal stromal tumor. | |
| Lesion location | |
| Duodenum | 30 (13.8) |
| Jejunum | 101 (46.3) |
| Ileum | 108 (49.5) |
| Multi-site | 7 (3.2) |
| Small bowel (unspecified) | 0 (0) |
| Lesion size (mm) | |
| 1 - 5 | 6 (2.8) |
| 5 - 10 | 61 (28.0) |
| 10 - 20 | 102 (46.8) |
| > 20 | 48 (22.0) |
| Missing | 1 (0.5) |
| Lesion phenotype | |
| Submucosal | 90 (41.3) |
| Mucosal: sessile | 32 (14.7) |
| Mucosal: pedunculated | 72 (33) |
| Obstructing/invasive | 24 (11) |
| Lesion histology | |
| Benign epitheliala | 81 (37.2) |
| Malignant epithelialb | 62 (28.4) |
| Mesenchymalc | 35 (16.1) |
| Lymphoproliferatived | 3 (1.4) |
| Inflammatory | 17 (7.8) |
| Normal small bowel tissue | 6 (2.8) |
| Vascular | 13 (6.0) |
| Missing | 1 (0.5) |
| Carcinoid/NET (N = 45) | Hamartoma (N = 45) | Hyperplastic (N = 22) | Total (N = 217)a | P value | |
|---|---|---|---|---|---|
| aChi-square test. bKruskal-Wallis test. cFisher exact test. aNote one patient did not have any histologies indicated and is excluded from this table. Furthermore, descriptive characteristics of the three most common histologies are represented in this table. FH: family history; GI: gastrointestinal; SD: standard deviation. | |||||
| Gender | 0.690a | ||||
| Male | 26 (57.8%) | 21 (46.7%) | 13 (59.1%) | 117 (53.9%) | |
| Female | 19 (42.2%) | 24 (53.3%) | 9 (40.9%) | 100 (46.1%) | |
| Age | < 0.001b | ||||
| N | 45 | 42 | 22 | 212 | |
| Mean (SD) | 61.13 (13.59) | 40.33 (17.89) | 63.32 (12.27) | 58.94 (17.25) | |
| Median | 64 | 36.5 | 65.5 | 63 | |
| Q1, Q3 | 49.00, 69.00 | 27.00, 52.00 | 58.00, 71.00 | 47.00, 71.00 | |
| Range | 25.00 - 86.00 | 14.00 - 87.00 | 32.00 - 78.00 | 14.00 - 89.00 | |
| BMI at diagnosis | 0.013a | ||||
| Missing | 2 | 7 | 1 | 11 | |
| < 18.5 | 1 (2.3%) | 0 (0.0%) | 0 (0.0%) | 4 (1.9%) | |
| 18.5 - 24.9 | 7 (16.3%) | 19 (50.0%) | 6 (28.6%) | 51 (24.8%) | |
| 25 - 29.9 | 16 (37.2%) | 7 (18.4%) | 2 (9.5%) | 64 (31.1%) | |
| 30 - 39.9 | 16 (37.2%) | 9 (23.7%) | 11 (52.4%) | 69 (33.5%) | |
| > 40 | 3 (7.0%) | 3 (7.9%) | 2 (9.5%) | 18 (8.7%) | |
| Ethnicity | 0.002c | ||||
| Missing | 2 (0.92%) | 2 (0.92%) | 1 (0.46%) | ||
| Caucasian | 26 (60.5%) | 36 (83.7%) | 12 (57.1%) | 148 (71.8%) | |
| African American | 14 (32.6%) | 4 (9.3%) | 9 (42.9%) | 50 (24.3%) | |
| Hispanic | 0 (0.0%) | 3 (7.0%) | 0 (0.0%) | 4 (1.9%) | |
| Native American | 0 (0.0%) | 0 (0.0%) | 0 (0.0%) | 1 (0.5%) | |
| Other | 3 (7.0%) | 0 (0.0%) | 0 (0.0%) | 3 (1.5%) | |
| Polyposis syndrome | < 0.001c | ||||
| Any history | 0 (0.0%) | 39 (86.7%) | 1 (4.5%) | 47 (21.7%) | |
| No history | 45 (100.0%) | 6 (13.3%) | 21 (95.5%) | 170 (78.3%) | |
| FH of GI malignancies | 0.010c | ||||
| Any history | 9 (20.0%) | 14 (31.1%) | 5 (22.7%) | 38 (17.5%) | |
| No history | 36 (80.0%) | 31 (68.9%) | 17 (77.3%) | 179 (82.5%) | |
| All patients (n = 218) | |
|---|---|
| Frequency (%) | |
| Values are n (%) unless otherwise specified. DAE: device-assisted enteroscopy. | |
| Endoscopic surveillance | 49 (22.5) |
| Surgical resection | 82 (37.6) |
| Medical oncology | 15 (6.9) |
| Unknown | 23 (10.6) |
| No further management | 57 (26.1) |
| Other | 3 (1.4) |
| All patients (n = 218) | |
|---|---|
| Frequency (%) | |
| Values are N (%) unless otherwise specified. DAE: device-assisted enteroscopy. | |
| Tattoo | 143 (65.6) |
| Biopsy | 132 (60.6) |
| Endoscopic resection | 83 (38.1) |
| Clip for marking | 7 (3.2) |
| Other | 3 (1.4) |
| DAE-related complications | 2 (0.92) |