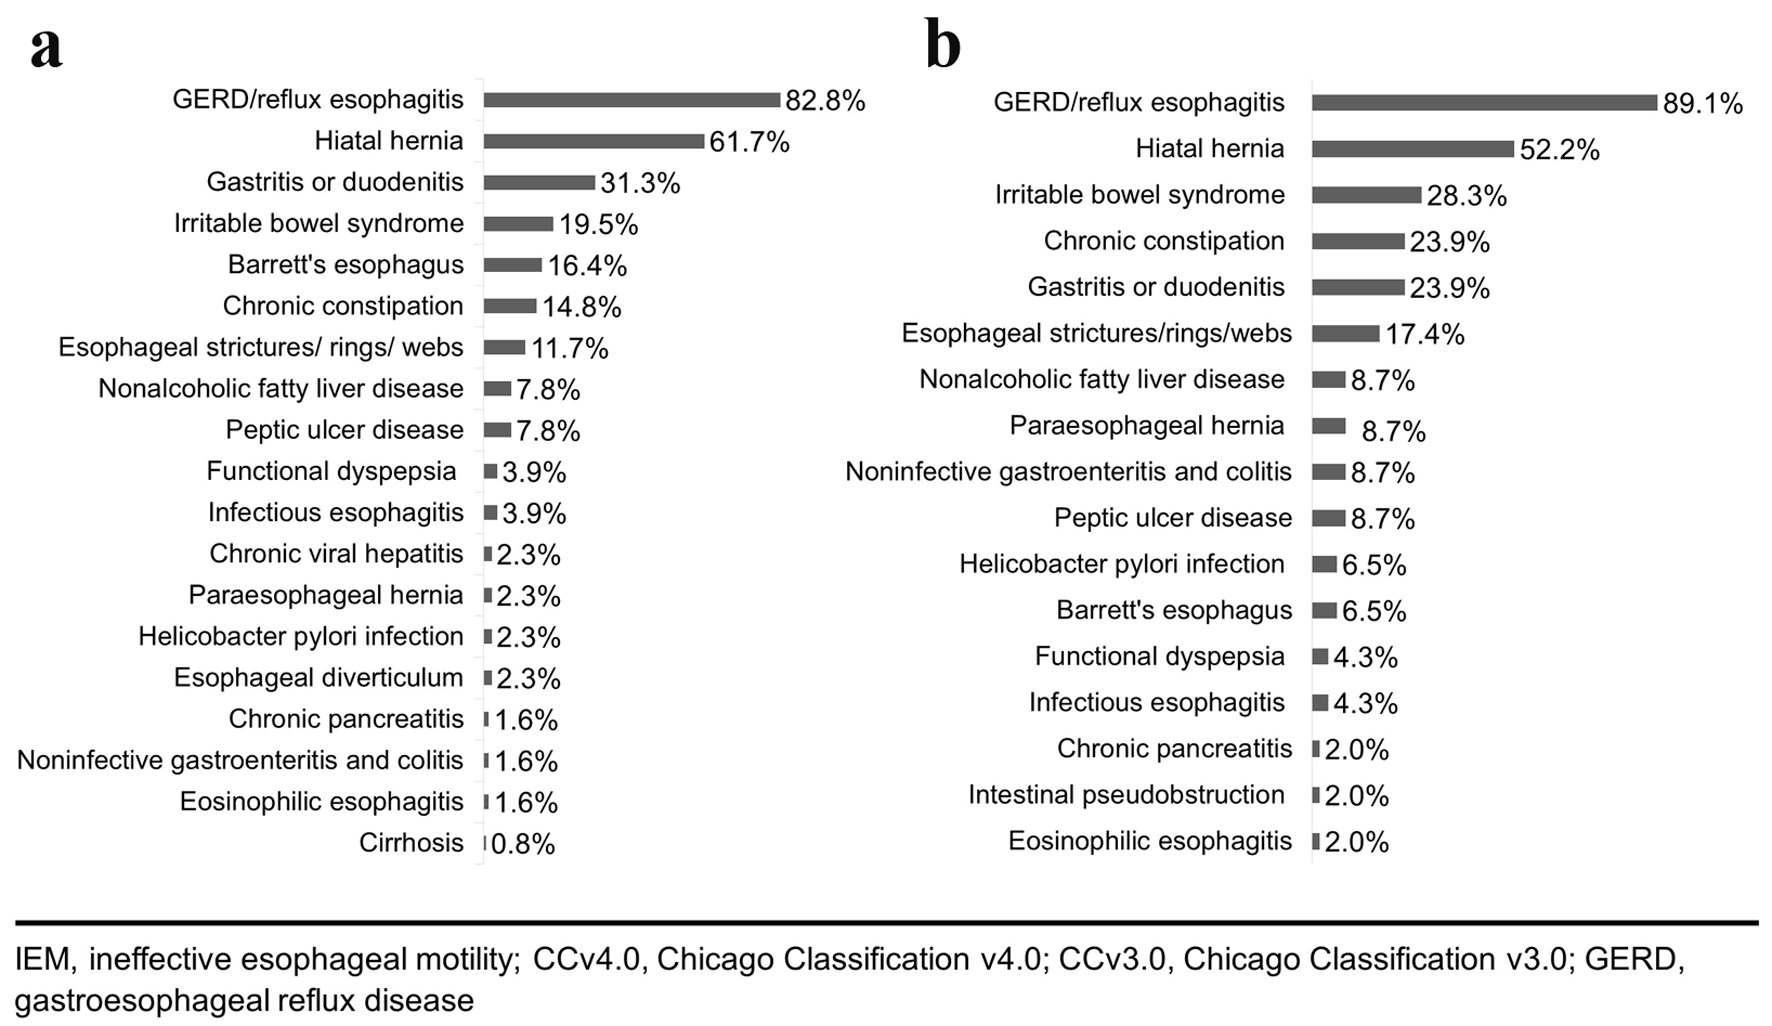
Figure 1. Prevalence of specific digestive system disorders among patients with a digestive system comorbidity among: (a) CCv4.0 IEM patients (n = 128) and (b) CCv3.0 only IEM patients (n = 46), 2011 - 2019.
| Gastroenterology Research, ISSN 1918-2805 print, 1918-2813 online, Open Access |
| Article copyright, the authors; Journal compilation copyright, Gastroenterol Res and Elmer Press Inc |
| Journal website https://www.gastrores.org |
Original Article
Volume 16, Number 1, February 2023, pages 37-49
Comparing Patients Diagnosed With Ineffective Esophageal Motility by the Chicago Classification Version 3.0 and Version 4.0 Criteria
Figures
Tables
| Group 1: CCv4.0 patients (n = 128) | Group 2: CCv3.0 only patients (n = 46) | P-value | |
|---|---|---|---|
| aWilcoxon rank-sum test. bFisher’s exact test. *P < 0.05; **P < 0.01; ***P < 0.001. IEM: ineffective esophageal motility; CCv4.0: Chicago Classification v4.0; CCv3.0: Chicago Classification v3.0. | |||
| Median age in years (interquartile range) | 54.50 (26) | 54 (23.25) | 0.4344a |
| Gender, n (%) | 0.9243b | ||
| Female | 90 (70.3%) | 32 (69.6%) | |
| Male | 38 (29.7%) | 14 (30.4%) | |
| Race, n (%) | 0.1159*b | ||
| White | 112 (87.5%) | 45 (97.8%) | |
| Non-white | 13 (10.2%) | 1 (2.2%) | |
| Unavailable | 3 (2.3%) | 0 (0%) | |
| Body mass index category, n (%) | 0.5529b | ||
| Underweight | 6 (3.61%) | 2 (4.44%) | |
| Normal | 38 (22.89%) | 11 (24.44%) | |
| Overweight | 51 (30.72%) | 9 (20.00%) | |
| Obese/morbidly obese | 71 (42.77%) | 23 (51.11%) | |
| Comorbidity, n (%) | |||
| Digestive system disorder | 119 (93.0%) | 46 (100.0%) | 0.0648b |
| Endocrine system, metabolic, or nutritional disorder | 74 (57.8%) | 30 (65.2%) | 0.3797b |
| Mood disorder | 73 (57.0%) | 23 (50.0%) | 0.4108b |
| Circulatory system disorder | 65 (50.8%) | 22 (47.8%) | 0.8637b |
| Nervous system disorder | 44 (34.4%) | 23 (50.0%) | 0.0618b |
| Respiratory system disorder | 35 (27.3%) | 17 (37.0%) | 0.2607b |
| Neoplasms | 24 (18.8%) | 9 (19.6%) | 1.0000b |
| Disorders of the blood, blood-forming organs, and certain disorders involving the immune mechanism | 17 (13.3%) | 14 (30.4%) | 0.0132*b |
| Musculoskeletal or connective tissue disorder | 11 (8.7%) | 6 (13.0%) | 0.3923b |
| Average manometric findings (mean ± SD) | Group 1: CCv4.0 patients (n = 128) | Group 2: CCv3.0 only patients (n = 46) | P-value |
|---|---|---|---|
| *P < 0.05; **P < 0.01; ***P < 0.001. IEM: ineffective esophageal motility; CCv4.0: Chicago Classification v4.0; CCv3.0: Chicago Classification v3.0; SD: standard deviation; LES: lower esophageal sphincter; IRP: integrated relaxation pressure. | |||
| % Weak contractions | 41.26 ± 29.10% | 41.55 ± 16.05% | 0.934 |
| % Failed contractions | 46.63 ± 25.92% | 19.22 ± 14.97% | < 0.001*** |
| % Ineffective contractions | 87.88 ± 11.88% | 60.77 ± 8.15% | < 0.001*** |
| Mean LES pressure | 18.69 ± 12.63 mm Hg | 19.83 ± 13.60 mm Hg | 0.621 |
| Median IRP | 3.96 ± 5.50 mm Hg | 4.42 ± 6.86 mm Hg | 0.683 |
| % Swallows followed by cleared bolus | 12.50 ± 19.50% | 17.78 ± 16.76% | 0.083 |
| Group 1: CCv4.0 patients (n = 128) | Group 2: CCv3.0 only patients (n = 46) | All patients combined (n = 174) | |
|---|---|---|---|
| Spearman correlation test. *P < 0.05; **P < 0.01; ***P < 0.001. IEM: ineffective esophageal motility; CCv4.0: Chicago Classification v4.0; CCv3.0: Chicago Classification v3.0; LES: lower esophageal sphincter; IRP: integrated relaxation pressure. | |||
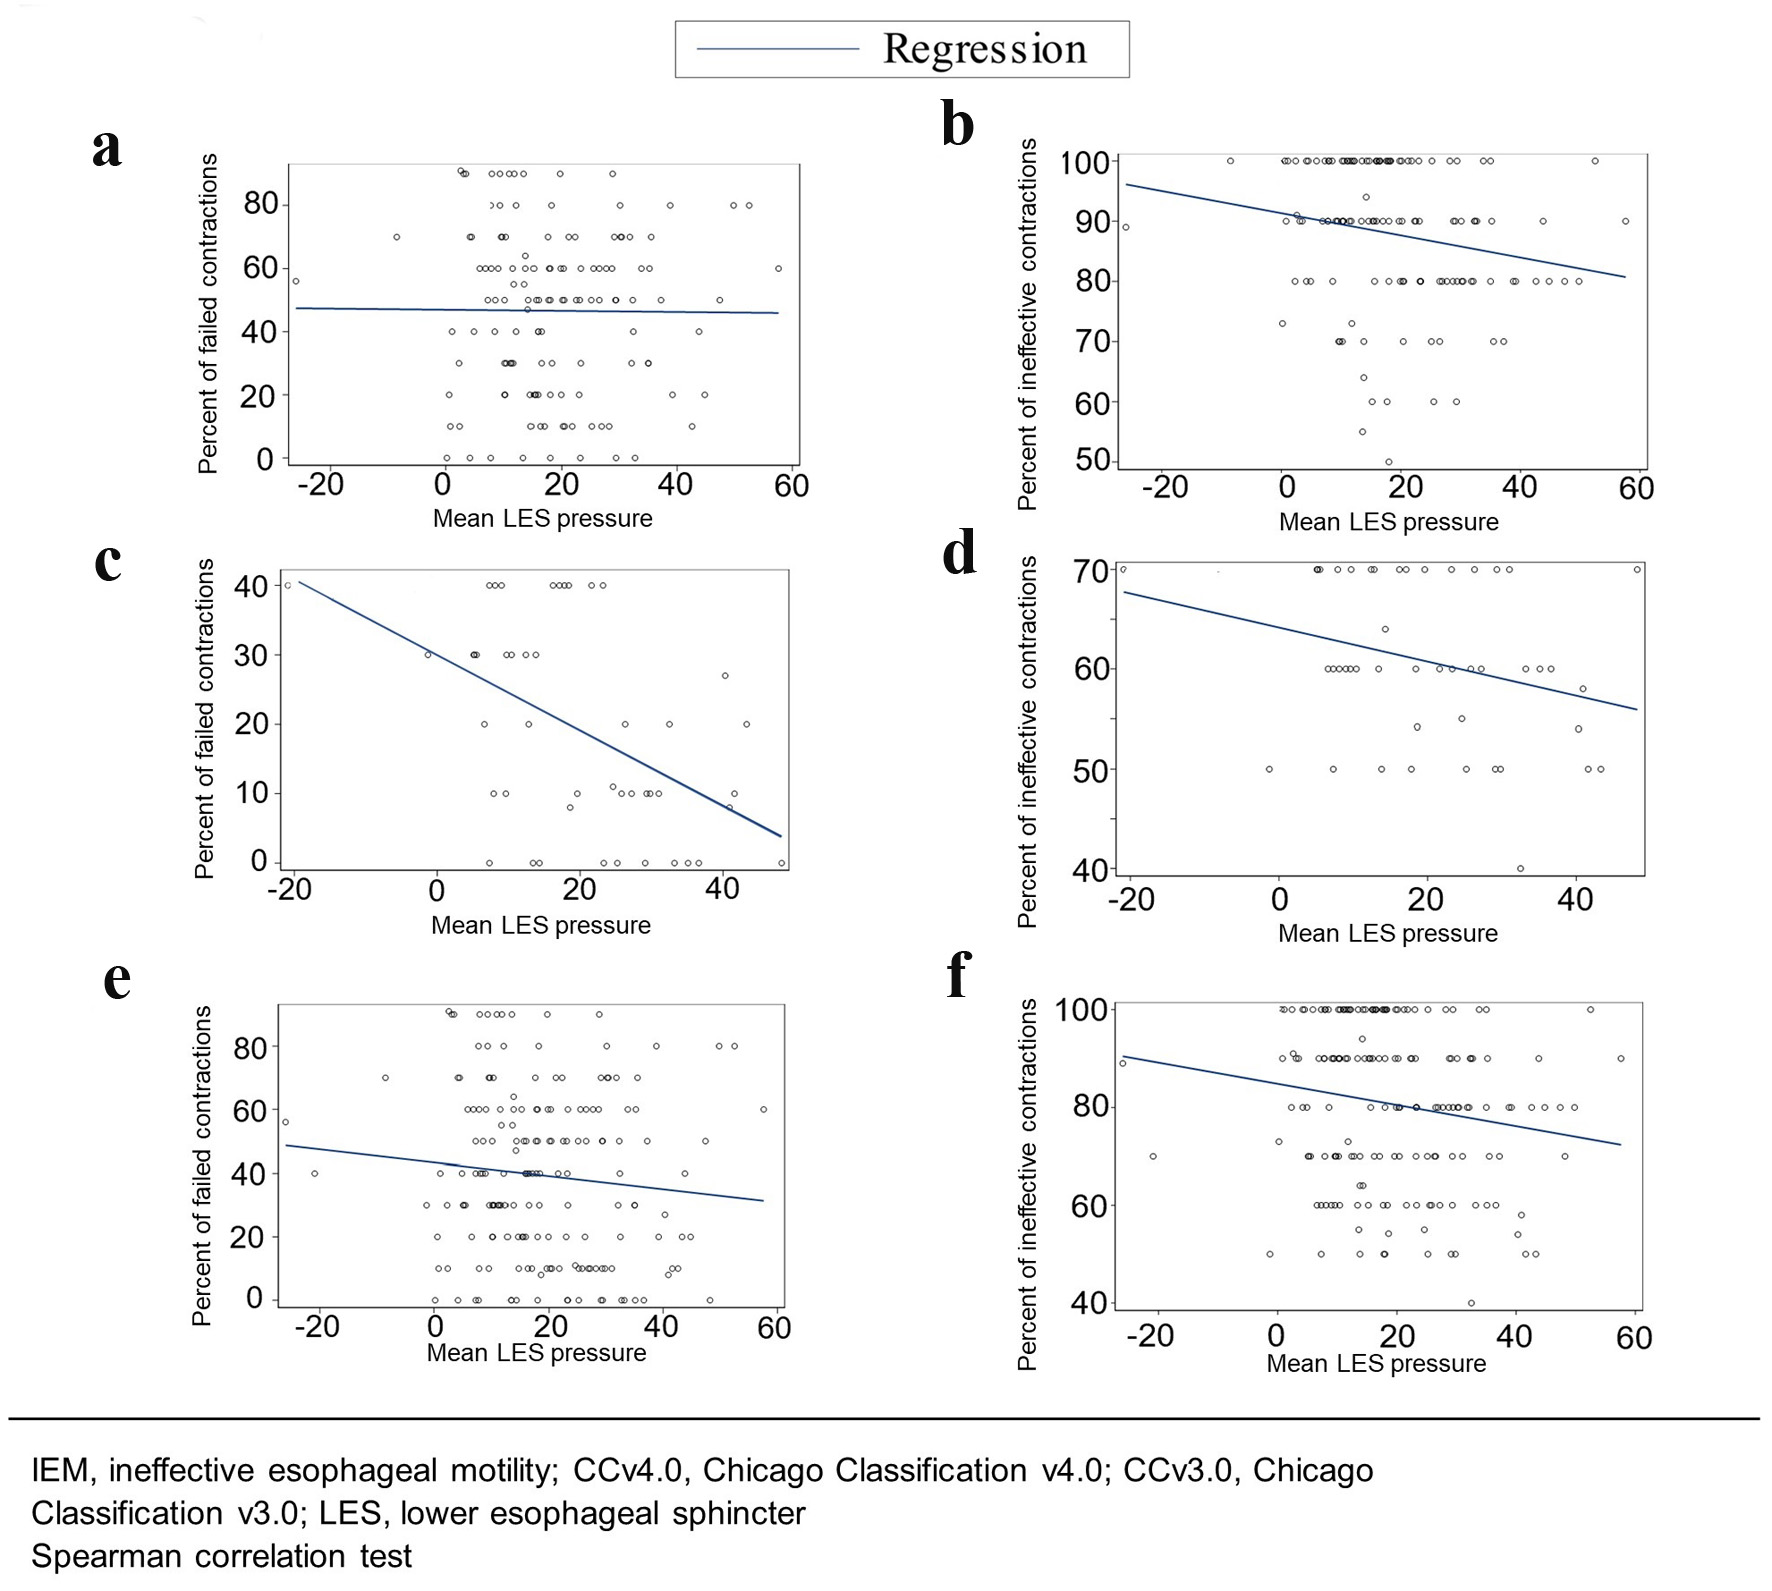
| Mean LES pressure | |||
| Percent of failed contractions | r = -0.0409; P = 0.6473 | r = -0.4875; P < 0.001*** | r = -0.1172; P = 0.1249 |
| Percent of ineffective contractions | r = -0.2495; P = 0.0050** | r = -0.2954; P = 0.0507 | r = -0.1942; P = 0.0108* |
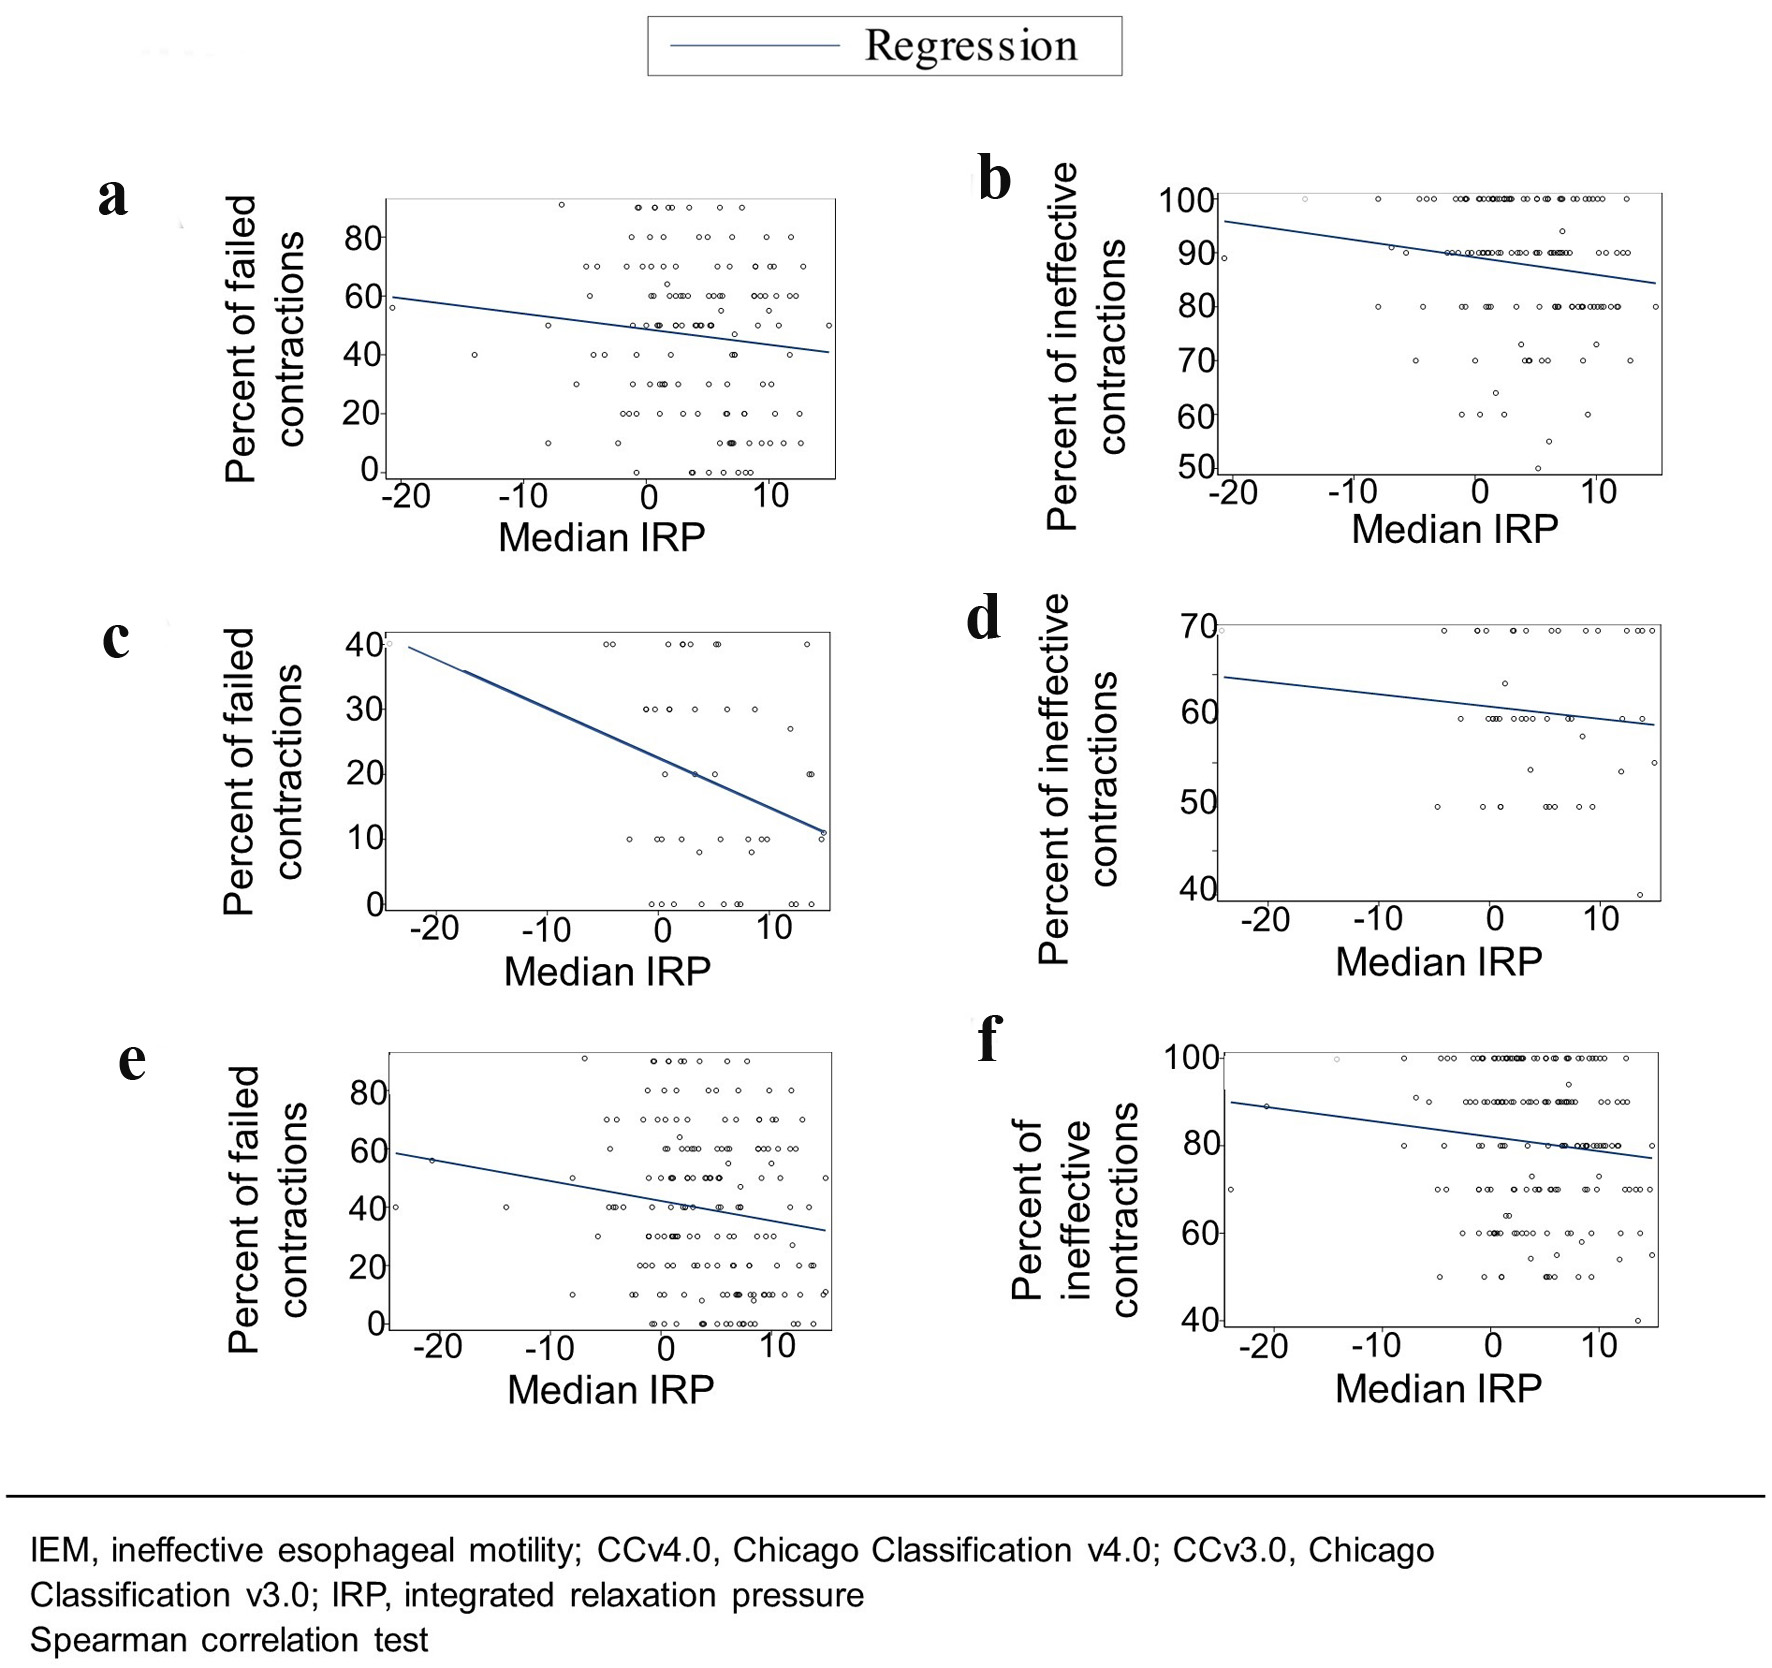
| Median IRP | |||
| Percent of failed contractions | r = -0.1202; P = 0.1785 | r = -0.3036; P = 0.0445* | r = -0.1533; P = 0.0445* |
| Percent of ineffective contractions | r = -0.1825; P = 0.0407* | r = -0.0587; P = 0.7000 | r = -0.1163; P = 0.1277 |
| Incomplete bolus clearance vs. percent of weak contractions | Incomplete bolus clearance vs. percent of failed contractions | Incomplete bolus clearance vs. percent of ineffective contractions | |
|---|---|---|---|
| Spearman correlation test. *P < 0.05; **P < 0.01; ***P < 0.001. IEM: ineffective esophageal motility; CCv4.0: Chicago Classification v4.0; CCv3.0: Chicago Classification v3.0. | |||
| Group 1: CCv4.0 patients (n = 128) | r = -0.2707; P = 0.0054** | r = 0.3689; P = 0.0001*** | r = 0.1511; P = 0.1226 |
| Group 2: CCv3.0 only patients (n = 46) | r = 0.0231; P = 0.8837 | r = 0.1168; P = 0.4595 | r = 0.2930; P = 0.0616 |
| All patients combined (n = 174) | r = -0.2176; P = 0.0081** | r = 0.3859; P = 0.000002*** | r = 0.2716; P = 0.0009*** |