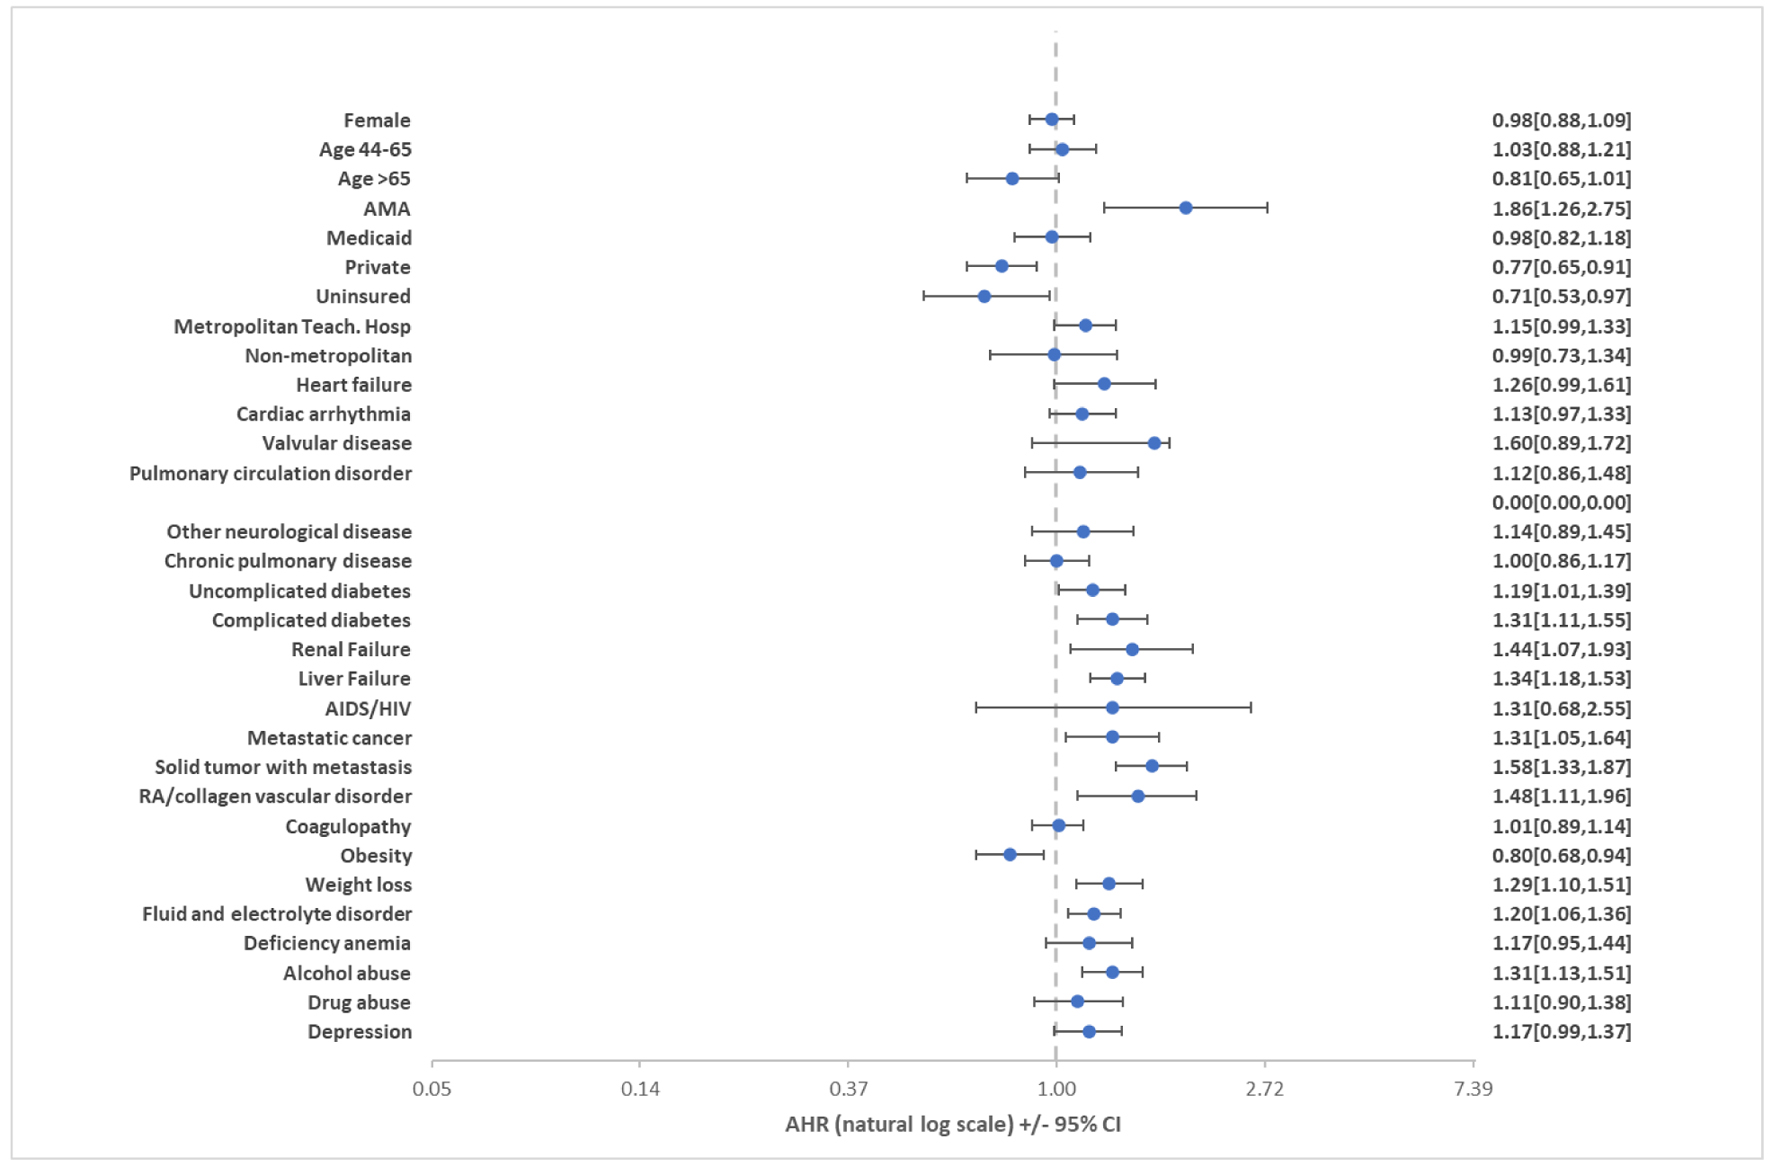
Figure 1. Predictors of 30-day all-cause readmissions of PVT, showing the adjusted hazard ratio with their confidence intervals for the predictors of 30-day all-cause readmissions for PVT hospitalizations. PVT: portal vein thrombosis.
| Gastroenterology Research, ISSN 1918-2805 print, 1918-2813 online, Open Access |
| Article copyright, the authors; Journal compilation copyright, Gastroenterol Res and Elmer Press Inc |
| Journal website https://www.gastrores.org |
Original Article
Volume 15, Number 5, October 2022, pages 253-262
Rates, Reasons, and Independent Predictors of Readmissions in Portal Venous Thrombosis Hospitalizations in the USA
Figures
Tables
| Variable | Index hospitalization | 30-day readmission | P-value |
|---|---|---|---|
| PVT: portal vein thrombosis; SD: standard deviation. | |||
| N | 17,971 | 2,971 | |
| Patient characteristics | |||
| Female, % | 45.5 | 45.1 | 0.758 |
| Age, mean ± SD (years) | 55.4 ±15.9 | 57.1±15.2 | < 0.001 |
| Age range, % | 0.001 | ||
| 18 - 44 years | 24.2 | 19.3 | |
| 45 - 64 years | 46.6 | 50.1 | |
| ≥ 65 years | 29.2 | 30.6 | |
| Elixhauser comorbidity index score, % | < 0.001 | ||
| 0 | 7.6 | 3.1 | |
| 1 | 14.2 | 7.2 | |
| 2 | 17.4 | 11.9 | |
| 3 | 15.9 | 15.3 | |
| ≥ 4 | 44.9 | 62.5 | |
| Primary payer, % | < 0.001 | ||
| Medicare | 37.3 | 42.2 | |
| Medicaid | 16.8 | 20.8 | |
| Private | 41.2 | 33.4 | |
| Uninsured | 4.7 | 3.6 | |
| Median annual income in patient’s zip code, US$#, % | 0.715 | ||
| 1 - 45,999 | 27.4 | 27.2 | |
| 46,000 - 58,999 | 27.9 | 28.9 | |
| 59,000 - 78,999 | 25.4 | 25.7 | |
| ≥ 79,000 | 19.3 | 18.2 | |
| Elixhauser morbidities, % | |||
| Congestive heart failure | 5.4 | 9.8 | < 0.001 |
| Cardiac arrhythmias | 11.2 | 14.9 | < 0.001 |
| Valvular disease | 2.0 | 2.5 | 0.190 |
| Pulmonary circulation disorders | 3.4 | 3.4 | 0.993 |
| Peripheral vascular disorders | 7.9 | 6.1 | 0.009 |
| Hypertension, uncomplicated | 37.5 | 37.0 | 0.710 |
| Paralysis | 0.2 | 0.4 | 0.144 |
| Other neurologic disorders | 4.9 | 9.2 | < 0.001 |
| Chronic pulmonary disease | 14.7 | 17.5 | 0.003 |
| Diabetes, uncomplicated | 13.9 | 16.2 | 0.012 |
| Diabetes, complicated | 10.2 | 15.1 | < 0.001 |
| Hypothyroidism | 11.8 | 10.5 | 0.110 |
| Renal failure | 6.9 | 11.7 | < 0.001 |
| Liver disease | 41.4 | 54.1 | < 0.001 |
| Peptic ulcer disease | 2.2 | 2.3 | 0.848 |
| AIDS/HIV | 0.4 | 0.7 | 0.030 |
| Lymphoma | 0.7 | 0.8 | 0.863 |
| Metastatic cancer | 7.0 | 13.7 | < 0.001 |
| Solid tumor without metastasis | 14.3 | 27.8 | < 0.001 |
| RA/collagen vascular disorders | 2.7 | 3.2 | 0.256 |
| Coagulopathy | 26.7 | 33.9 | < 0.001 |
| Obesity | 20.1 | 12.6 | < 0.001 |
| Weight loss | 11.9 | 19.3 | < 0.001 |
| Fluid and electrolyte disorders | 32.7 | 44.5 | < 0.001 |
| Blood loss anemia | 1.5 | 2.2 | 0.038 |
| Deficiency anemia | 7.4 | 7.2 | 0.760 |
| Alcohol abuse | 14.4 | 19.8 | < 0.001 |
| Drug abuse | 4.8 | 5.4 | 0.325 |
| Psychoses | 0.8 | 0.9 | 0.433 |
| Depression | 13.4 | 16.5 | 0.001 |
| Hypertension, complicated | 8.2 | 12.7 | < 0.001 |
| Hospital characteristics | |||
| Hospital bed size, % | 0.030 | ||
| Small | 14.5 | 12.5 | |
| Medium | 25.2 | 24.1 | |
| Large | 60.3 | 63.4 | |
| Hospital location/teaching status, % | 0.008 | ||
| Metropolitan non-teaching | 17.8 | 15.9 | |
| Metropolitan teaching | 77.2 | 80.4 | |
| Non-metropolitan | 5.0 | 3.7 | |
| Variable | Index hospitalization | 90-day readmission | P-value |
|---|---|---|---|
| PVT: portal vein thrombosis; HIV: human immunodeficiency virus; AIDS: acquired immunodeficiency syndrome; SD: standard deviation. | |||
| N | 14,696 | 3,737 | |
| Patient characteristics | |||
| Female, % | 45.7 | 45.1 | 0.614 |
| Age, mean ± SD (years) | 55.5 ± 15.9 | 57.1 ± 15.3 | < 0.001 |
| Age range, % | < 0.001 | ||
| 18 - 44 years | 24.2 | 19.5 | |
| 45 - 64 years | 46.5 | 48.9 | |
| ≥ 65 years | 29.3 | 31.6 | |
| Elixhauser comorbidity index score, % | <0.001 | ||
| 0 | 7.7 | 3.0 | |
| 1 | 14.1 | 6.8 | |
| 2 | 17.6 | 11.6 | |
| 3 | 15.8 | 15.7 | |
| ≥ 4 | 44.8 | 62.9 | |
| Primary payer, % | <0.001 | ||
| Medicare | 37.2 | 43.5 | |
| Medicaid | 16.5 | 20.8 | |
| Private | 41.8 | 32.5 | |
| Uninsured | 4.5 | 3.2 | |
| Median annual income in patient’s zip code, US$#, % | 0.492 | ||
| 1 - 45,999 | 27.2 | 26.9 | |
| 46,000 - 58,999 | 27.9 | 29.3 | |
| 59,000 - 78,999 | 25.3 | 25.4 | |
| ≥ 79,000 | 19.6 | 18.4 | |
| Elixhauser morbidities, % | |||
| Congestive heart failure | 5.2 | 8.9 | < 0.001 |
| Cardiac arrhythmias | 11.2 | 14.4 | < 0.001 |
| Valvular disease | 1.9 | 2.4 | 0.246 |
| Pulmonary circulation disorders | 3.3 | 3.1 | 0.623 |
| Peripheral vascular disorders | 7.9 | 6.4 | 0.018 |
| Hypertension, uncomplicated | 37.3 | 36.9 | 0.533 |
| Paralysis | 0.1 | 0.5 | 0.010 |
| Other neurologic disorders | 5.0 | 9.3 | < 0.001 |
| Chronic pulmonary disease | 14.5 | 17.8 | < 0.001 |
| Diabetes, uncomplicated | 14.0 | 17.5 | < 0.001 |
| Diabetes, complicated | 10.2 | 15.2 | < 0.001 |
| Hypothyroidism | 12.2 | 11.4 | 0.343 |
| Renal failure | 6.95 | 11.9 | < 0.001 |
| Liver disease | 41.4 | 54.7 | < 0.001 |
| Peptic ulcer disease | 2.2 | 2.3 | 0.877 |
| AIDS/HIV | 0.4 | 0.7 | 0.021 |
| Lymphoma | 0.6 | 0.7 | 0.895 |
| Metastatic cancer | 6.8 | 13.3 | < 0.001 |
| Solid tumor without metastasis | 14.5 | 28.7 | < 0.001 |
| RA/collagen vascular disorders | 2.6 | 2.7 | 0.817 |
| Coagulopathy | 26.3 | 30.9 | < 0.001 |
| Obesity | 20.7 | 12.5 | < 0.001 |
| Weight loss | 11.7 | 19.9 | < 0.001 |
| Fluid and electrolyte disorders | 32.9 | 43.9 | < 0.001 |
| Blood loss anemia | 1.5 | 2.4 | 0.012 |
| Deficiency anemia | 7.5 | 7.9 | 0.551 |
| Alcohol abuse | 14.4 | 19.7 | < 0.001 |
| Drug abuse | 4.9 | 6.4 | 0.008 |
| Psychoses | 0.8 | 1.0 | 0.325 |
| Depression | 13.1 | 15.9 | 0.002 |
| Hypertension, complicated | 8.0 | 12.6 | < 0.001 |
| Hospital characteristics | |||
| Hospital bed size, % | 0.138 | ||
| Small | 14.6 | 14.1 | |
| Medium | 25.6 | 24.0 | |
| Large | 59.8 | 61.9 | |
| Hospital location/teaching status, % | 0.448 | ||
| Metropolitan non-teaching | 17.6 | 16.6 | |
| Metropolitan teaching | 77.4 | 78.3 | |
| Non-metropolitan | 5.0 | 5.1 | |
| Principal readmission diagnoses | Proportion, % |
|---|---|
| PVT: portal vein thrombosis; HCC: hepatocellular carcinoma. | |
| 30-day all-cause readmissions (n = 2,971) | |
| PVT | 12.8 |
| Sepsis, unspecified organism | 5.5 |
| HCC | 4.2 |
| Liver failure | 3.6 |
| Alcoholic liver cirrhosis | 1.9 |
| Acute liver failure | 1.8 |
| Acute kidney failure | 1.7 |
| Liver cirrhosis | 1.6 |
| Gastrointestinal hemorrhage | 1.6 |
| Melena | 1.5 |
| 90-day all-cause readmissions (n = 3,737) | |
| PVT | 9.9 |
| Sepsis, unspecified organism | 6.0 |
| HCC | 3.9 |
| Liver failure | 3.4 |
| Alcoholic liver cirrhosis | 2.2 |
| Cirrhosis | 1.8 |
| Acute kidney failure | 1.8 |
| Gastrointestinal hemorrhage | 1.7 |
| Acute liver failure | 1.7 |
| Acute pancreatitis | 1.5 |
| Outcome | 30-day readmission | 90-day readmission |
|---|---|---|
| PVT: portal vein thrombosis; SE: standard error. | ||
| Number | 2,971 | 3,737 |
| In hospital mortality, % | 7.7 | 7.2 |
| Length of hospitalization, mean ± SE (days) | 6.49 ± 0.32 | 6.03 ± 0.26 |
| Total hospital cost, mean US$ | 18,986 | 16,549 |
| All-cause readmission rate, % | 16.5% | 25.4% |