Figures
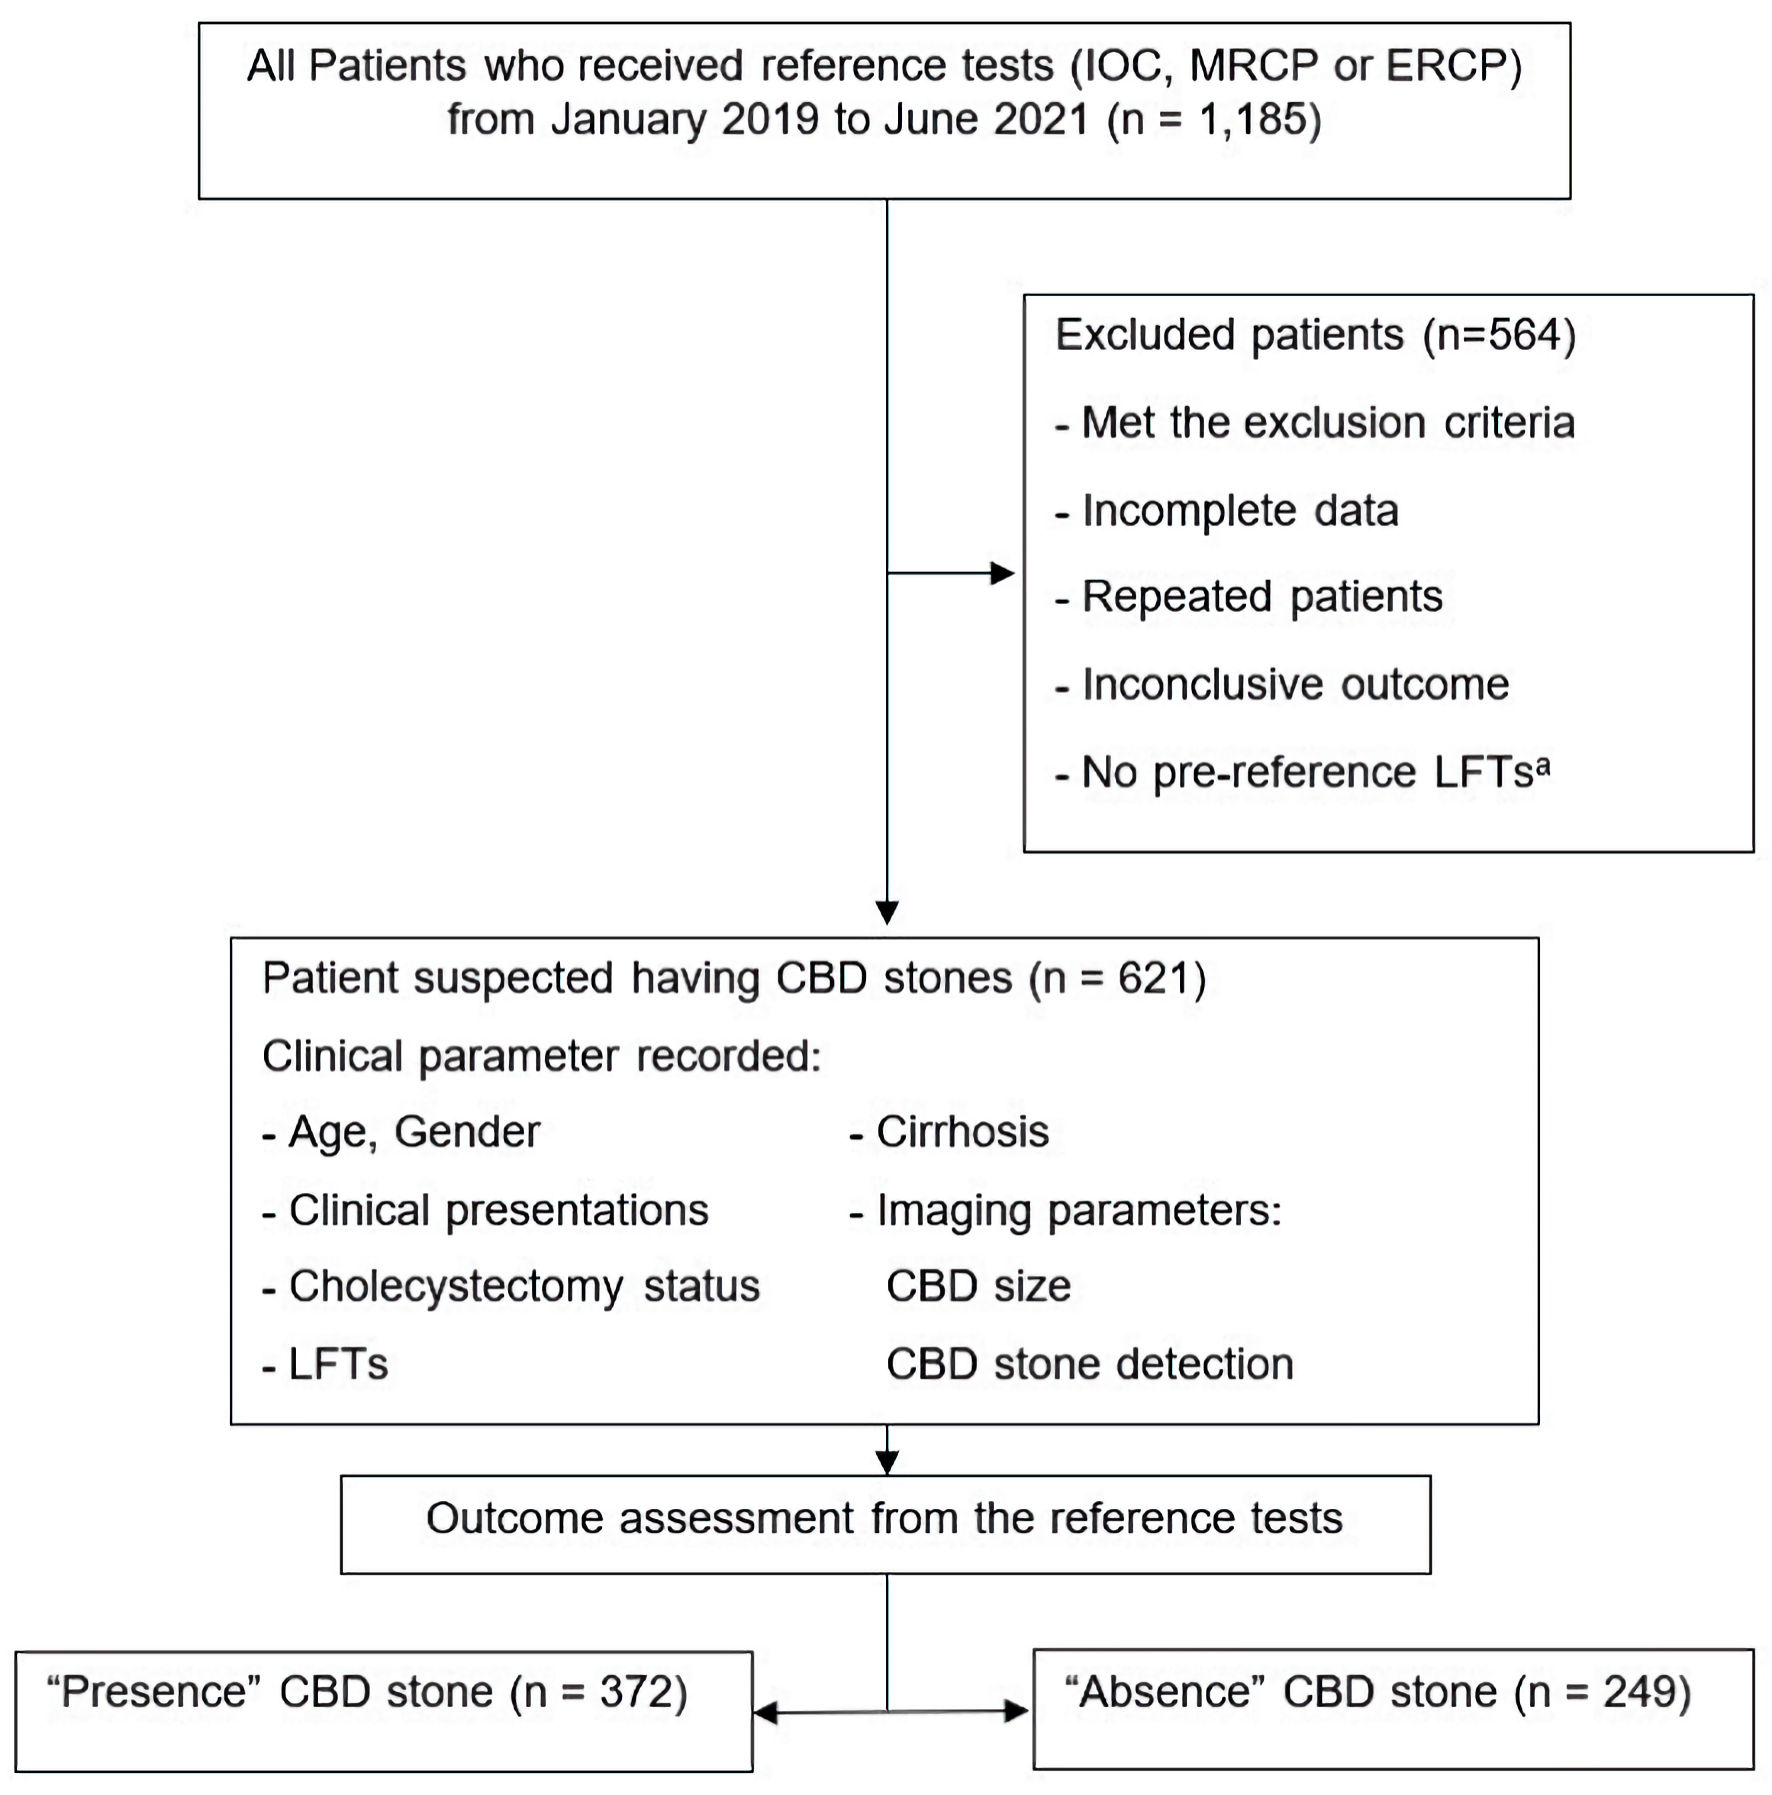
Figure 1. Study participant flow diagram. aPre-reference LFTs mean LFTs within 7 days before reference tests. CBD: common bile duct; ERC: endoscopic retrograde cholangiography; IOC: intraoperative cholangiography; LFTs: liver function tests; MRCP: magnetic resonance cholangiopancreatography.
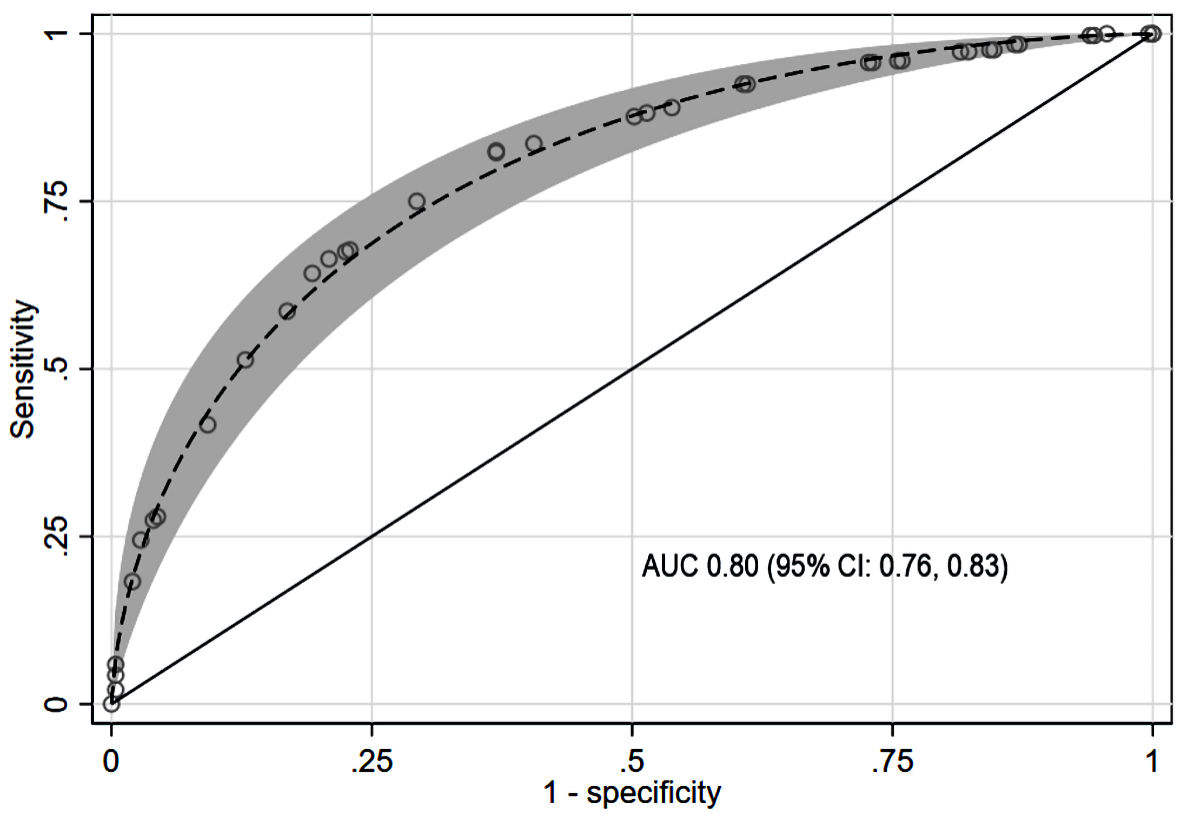
Figure 2. Parametric ROC with 95% confidence band for CBD stone prediction using the scoring model. AUC: area under the receiver operating characteristic curve; CBD: common bile duct; CI: confidence interval; ROC: receiver operating characteristic curve.
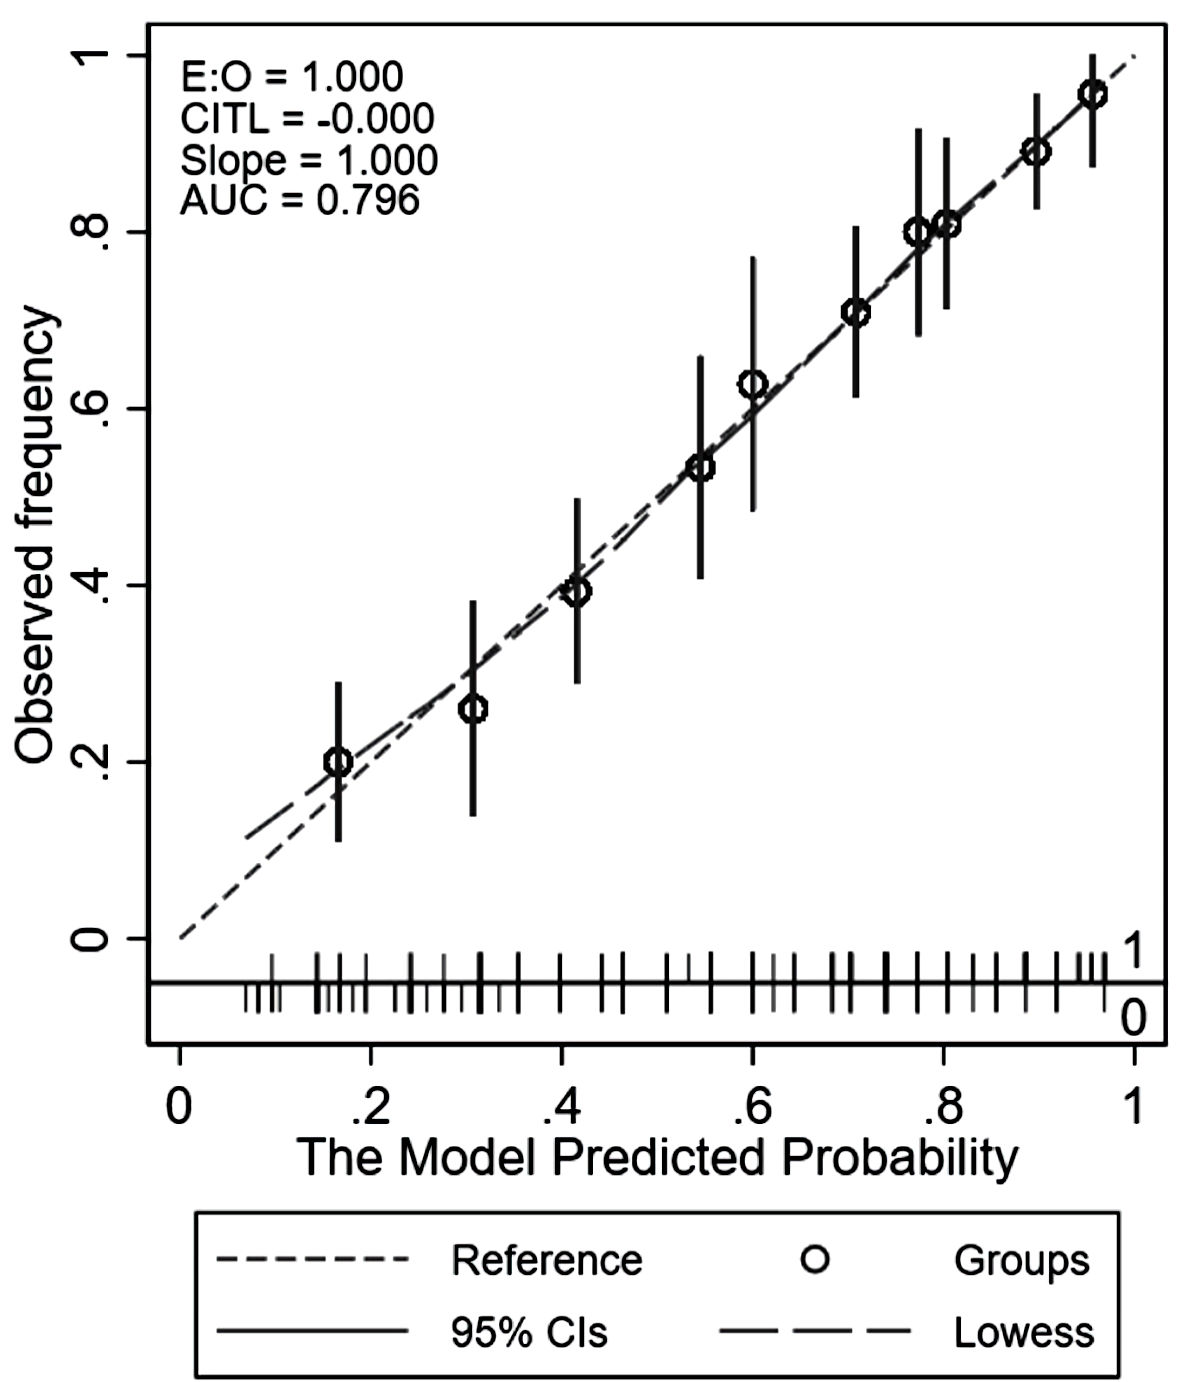
Figure 3. Calibration plot comparing the score-predicted and observed risks of common bile duct stone. AUC: area under the receiver operating characteristic curve; CIs: confidence intervals; CITL: calibration-in-the-large; LOWESS: locally weighted scatterplot smoothing.
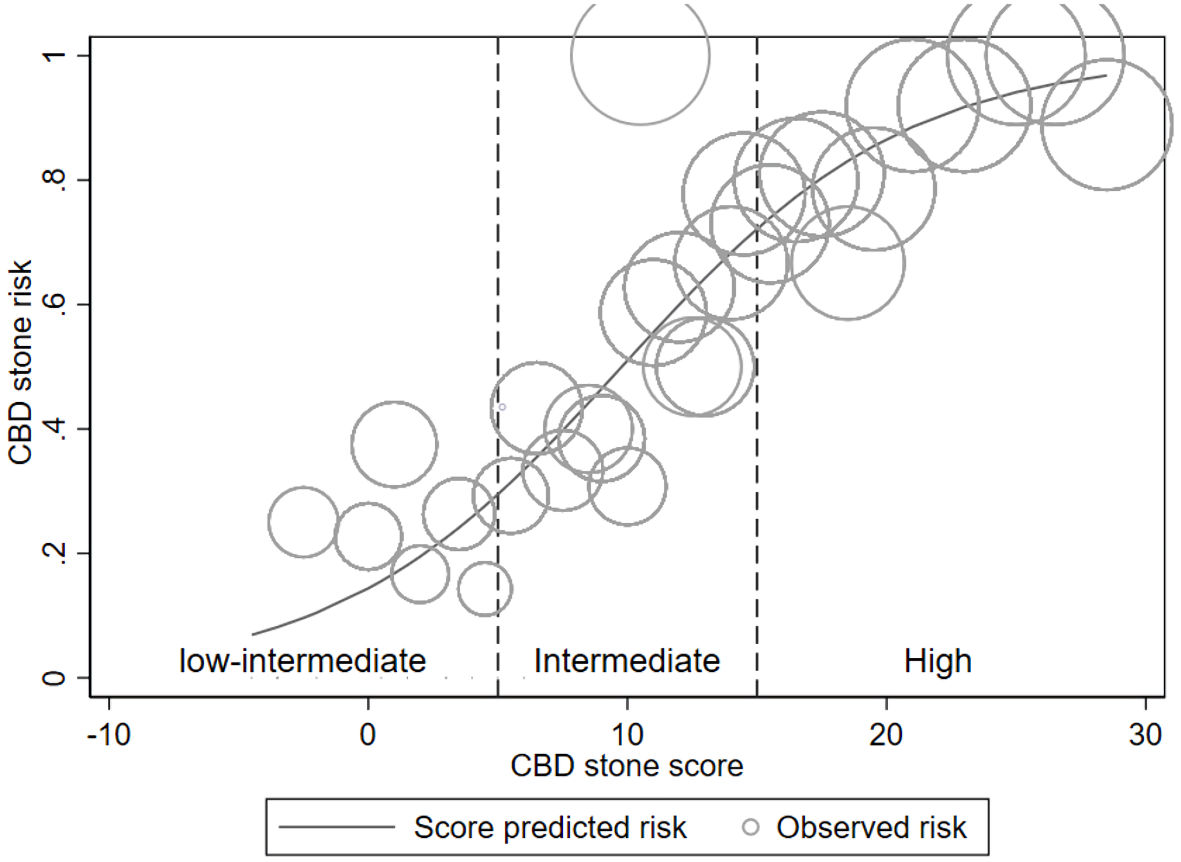
Figure 4. Risk curve. Risk curve illustrating the score-predicted CBD stone risk (solid line) and the observed stone risk (hollow circles) according to risk group (vertical dash line). The relative number of patients corresponds to the circle’s size. CBD: common bile duct.
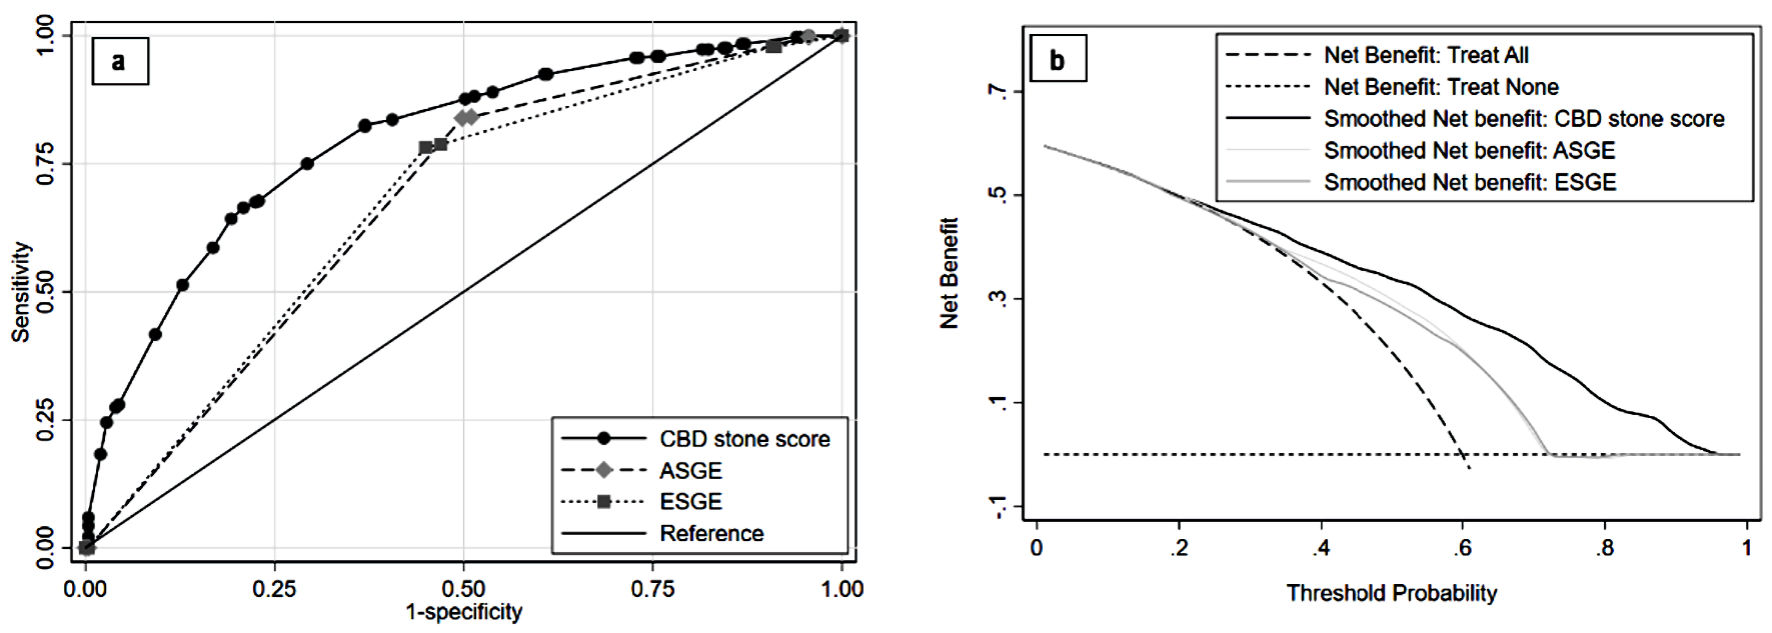
Figure 5. Comparing validation of CBD stone score performance to CBD stone guidelines. Discriminative ability with ROC is shown in (a) and clinical utility with decision curve analysis is shown in (b). ASGE: American Society of Gastrointestinal Endoscopy; CBD: common bile duct; ESGE: European Society of Gastrointestinal Endoscopy; ROC: receiver operating characteristic curve.
Tables
Table 1. Distribution of Variables Between Groups According to CBD Stone Status
| Predictors | CBD stone | P value |
|---|
| Present (n = 372) | Absent (n = 249) |
|---|
| aClinical ≤ 14 days means interval from clinical presentation to reference tests within 14 days. ALP: alkaline phosphatase; CBD: common bile duct; CT: computed tomography; IQR: interquartile range; LFT: liver function test; SGOT: serum glutamic oxaloacetic transaminase; SGPT: serum glutamic pyruvic transaminase; s/p: status-post; SD; standard deviation; TB: total bilirubin. |
| Mean age (± SD) | 65.3 (17.3) | 59.3 (16.1) | < 0.01 |
| Age > 55 years, n (%) | 274 (73.7) | 158 (63.5) | < 0.01 |
| Female, n (%) | 221 (59.4) | 159 (63.9) | 0.28 |
| Clinical manifestations, n (%) | | | |
| Abdominal pain | 87 (23.4) | 61 (24.5) | 0.77 |
| Pancreatitis | 23 (6.2) | 52 (20.9) | < 0.01 |
| Jaundice | 59 (15.9) | 50 (20.1) | 0.20 |
| Cholecystitis | 21 (5.7) | 14 (5.6) | 1.00 |
| Cholangitis | 182 (48.9) | 72 (28.9) | < 0.01 |
| Median days from clinical to reference test (IQR) | 24 (9, 38.5) | 26 (12, 41) | 0.16 |
| Clinical ≤ 14 daysa, n (%) | 124 (33.3) | 72 (28.9) | 0.25 |
| s/p cholecystectomy, n (%) | 41 (11.0) | 20 (8.1) | 0.27 |
| Cirrhosis, n (%) | 11 (3.0) | 17 (6.8) | 0.03 |
| Median LFT results (IQR) | | | |
| SGOT (U/L) | 50 (12, 606) | 30 (12, 418) | < 0.01 |
| SGPT (U/L) | 48 (5, 794) | 28 (5, 691) | < 0.01 |
| ALP (U/L) | 184.5 (51, 1117) | 107 (41, 795) | < 0.01 |
| TB (mg/dL) | 1.23 (0.22, 22.97) | 0.75 (0.22, 10.02) | < 0.01 |
| Categorized LFT results, n (%) | | | |
| ALP 125 - 250 U/L | 95 (25.5) | 73 (29.3) | 0.05 |
| ALP > 250 U/L | 148 (39.8) | 30 (12.1) | < 0.01 |
| TB 1.8 - 4 mg/dL | 66 (17.7) | 35 (14.1) | 0.03 |
| TB > 4 mg/dL | 82 (22.0) | 20 (8.0) | < 0.01 |
| Imaging characteristics, n (%) | | | |
| CT scan | 89 (24.1) | 64 (25.9) | 0.64 |
| Presence of CBD stone | 227 (61.0) | 70 (28.1) | < 0.01 |
| CBD size (mean ± SD) | 12.2 (4.9) | 8.8 (4.0) | < 0.01 |
| CBD dilatation (> 6 mm) | 336 (90.3) | 160 (64.3) | < 0.01 |
Table 2. Simplified (Parsimonious) Modeling With Predictor Odds Ratios, β Coefficients, and Adjusted Scores
| Predictors | Odds ratios | 95% CI | P value | β | Item score |
|---|
| ALP: alkaline phosphatase; β: beta coefficient; CBD: common bile duct; CI: confidence interval; TB: total bilirubin. |
| Intercept | | | | -1.76 | |
| Age > 55 years | 1.84 | 1.21, 2.80 | < 0.01 | 0.61 | 3.5 |
| Pancreatitis | 0.52 | 0.28, 0.96 | 0.04 | -0.65 | -3.5 |
| Cholangitis | 1.39 | 0.93, 2.08 | 0.11 | 0.33 | 2 |
| Cirrhosis | 0.36 | 0.15, 0.84 | 0.02 | -1.03 | -5.5 |
| ALP (U/L) | | | | | |
| 125 - 250 | 1.20 | 0.78, 1.86 | 0.41 | 0.18 | 1 |
| > 250 | 3.35 | 2.02, 5.55 | < 0.01 | 1.21 | 6.5 |
| TB > 4 mg/dL | 2.75 | 1.50, 5.05 | < 0.01 | 1.01 | 5.5 |
| CBD size > 6 mm | 2.75 | 1.64, 4.60 | < 0.01 | 1.01 | 5.5 |
| CBD stone detected | 2.61 | 1.76, 3.87 | < 0.01 | 0.96 | 5.5 |
Table 3. Scoring Model Characteristics and Diagnostic Properties Among the Three Risk Groups
| Risk groups | Score | Prevalencea (%) | CBD stone, n (%) | LHR+ (95% CI) | P value | Classification properties (95% confidence interval) |
|---|
| Present (n = 372) | Absent (n = 249) | Sensitivity | Specificity | PPV | NPV |
|---|
| aPrevalence means proportion of subjects in each risk group. CBD: common bile duct; LHR+: positive likelihood ratio; NPV: negative predictive value; PPV: positive predictive value. |
| Low-intermediate | ≤ 5 | 13.5 | 16 (19.0) | 68 (81.0) | 0.16 (0.09, 0.27) | < 0.01 | 95.7 (93.1, 97.5) | 27.3 (21.9, 33.3) | 66.3 (62.1, 70.3) | 81.0 (70.9, 88.7) |
| Intermediate | 5.5 - 14.5 | 44.6 | 138 (49.8) | 139 (50.2) | 0.66 (0.56, 0.79) | < 0.01 | 37.1 (32.2, 42.2) | 44.2 (37.9, 50.6) | 49.8 (43.8, 55.9) | 32.0 (27.1, 37.2) |
| High | ≥ 15 | 41.9 | 218 (83.9) | 42 (16.1) | 3.47 (2.60, 4.64) | < 0.01 | 58.6 (53.4, 63.7) | 83.1 (77.9, 87.6) | 83.8 (78.8, 88.1) | 57.3 (52.1, 62.5) |