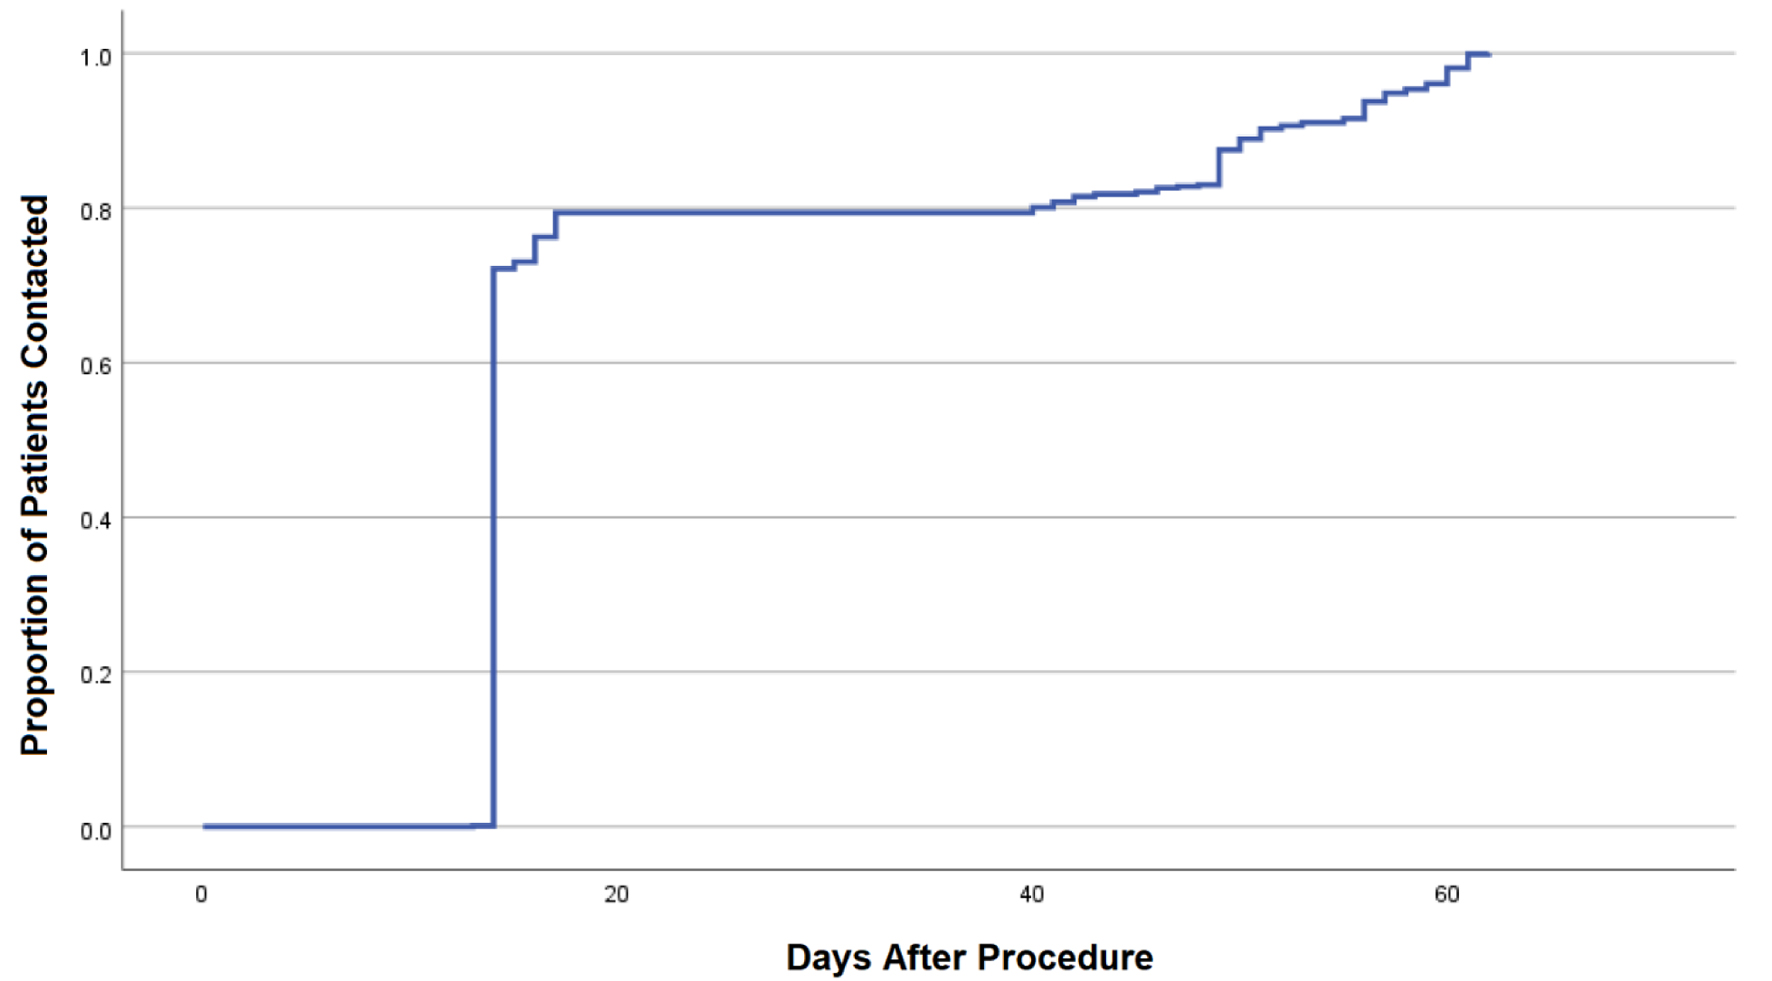
Figure 1. Kaplan-Meier curve demonstrating time from endoscopic procedure to successful phone call and documentation of COVID-19 survey. COVID-19: coronavirus disease 2019.
| Gastroenterology Research, ISSN 1918-2805 print, 1918-2813 online, Open Access |
| Article copyright, the authors; Journal compilation copyright, Gastroenterol Res and Elmer Press Inc |
| Journal website https://www.gastrores.org |
Original Article
Volume 15, Number 4, August 2022, pages 200-206
The Safety of the Re-Opening of an Academic Medical Center Outpatient Endoscopy Unit During the COVID-19 Pandemic
Figures
Tables
| Characteristic | n = 996 |
|---|---|
| SD: standard deviation; BMI: body mass index. | |
| Age (years), mean (± SD) | 58.7 (14.9) |
| Sex | |
| Male (%) | 461 (46.2%) |
| Female (%) | 536 (53.8%) |
| Ethnicity | |
| African American (%) | 206 (20.7%) |
| Asian (%) | 29 (2.9%) |
| Caucasian (%) | 701 (70.3%) |
| Hispanic (%) | 21 (2.1%) |
| Other (%) | 40 (4.0%) |
| BMI, mean (± SD) | 28.5 (7.6) |
| Tobacco use | |
| Never (%) | 519 (52.1%) |
| Former (%) | 131 (13.1%) |
| Current (%) | 347 (34.8%) |
| Comorbidities | |
| Hypertension | 449 (45.1%) |
| Hyperlipidemia | 376 (37.8%) |
| Diabetes mellitus | 181 (18.2%) |
| Coronary artery disease | 63 (6.3%) |
| History of malignancy | 110 (11.0%) |
| Cirrhosis | 43 (4.3%) |
| Inflammatory bowel disease | 54 (5.4%) |
| Liver or kidney transplantation | 12 (1.2%) |
| Endoscopy | |
| Upper endoscopy (%) | 525 (52.7%) |
| Esophagogastroduodenoscopy (EGD) (% total) | 365 (36.6%) |
| Endoscopic retrograde cholangiopancreatography (ERCP) (% total) | 86 (8.6%) |
| Endoscopic ultrasound (% total) | 64 (6.4%) |
| Enteroscopy (% total) | 10 (1%) |
| Lower endoscopy (%) | 330 (33.1%) |
| Colonoscopy (% total) | 323 (32.4%) |
| Flexible sigmoidoscopy or pouchoscopy (% total) | 7 (0.7%) |
| Same day upper and lower endoscopy (%) | 141 (14.1%) |
| Symptom development post-procedure | Total (n = 996) | Upper endoscopic procedure (n = 525) | Lower endoscopic procedure (n = 330) | Upper and lower endoscopic procedure (n = 141) | ||||
|---|---|---|---|---|---|---|---|---|
| Any symptom | 66 (6.6%) | 45 (8.6%) | 9 (2.7%) | 10 (7.1%) | ||||
| Fever | 12 (1.2%) | 9 (1.7%) | 1 (0.3%) | 2 (1.4%) | ||||
| Chills | 4 (0.4%) | 3 (0.5%) | 0 | 1 (0.7%) | ||||
| Shortness of breath | 16 (1.6%) | 11 (2.1%) | 0 | 5 (3.5%) | ||||
| Muscle or body aches | 7 (0.7%) | 4 (0.8%) | 0 | 3 (2.1%) | ||||
| New loss of taste or smell | 2 (0.2%) | 1 (0.2%) | 0 | 1 (0.7%) | ||||
| Sore throat | 9 (0.9%) | 5 (0.9%) | 4 (1.2%) | 0 | ||||
| Congestion or runny nose | 6 (0.6%) | 3 (0.6%) | 2 (0.6%) | 1 (0.7%) | ||||
| Nausea or vomiting | 27 (2.7%) | 17 (3.2%) | 3 (0.9%) | 7 (5.0%) | ||||
| Diarrhea | 19 (1.9%) | 11 (2.1%) | 6 (1.8%) | 2 (1.4%) | ||||
| Self-reported outcomes among symptomatic patients | Yes | No | ||||||
| COVID-19: coronavirus disease 2019. | ||||||||
| “Are symptoms persistent?” | 36 | 30 | ||||||
| “Did you seek medical attention?” | 24 | 40 | ||||||
| “Were you in contact with any person diagnosed with COVID-19 within the last 14 days?” | 2 | 64 | ||||||
| “Were you in contact with any person who has traveled away from home in the last 14 days?” | 1 | 62 | ||||||
| “Did you travel away from home in the last 14 days?” | 3 | 60 | ||||||
| N = 693 | Percentage of those tested (%) | |
|---|---|---|
| COVID-19: coronavirus disease 2019. | ||
| Tested for COVID-19 after endoscopy | 360 | |
| Diagnosed with COVID-19 since endoscopy | 15 | 4.2 |
| Positive ≤ 14 days | 2 | 0.6 |
| Positive > 14 days | 13 | 3.6 |
| Symptomatic patients (in those with positive testing) | 10 | 2.8 |
| Asymptomatic patients (in those with positive testing) | 5 | 1.4 |