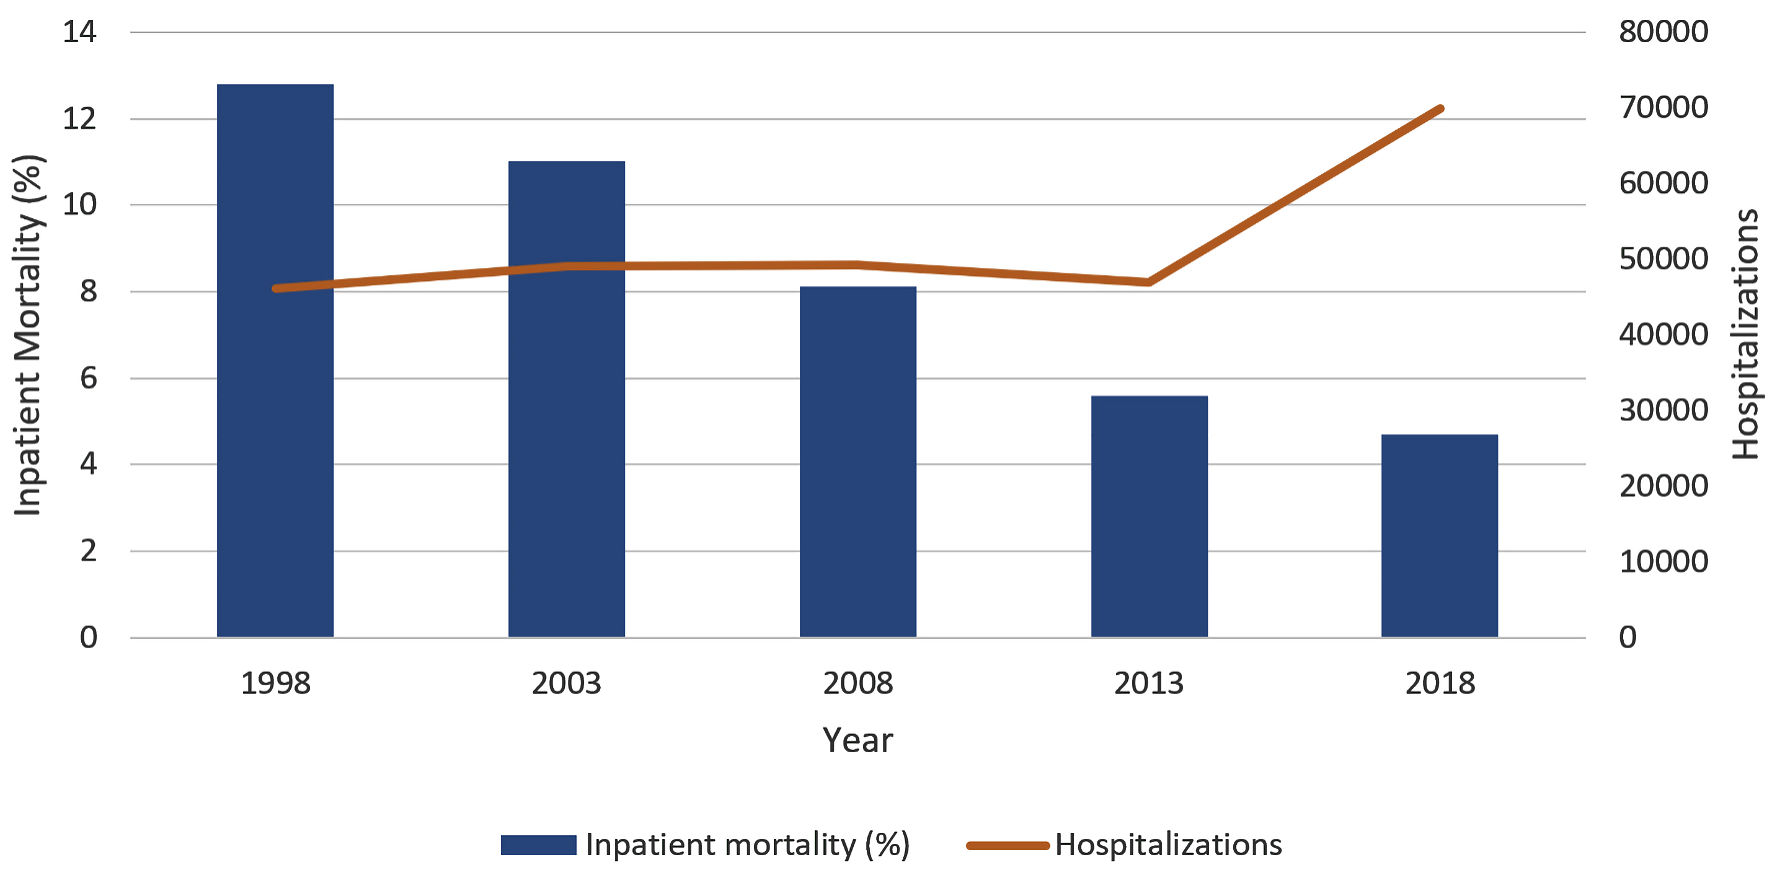
Figure 1. Trends of alcoholic liver cirrhosis hospitalizations (P trend < 0.001) and inpatient mortality (P trend < 0.001).
| Gastroenterology Research, ISSN 1918-2805 print, 1918-2813 online, Open Access |
| Article copyright, the authors; Journal compilation copyright, Gastroenterol Res and Elmer Press Inc |
| Journal website https://www.gastrores.org |
Original Article
Volume 15, Number 2, April 2022, pages 91-99
Trends and Outcomes of Alcoholic Liver Cirrhosis Hospitalizations in the Last Two Decades: Analysis of the Nationwide Inpatient Sample
Figures
Tables
| Variables | 1998 | 2003 | 2008 | 2013 | 2018 |
|---|---|---|---|---|---|
| aPer 100,000 hospitalizations; derived from HCUP-US database. SE: standard error. | |||||
| ALC hospitalizations | 46,186 | 49,144 | 49,254 | 46,864 | 69,970 |
| ALC hospitalizations per 100,000a | 136 | 133 | 129 | 132 | 197 |
| Mean age (years) ± SE | 53.3 ± 0.2 | 52.8 ± 0.2 | 53.3 ± 0.2 | 53.6 ± 0.1 | 54.4 ± 0.1 |
| Males (%) | 72.9 | 74.9 | 74.7 | 72.8 | 70.5 |
| Females (%) | 27.1 | 25.1 | 25.3 | 27.2 | 29.5 |
| Race (%) | |||||
| White | 55.0 | 49.5 | 56.8 | 63.7 | 64.1 |
| Black | 8.6 | 8.4 | 6.9 | 8.2 | 8.4 |
| Hispanic | 12.1 | 17.9 | 14.2 | 18.4 | 18.7 |
| Others | 24.3 | 24.2 | 22.2 | 9.7 | 8.8 |
| Charlson comorbidity index score | |||||
| 0 | 0.0 | 0.0 | 0.0 | 0.0 | 0.0 |
| 1 | 23.1 | 22.1 | 18.8 | 15.3 | 15.4 |
| 2 | 7.8 | 9.2 | 7.1 | 6.2 | 6.9 |
| ≥ 3 | 69.1 | 68.7 | 74.1 | 78.5 | 77.7 |
| Median household income quartiles for patient’s zip code (%) | |||||
| 1 | 11.6 | 33.5 | 32.1 | 33.5 | 32.3 |
| 2 | 34.9 | 27.9 | 28.8 | 26.5 | 27.5 |
| 3 | 29.4 | 23.7 | 21.5 | 23.6 | 22.9 |
| 4 | 24.2 | 14.9 | 17.7 | 16.5 | 17.3 |
| Insurance (%) | |||||
| Medicare | 31.0 | 27.6 | 27.6 | 27.8 | 28.1 |
| Medicaid | 27.5 | 30.9 | 28.9 | 31.8 | 36.9 |
| Private | 29.2 | 27.8 | 29.0 | 23.0 | 24.0 |
| Self-pay | 12.3 | 13.8 | 14.5 | 17.5 | 10.9 |
| Bed size of the hospital (%) | |||||
| Small | 13.1 | 9.8 | 8.6 | 11.2 | 17.8 |
| Medium | 25.5 | 27.0 | 23.3 | 27.2 | 28.6 |
| Large | 61.4 | 63.3 | 68.1 | 61.6 | 53.6 |
| Location/Teaching status of the hospital (%) | |||||
| Rural | 11.2 | 11.9 | 8.1 | 7.2 | 4.9 |
| Urban non-teaching | 38.8 | 40.2 | 41.0 | 37.2 | 20.2 |
| Urban teaching | 50.0 | 47.9 | 50.9 | 55.6 | 74.9 |
| Region of the hospital (%) | |||||
| Northeast | 17.9 | 19.3 | 17.4 | 17.4 | 17.4 |
| Midwest | 19.7 | 16.5 | 18.4 | 18.4 | 20.0 |
| South | 38.2 | 39.4 | 41.4 | 40.8 | 40.0 |
| West | 24.4 | 24.8 | 22.8 | 23.4 | 22.6 |
| 1998 | 2003 | 2008 | 2013 | 2018 | P value | |
|---|---|---|---|---|---|---|
| LOS: length of stay; THC: total hospital charge. | ||||||
| Inpatient mortality (%) | 12.8 | 11.0 | 8.1 | 5.6 | 4.7 | < 0.001 |
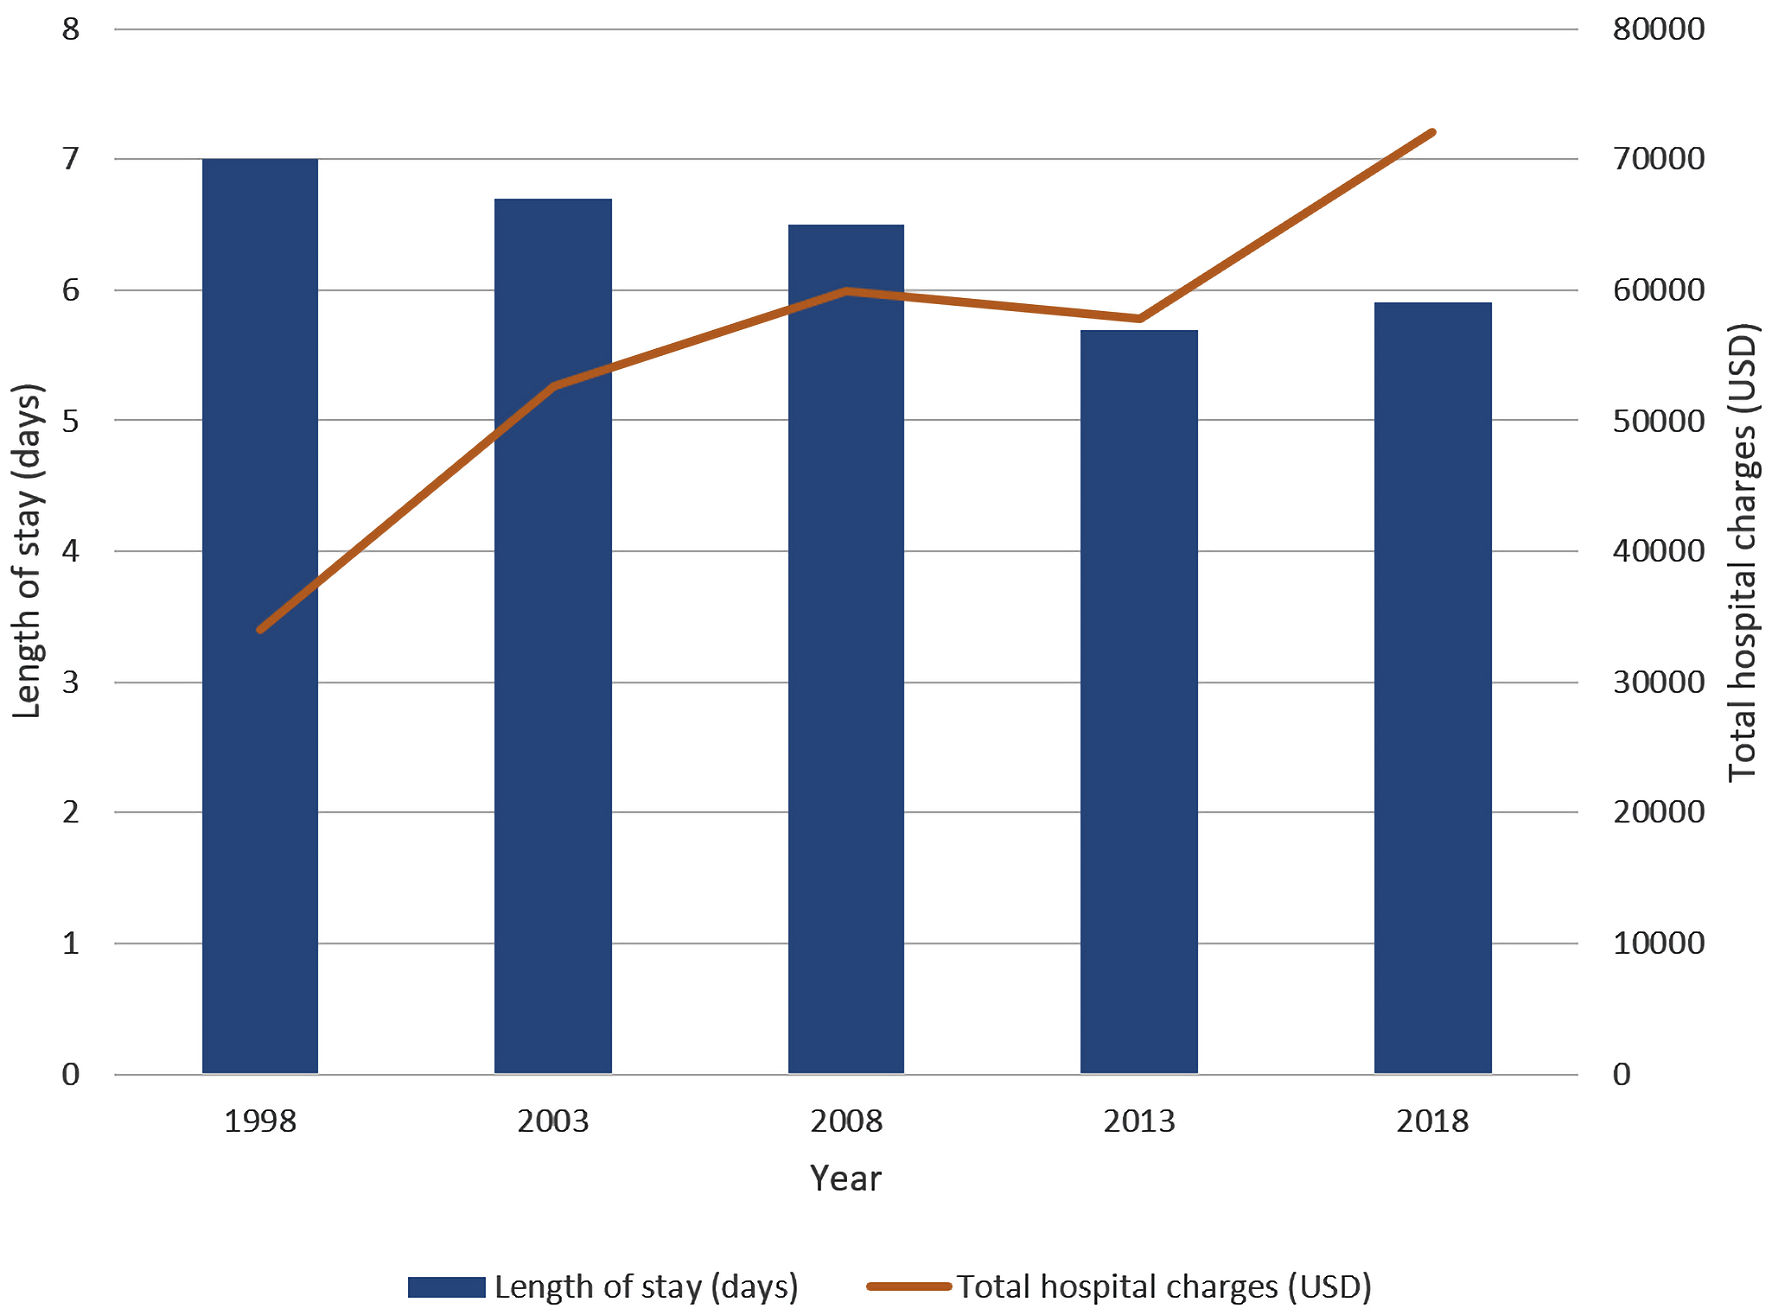
| LOS (days) | 7.0 | 6.7 | 6.5 | 5.7 | 5.9 | < 0.001 |
| THC ($) | 33,940 | 52,589 | 59,853 | 57,864 | 72,062 | < 0.001 |