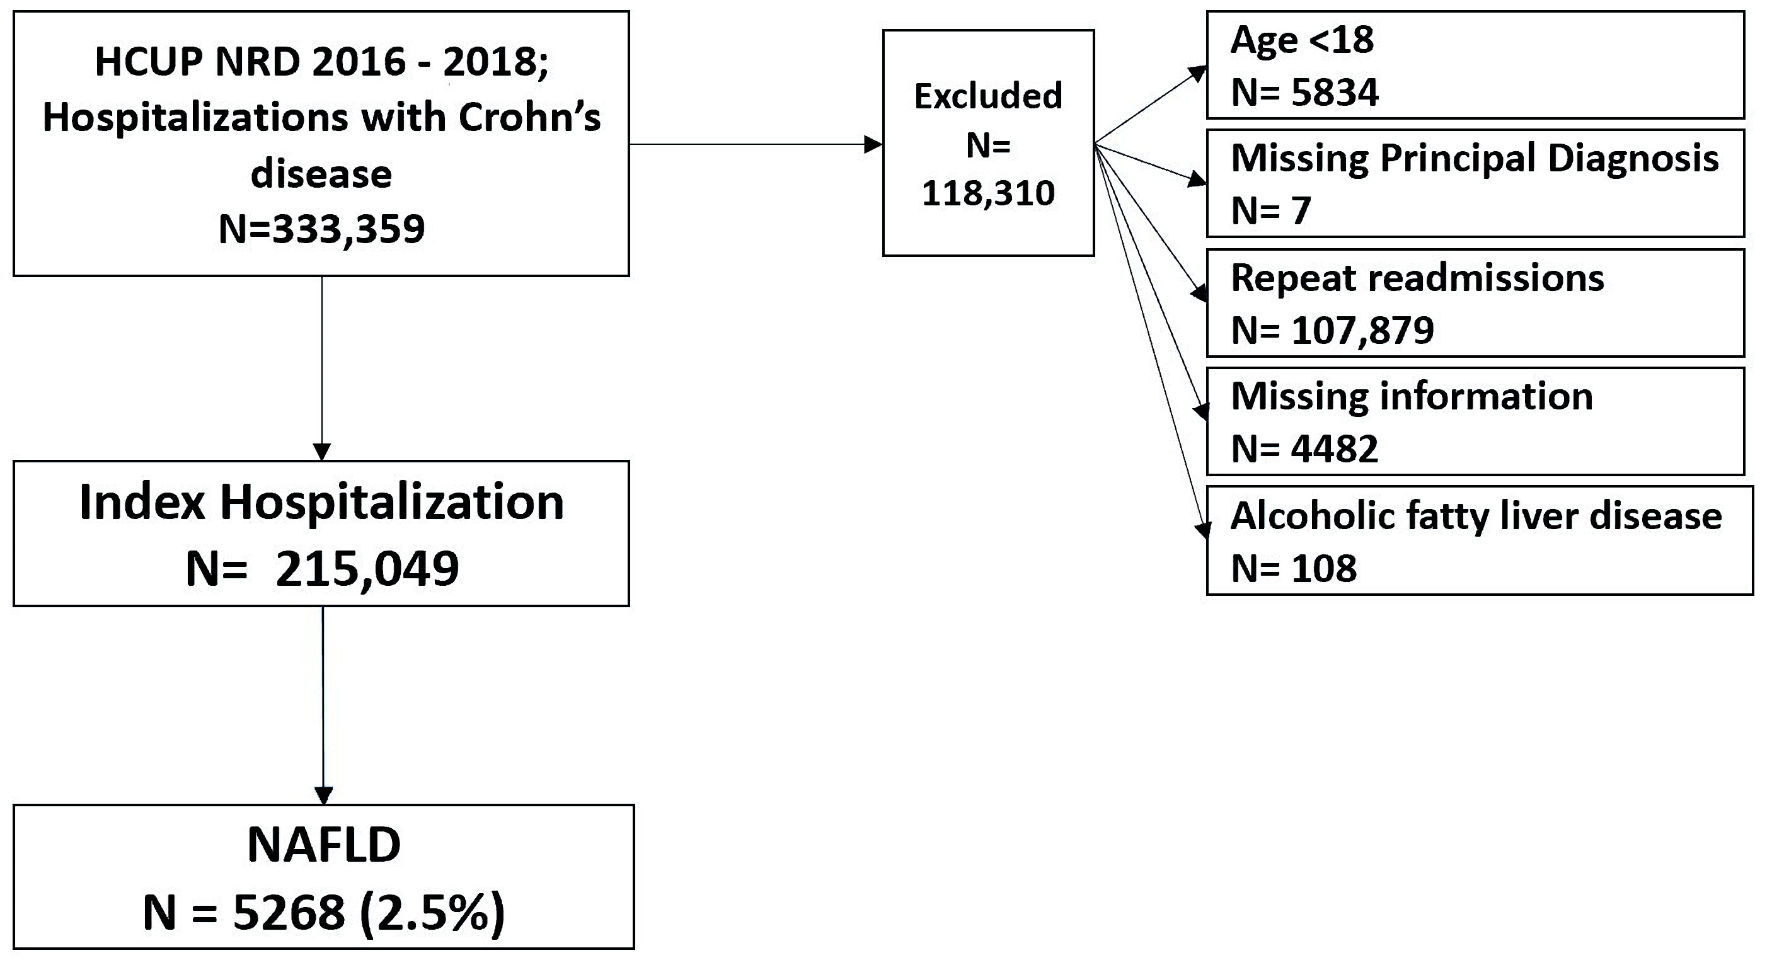
Figure 1. Case selection flowchart. NAFLD: non-alcoholic fatty liver disease; HCUP: Healthcare Cost and Utilization Project; NRD: Nationwide Readmissions Database.
| Gastroenterology Research, ISSN 1918-2805 print, 1918-2813 online, Open Access |
| Article copyright, the authors; Journal compilation copyright, Gastroenterol Res and Elmer Press Inc |
| Journal website https://www.gastrores.org |
Original Article
Volume 15, Number 2, April 2022, pages 82-90
Burden and Predictors of Non-Alcoholic Fatty Liver Disease in a Retrospective Cohort of Patients With Crohn’s Disease
Figure
Tables
| NAFLD absent, n = 209,781 | NAFLD present, n = 5,268 | P value | |
|---|---|---|---|
| aMann-Whitney test. bPearson Chi-square test. CD: Crohn’s disease; NAFLD: non-alcoholic fatty liver disease; IQR: interquartile range. | |||
| Median age, years (IQR) | 53 (36 - 68) | 53 (42 - 63) | 0.59a |
| Age group, % | |||
| Age 18 - 44 | 37.1 | 29.8 | < 0.001b |
| Age 45 - 64 | 32.5 | 47.8 | |
| Age 65 or older | 30.4 | 22.3 | |
| Gender, % | |||
| Male | 42.3 | 40.6 | 0.014b |
| Female | 57.7 | 59.4 | |
| Median household income for patient’s ZIP code, % | |||
| 0 - 25th percentile | 23.4 | 23.4 | 0.06b |
| 26th - 50th percentile | 26.5 | 27.8 | |
| 51st - 75th percentile | 26.5 | 26.5 | |
| 76th - 100th percentile | 23.6 | 22.3 | |
| Bed size of the hospital, % | |||
| Small | 15.8 | 17 | 0.021b |
| Medium | 27.9 | 28.3 | |
| Large | 56.3 | 54.7 | |
| Expected primary payer, % | |||
| Medicare | 40.4 | 37.7 | 0.002b |
| Medicaid | 14.5 | 14.6 | |
| Private insurance | 38.2 | 40.3 | |
| Self-pay | 3.6 | 4.1 | |
| Others | 0.5 | 0.5 | |
| Patient location, % | |||
| Central counties of metro areas | 24.4 | 23.7 | 0.037b |
| Fringe counties of metro areas | 29.5 | 29.2 | |
| Counties in metro areas of 250,000 - 999,999 population | 22.6 | 24.4 | |
| Counties in metro areas of 50,000 - 249,999 population | 10 | 10 | |
| Micropolitan counties | 8 | 7.2 | |
| Not metropolitan or micropolitan counties | 5.6 | 5.6 | |
| NAFLD absent, n = 209,781 | NAFLD present, n = 5,268 | P value | |
|---|---|---|---|
| aPearson Chi-square test. bFisher’s exact test. CD: Crohn’s disease; NAFLD: non-alcoholic fatty liver disease; LFT: liver function test. | |||
| Hypertension, % | 29.8 | 41.5 | < 0.001a |
| Diabetes mellitus, % | 15.2 | 28.5 | < 0.001a |
| Obesity, % | 11.3 | 29.3 | < 0.001a |
| Dyslipidemia, % | 21.1 | 28.2 | < 0.001a |
| Metabolic syndrome, % | 0.1 | 0.7 | < 0.001a |
| Vitamin A deficiency, % | 0.01 | 0.2 | < 0.001a |
| Vitamin D deficiency, % | 3.1 | 4.9 | < 0.001a |
| Vitamin E deficiency, % | 0.01 | 0.1 | 0.009b |
| Vitamin K deficiency, % | 0.04 | 0.1 | 0.49b |
| Pyridoxine deficiency, % | 0.01 | 0.01 | 0.616a |
| Thrombocytopenia, % | 3.6 | 9.4 | < 0.001a |
| Vitamin B12 deficiency, % | 0.4 | 0.6 | 0.026a |
| Abnormal LFT, % | 0.2 | 0.6 | < 0.001a |
| Gallstone disease, % | 1.1 | 4.2 | < 0.001a |
| Chronic pancreatitis, % | 0.8 | 2.7 | < 0.001a |
| Clostridium difficile enterocolitis, % | 2.6 | 3.6 | < 0.001a |
| Portal hypertension, % | 0.6 | 5 | < 0.001a |
| NAFLD absent, n = 209,781 | NAFLD present, n = 5,268 | P valuea | |
|---|---|---|---|
| aP value for Pearson Chi-square test. CD: Crohn’s disease; NAFLD: non-alcoholic fatty liver disease. | |||
| CD with fistula, % | 3.5 | 2.2 | < 0.001 |
| CD with rectal bleeding, % | 3.9 | 5.1 | < 0.001 |
| CD with abscess, % | 3.3 | 2.1 | < 0.001 |
| CD with intestinal obstruction, % | 10.4 | 9.3 | 0.017 |
| NAFLD absent, n = 209,781 | NAFLD present, n = 5,268 | P value | |
|---|---|---|---|
| aMann-Whitney test. bPearson Chi-square test. CD: Crohn’s disease; NAFLD: non-alcoholic fatty liver disease; LOS: length of stay; IQR: interquartile range. | |||
| Median LOS, days (IQR) | 3 (2 - 6) | 4 (2 - 6) | < 0.001a |
| Mortality, % | 1.2 | 1 | 0.204b |
| All-cause 30-day non-elective readmission, % | 11.1 | 11.7 | 0.172b |
| Median total charges (IQR) | $30,782 ($16,847 - $58,667) | $32,305.5 ($18,600 - $61,599) | < 0.001a |
| NASH absent, n = 214,149 | NASH present, n = 900 | P value | |
|---|---|---|---|
| aMann-Whitney test. bPearson Chi-square test. CD: Crohn’s disease; NASH: non-alcoholic steatohepatitis; LOS: length of stay; IQR: interquartile range. | |||
| Median LOS, days (IQR) | 3 (2 - 6) | 4 (2 - 6) | < 0.001a |
| Mortality, % | 1.2 | 2.2 | 0.004b |
| All-cause 30-day non-elective readmission, % | 11.1 | 15.6 | < 0.001b |
| Median total charges (IQR) | $30,821 ($16,891 - $58,718) | $30,422 ($17,683 - $66,474) | 0.083a |
| 30-day readmission primary diagnosis | Ratea |
|---|---|
| aRate as per 100 readmission records. CD: Crohn’s disease; NASH: non-alcoholic steatohepatitis. | |
| Sepsis, unspecified organism | 1.7 |
| Hepatic failure, unspecified with coma | 1.7 |
| Acute kidney failure, unspecified | 1.6 |
| CD without complications | 1.4 |
| Unspecified cirrhosis of liver | 1.3 |
| CD of small intestine with intestinal obstruction | 0.9 |
| Enterocolitis due to Clostridium difficile | 0.7 |
| Hypertensive heart and chronic kidney disease | 0.6 |
| Pneumonia, unspecified organism | 0.6 |
| Acute and subacute hepatic failure without coma | 0.6 |
| Nonalcoholic steatohepatitis (NASH) | 0.6 |
| Predictor | Odds ratio | 95% CI (lower - upper) | P value |
|---|---|---|---|
| CD: Crohn’s disease; NAFLD: non-alcoholic fatty liver disease; CI: confidence interval; LFT: liver function test. | |||
| Vitamin A deficiency | 9.89 | 4.49 - 21.76 | < 0.001 |
| Portal hypertension | 5.35 | 4.60 - 6.21 | < 0.001 |
| Abnormal LFT | 3.29 | 2.29 - 4.72 | < 0.001 |
| Metabolic syndrome | 2.69 | 1.84 - 3.94 | < 0.001 |
| Obesity | 2.84 | 2.65 - 3.04 | < 0.001 |
| Diabetes mellitus | 1.81 | 1.68 -1.96 | < 0.001 |
| Vitamin D deficiency | 1.43 | 1.25 - 1.63 | < 0.001 |
| Hypertension | 1.45 | 1.41 - 1.6 | < 0.001 |
| Vitamin B12 deficiency | 1.56 | 1.1 - 2.21 | 0.013 |
| CD with rectal bleeding | 1.31 | 1.16 - 1.49 | < 0.001 |
| Dyslipidemia | 1.29 | 1.2 - 1.39 | < 0.001 |
| CD with fistula | 0.76 | 0.63 - 0.91 | 0.004 |
| Female sex | 1.07 | 1.01 - 1.13 | 0.023 |
| Gallstone disease | 3.44 | 2.97 - 3.99 | < 0.001 |
| Chronic pancreatitis | 2.73 | 2.28 - 3.27 | < 0.001 |
| Thrombocytopenia | 2.14 | 1.93 - 2.38 | < 0.001 |
| Clostridium difficile enterocolitis | 1.41 | 1.22 - 1.64 | < 0.001 |
| Age (years) | |||
| 18 - 44 | Reference | ||
| 45 - 64 | 1.23 | 1.14 - 1.32 | < 0.001 |
| ≥ 65 | 0.59 | 0.54 - 0.64 | < 0.001 |