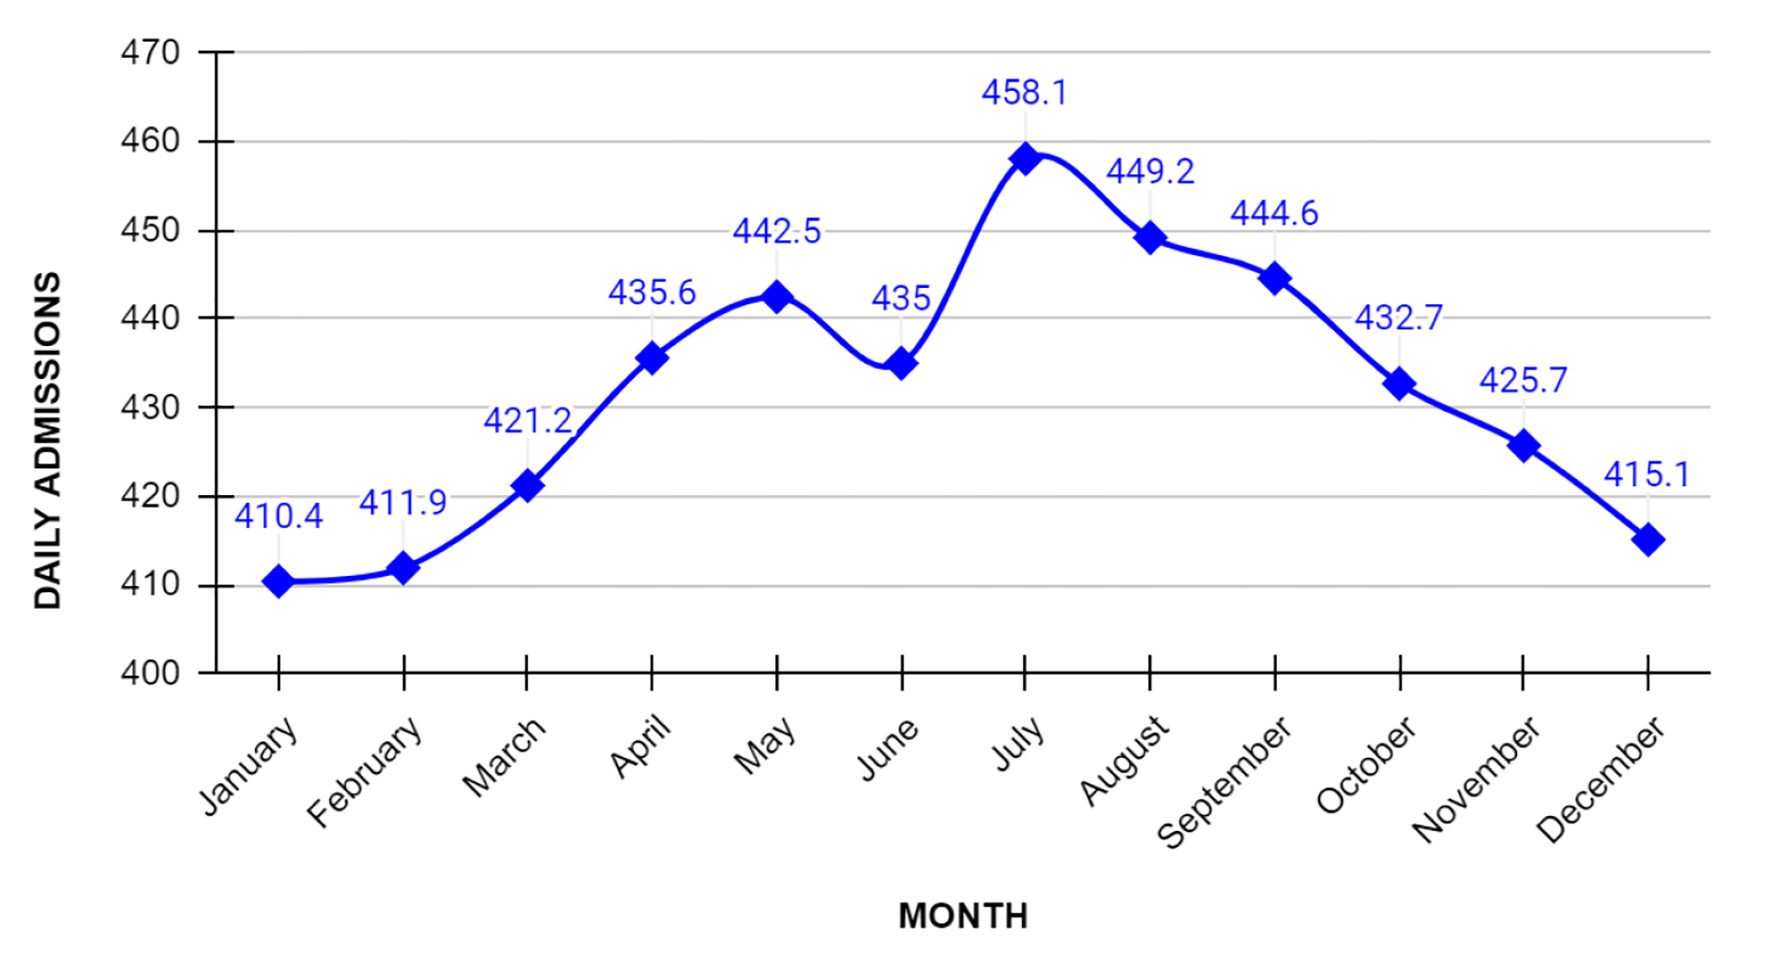
Figure 1. Daily admission for alcohol-related hepatitis based on each month. July was noted to have the highest number of daily admissions for alcohol-related hepatitis in the country.
| Gastroenterology Research, ISSN 1918-2805 print, 1918-2813 online, Open Access |
| Article copyright, the authors; Journal compilation copyright, Gastroenterol Res and Elmer Press Inc |
| Journal website https://www.gastrores.org |
Original Article
Volume 15, Number 2, April 2022, pages 75-81
Seasonal Variations of Hospital Admissions for Alcohol-Related Hepatitis in the United States
Figures
Tables
| Variables | N (%) |
|---|---|
| Mean age (years) | 49.5 (49.45 - 49.62) |
| Age | |
| 18 - 44 | 217,500 (34.47%) |
| 45 - 65 | 355,575 (56.34%) |
| > 65 | 57,975 (9.19%) |
| Sex | |
| Males | 423,785 (67.16%) |
| Females | 207,215 (32.84%) |
| Race | |
| White | 427,630 (70.1%) |
| Black | 60,780 (10%) |
| Hispanic | 80,720 (13.2%) |
| Asian/Pacific Islander | 7,260 (1.19%) |
| Native American | 15,630 (2.56%) |
| Other | 17,440 (2.86%) |
| Hospital location/teaching | |
| Rural | 45,590 (7.22%) |
| Urban non-teaching | 142,475 (22.58%) |
| Urban teaching | 443,005 (70.2%) |
| Hospital size | |
| Small | 132,755 (21.04%) |
| Medium | 188,235 (29.83%) |
| Large | 310,080 (49.14%) |
| Length of stay | 6.42 (6.37 - 6.49) |
| Total hospitalization charges | 65,070.4 (63,828.1 - 66,312.7) |
| Month | Incidence risk ratio | 95% confidence interval | P-value |
|---|---|---|---|
| July was noted to have highest incidence of alcohol-related hepatitis as compared to January. The results were adjusted for patient demographics, hospital characteristics and Charlson comorbidities. | |||
| January | Reference | ||
| February | 0.99 | 0.97 - 1.03 | 0.702 |
| March | 1.03 | 1.02 - 1.06 | 0.034 |
| April | 1.08 | 1.05 - 1.11 | < 0.001 |
| May | 1.10 | 1.07 - 1.13 | < 0.001 |
| June | 1.09 | 1.06 - 1.12 | < 0.001 |
| July | 1.15 | 1.12 - 1.18 | < 0.001 |
| August | 1.10 | 1.07 - 1.14 | < 0.001 |
| September | 1.10 | 1.07 - 1.14 | < 0.001 |
| October | 1.07 | 1.05 - 1.11 | < 0.001 |
| November | 1.06 | 1.03 - 1.09 | < 0.001 |
| December | 1.04 | 1.01 - 1.07 | 0.013 |
| Month | Odds ratio | 95% confidence interval | P-value |
|---|---|---|---|
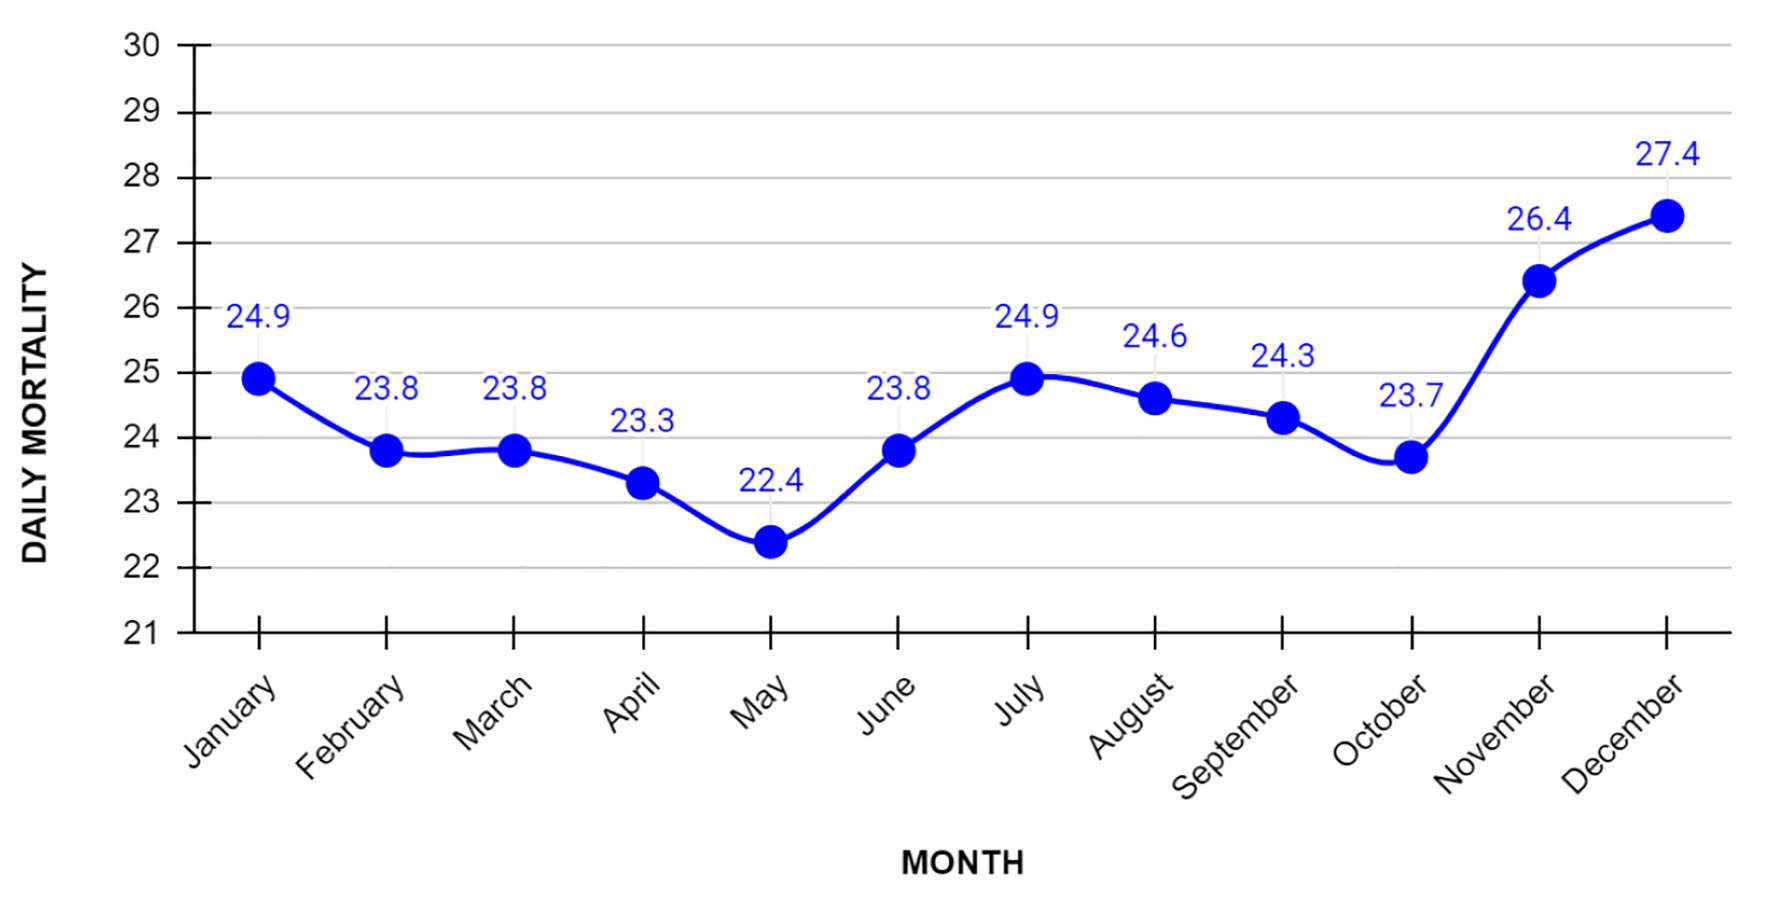
| It is noted that November, December and January have the highest mortality rates after adjusting for confounding factors. | |||
| January | 1.19 | 1.05 - 1.35 | 0.01 |
| February | 1.12 | 0.99 - 1.28 | 0.08 |
| March | 1.12 | 0.99 - 1.26 | 0.09 |
| April | 1.05 | 0.92 - 1.19 | 0.49 |
| May | Reference | ||
| June | 1.11 | 0.98 - 1.26 | 0.10 |
| July | 1.11 | 0.98 - 1.25 | 0.10 |
| August | 1.08 | 0.96 - 1.22 | 0.22 |
| September | 1.10 | 0.97 - 1.24 | 0.16 |
| October | 1.08 | 0.95 - 1.22 | 0.24 |
| November | 1.23 | 1.09 - 1.40 | 0.00 |
| December | 1.29 | 1.14 - 1.46 | 0.00 |