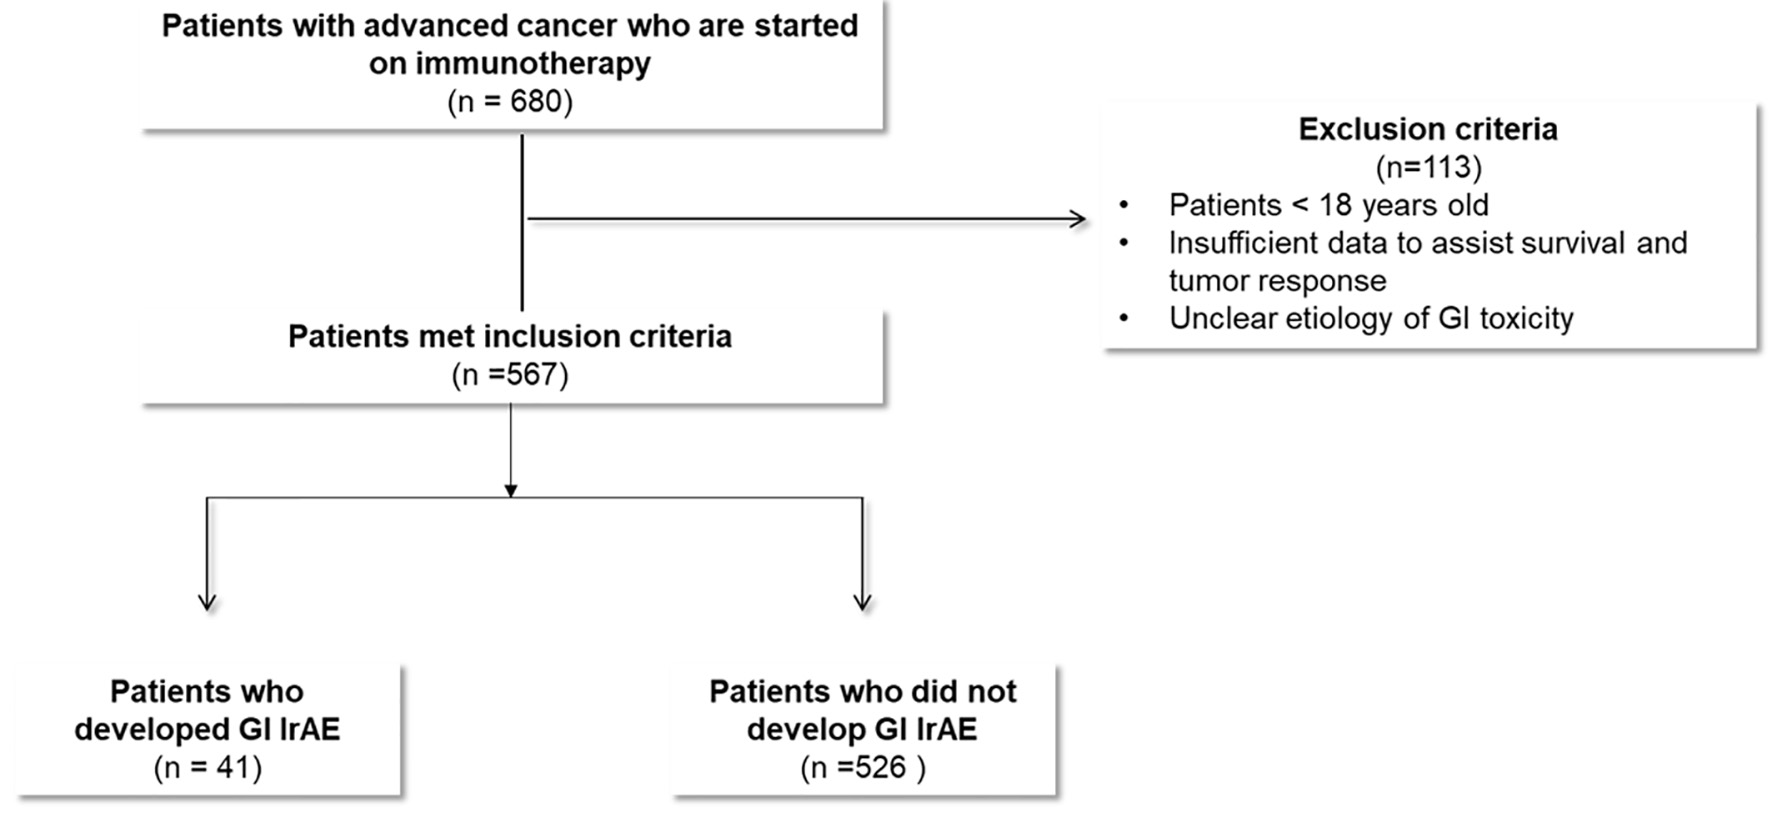
Figure 1. Study flow diagram.
| Gastroenterology Research, ISSN 1918-2805 print, 1918-2813 online, Open Access |
| Article copyright, the authors; Journal compilation copyright, Gastroenterol Res and Elmer Press Inc |
| Journal website https://www.gastrores.org |
Original Article
Volume 15, Number 2, April 2022, pages 56-66
Gastrointestinal Toxicities of Immune Checkpoint Inhibitors Are Associated With Enhanced Tumor Responsiveness and Improved Survival
Figures
Tables
| Characteristics | All patients, n (%) | GI adverse event, n (%) | No GI adverse event, n (%) | P value |
|---|---|---|---|---|
| aDominator is number of total immunotherapy cycles, not number of patients. GI: gastrointestinal; BMI: body mass index. | ||||
| Number of patients | 567 (100) | 41 (100) | 526 (100) | - |
| Age, years | ||||
| Median (range) | 66 (20 - 94) | 67 (20 - 94) | 64 (34 - 81) | 0.41 |
| > 60 | 377 (66.5) | 28 (68.3) | 349 (65.8) | 0.80 |
| Male gender | 369 (65.1) | 30 (73.2) | 339 (64.4) | 0.26 |
| White race | 510 (89.9) | 41 (100) | 469 (89.2) | 0.026 |
| BMI, kg/m2, median (range) | 26 (14 - 51) | 26 (17 - 40) | 26 (14 - 51) | 0.34 |
| Malignancy | ||||
| Melanoma | 96 (16.9) | 18 (43.9) | 78 (14.8) | < 0.0001 |
| Non-small cell lung cancer | 250 (44.1) | 9 (22.0) | 241 (45.8) | 0.003 |
| Renal cell carcinoma | 76 (13.4) | 7 (17.1) | 69 (13.1) | 0.47 |
| Breast | 7 (1.2) | 2 (4.9) | 5 (1.0) | 0.028 |
| Bladder/urothelial cancer | 49 (8.6) | 1 (2.4) | 48 (9.1) | 0.14 |
| Small cell lung cancer | 19 (3.4) | 1 (2.4) | 18 (3.4) | 0.74 |
| Lymphoma/multiple myeloma | 19 (3.4) | 1 (2.4) | 18 (3.4) | 0.74 |
| Ovarian | 9 (1.6) | 1 (2.4) | 8 (1.5) | 0.65 |
| Other | 22 (3.9) | 1 (2.4) | 21 (4.0) | 0.62 |
| Head and neck | 20 (3.5) | 0 (0) | 20 (3.8) | 0.20 |
| No of cycles of immunotherapy | 608 | 41 | 567 | - |
| Response to immunotherapya | 0.003 | |||
| Yes | 167 (27.5) | 17 (41.4) | 150 (26.5) | |
| No | 334 (54.9) | 12 (29.3) | 322 (56.8) | |
| Unknown | 107 (17.6) | 12 (29.3) | 95 (16.7) | |
| Intensity of each immunotherapy cyclea | < 0.0001 | |||
| Dual immunotherapy | 55 (9.0) | 12 (29.3) | 43 (7.6) | |
| Mono-immunotherapy | 553 (91.0) | 29 (70.7) | 524 (92.4) | |
| Immunotherapy regimensa | ||||
| Nivolumab | 306 (50.3) | 13 (31.7) | 293 (51.7) | 0.014 |
| Pembrolizumab | 142 (23.4) | 9 (22.0) | 133 (23.5) | 0.83 |
| Ipilimumab | 29 (4.8) | 3 (7.3) | 26 (4.6) | 0.43 |
| Atezolizumab | 62 (10.2) | 2 (4.9) | 60 (10.6) | 0.24 |
| Avelumab | 8 (1.3) | 2 (4.9) | 6 (1.1) | 0.038 |
| Durvalumab | 6 (1.0) | 0 (0) | 6 (1.1) | 0.51 |
| Nivolumab and ipilimumab | 44 (7.2) | 11 (26.8) | 33 (5.8) | < 0.0001 |
| Pembrolizumab and ipilimumab | 5 (0.8) | 1 (2.4) | 4 (0.7) | 0.24 |
| Nivolumab and atezolizumab | 3 (0.5) | 0 (0) | 3 (0.5) | 0.64 |
| Nivolumab and pembrolizumab | 1 (0.2) | 0 (0) | 1 (0.2) | 0.79 |
| Pembrolizumab and atezolizumab | 1 (0.2) | 0 (0) | 1 (0.2) | 0.79 |
| Pembrolizumab and avelumab | 1 (0.2) | 0 (0) | 1 (0.2) | 0.79 |
| Characteristics | All GI adverse events, n (%) | Colitis, n (%) | Hepatitis, n (%) | Gastritis, n (%) | Pancreatitis, n (%) |
|---|---|---|---|---|---|
| GI: gastrointestinal. | |||||
| Number of patients | 41 (100) | 17 (100) | 23 (100) | 2 (100) | 4 (100) |
| Severity grade | |||||
| 1 or 2 | 23 (56.1) | 7 (41.2) | 16 (72.7) | 2 (100) | 2 (50.0) |
| 3 or more | 18 (43.9) | 10 (58.8) | 6 (27.3) | 0 (0) | 2 (50.0) |
| 1 | 9 (22.0) | 2 (11.8) | 8 (34.8) | 1 (50.0) | 0 (0) |
| 2 | 14 (34.1) | 5 (29.4) | 9 (39.1) | 1 (50.0) | 2 (50.0) |
| 3 | 14 (34.1) | 8 (47.0) | 4 (17.4) | 0 (0) | 2 (50.0) |
| 4 | 3 (7.3) | 2 (11.8) | 1 (4.3) | 0 (0) | 0 (0) |
| 5 | 1 (2.4) | 0 (0) | 1 (4.3) | 0 (0) | 0 (0) |
| Dominant symptoms | |||||
| Laboratory abnormalities only | 16 (39.0) | 0 (0) | 15 (65.2) | 0 (0) | 1 (25.0) |
| Diarrhea | 13 (31.7) | 12 (70.6) | 2 (8.7) | 1 (50.0) | 2 (50.0) |
| Abdominal pain | 7 (17.1) | 2 (11.8) | 4 (17.4) | 0 (0) | 1 (25.0) |
| Abdominal pain and diarrhea | 2 (4.9) | 2 (11.8) | 1 (4.3) | 0 (0) | 0 (0) |
| Severe fatigue | 2 (4.9) | 1 (5.9) | 1 (4.3) | 0 (0) | 0 (0) |
| Dyspepsia | 1 (2.4) | 0 (0) | 0 (0) | 1 (50.0) | 0 (0) |
| Treated with steroid | |||||
| Yes (> 4 weeks) | 27 (65.9) | 10 (58.8) | 18 (78.3) | 1 (50.0) | 1 (25.0) |
| Yes (< 4 weeks) | 8 (19.5) | 5 (29.4) | 2 (8.7) | 1 (50.0) | 1 (25.0) |
| No | 3 (7.3) | 0 (0) | 2 (8.7) | 0 (0.0) | 1 (25.0) |
| Unknown | 3 (7.3) | 2 (11.8) | 1 (4.3) | 0 (0.0) | 1 (25.0) |
| Characteristics | Nivolumab, n (%) | Pembrolizumab, n (%) | Ipilimumab, n (%) | Atezolizumab, n (%) | Avelumab, n (%) | Nivolumab and ipilimumab, n (%) | Pembrolizumab and ipilimumab, n (%) |
|---|---|---|---|---|---|---|---|
| No. of total cycles | 306 (100) | 142 (100) | 29 (100) | 62 (100) | 8 (100) | 44 (100) | 5 (100) |
| Severity grade | |||||||
| 1 or 2 | 9 (2.9) | 10 (7.0) | 1 (3.4) | 1 (1.6) | 2 (25) | 7 (15.9) | 0 (0) |
| 3 or more | 4 (1.0) | 4 (2.8) | 2 (6.9) | 1 (1.6) | 0 (0) | 6 (13.6) | 1 (20) |
| 1 | 4 (1.3) | 2 (1.4) | 1 (3.4) | 0 (0) | 1 (12.5) | 2 (4.5) | 0 (0) |
| 2 | 5 (1.6) | 4 (2.8) | 0 (0) | 1 (1.6) | 1 (12.5) | 5 (11.4) | 0 (0) |
| 3 | 2 (0.7) | 4 (2.8) | 1 (3.4) | 1 (1.6) | 0 (0) | 5 (11.4) | 1 (20) |
| 4 | 1 (0.3) | 0 (0) | 1 (3.4) | 0 (0) | 0 (0) | 1 (2.3) | 0 (0) |
| 5 | 1 (0.3) | 0 (0) | 0 (0) | 0 (0) | 0 (0) | 0 (0) | 0 (0) |
| Type of adverse event | |||||||
| Colitis | 3 (1.0) | 3 (2.1) | 2 (6.9) | 1 (1.6) | 0 (0) | 7 (15.9) | 1 (20) |
| Hepatitis | 9 (2.9) | 7 (4.9) | 1 (3.4) | 0 (0) | 2 (25) | 4 (9.1) | 0 (0) |
| Gastritis | 0 (0) | 0 (0) | 0 (0) | 1 (1.6) | 0 (0) | 1 (2.3) | 0 (0) |
| Pancreatitis | 1 (0.3) | 1 (0.7) | 0 (0) | 0 (0) | 0 (0) | 2 (4.5) | 0 (0) |
| Variables | Multivariable analysisa | |
|---|---|---|
| Hazard ratio (95% CI) | P value | |
| aAnalysis was adjusted for age (per 1-year increase) and immunotherapy (mono- vs. dual-therapy). CI: confidence interval. | ||
| Gastrointestinal adverse events (yes vs. no) | ||
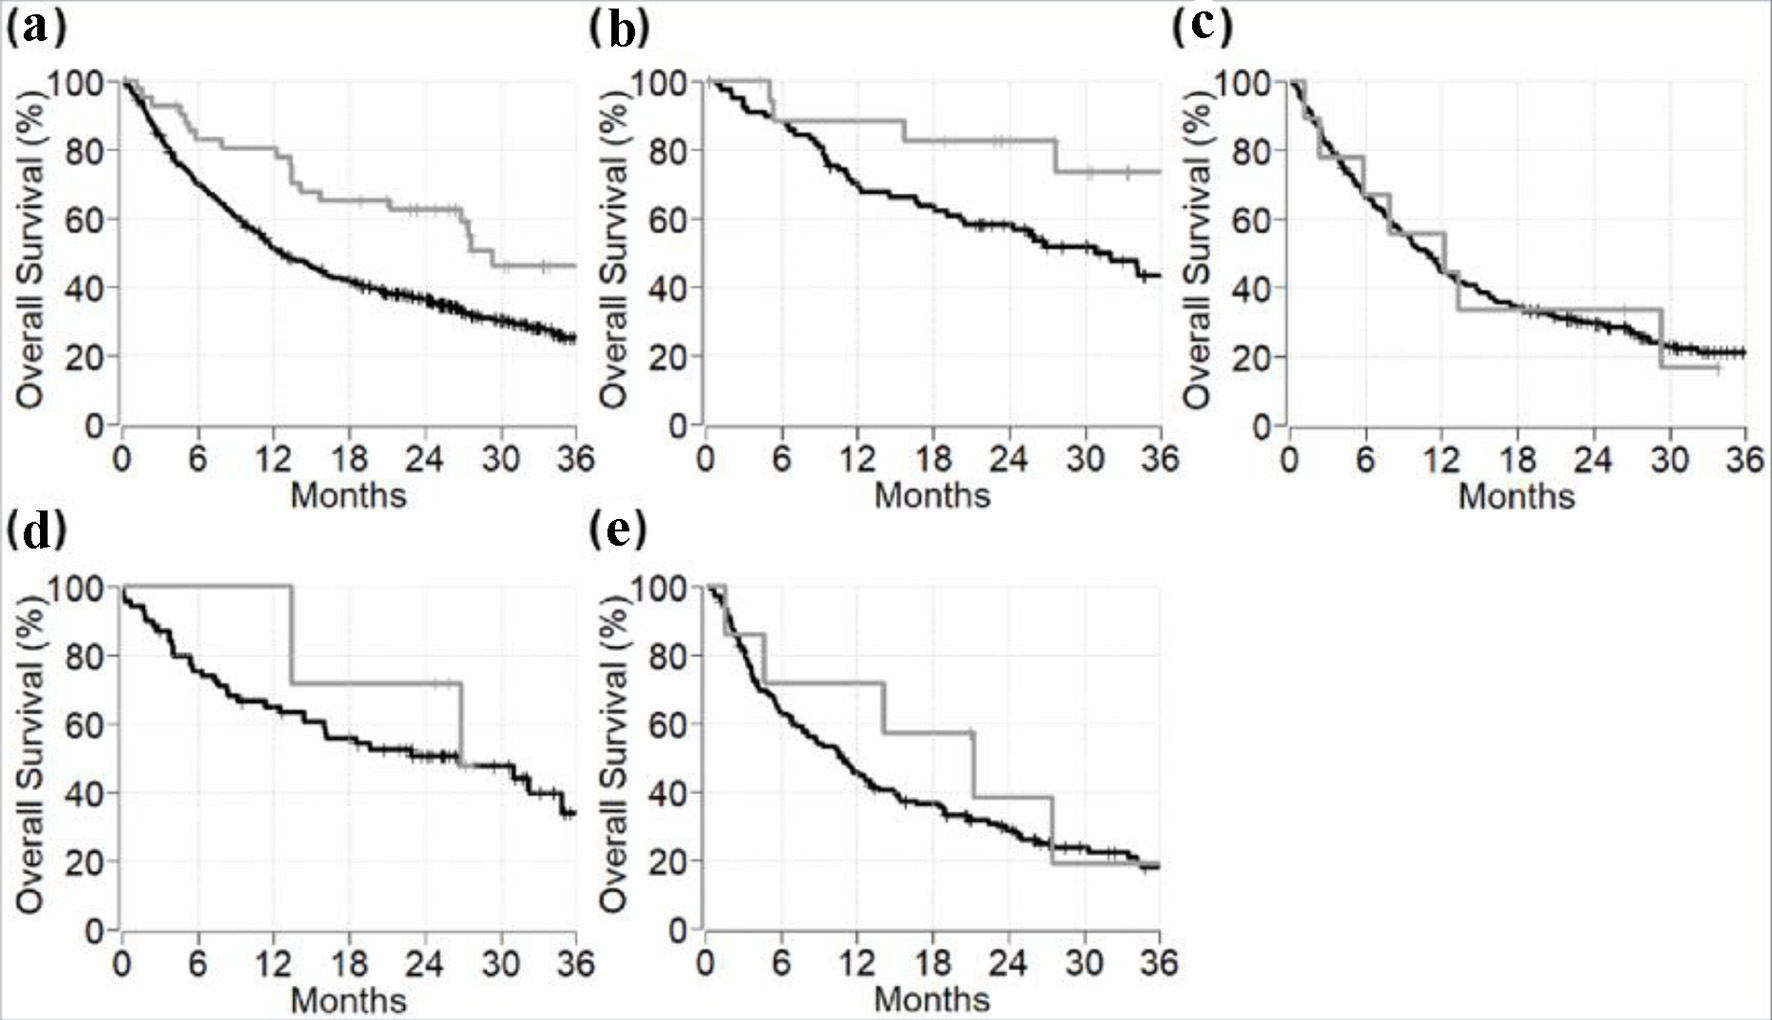
| All patients | 0.528 (0.331 - 0.844) | 0.008 |
| Cancer subtypes | ||
| Melanoma | 0.339 (0.119 - 0.962) | 0.042 |
| Lung cancer | 1.072 (0.519 - 2.212) | 0.85 |
| Renal cell carcinoma | 0.665 (0.202 - 2.185) | 0.50 |
| All other cancers | 0.656 (0.240 - 1.793) | 0.41 |