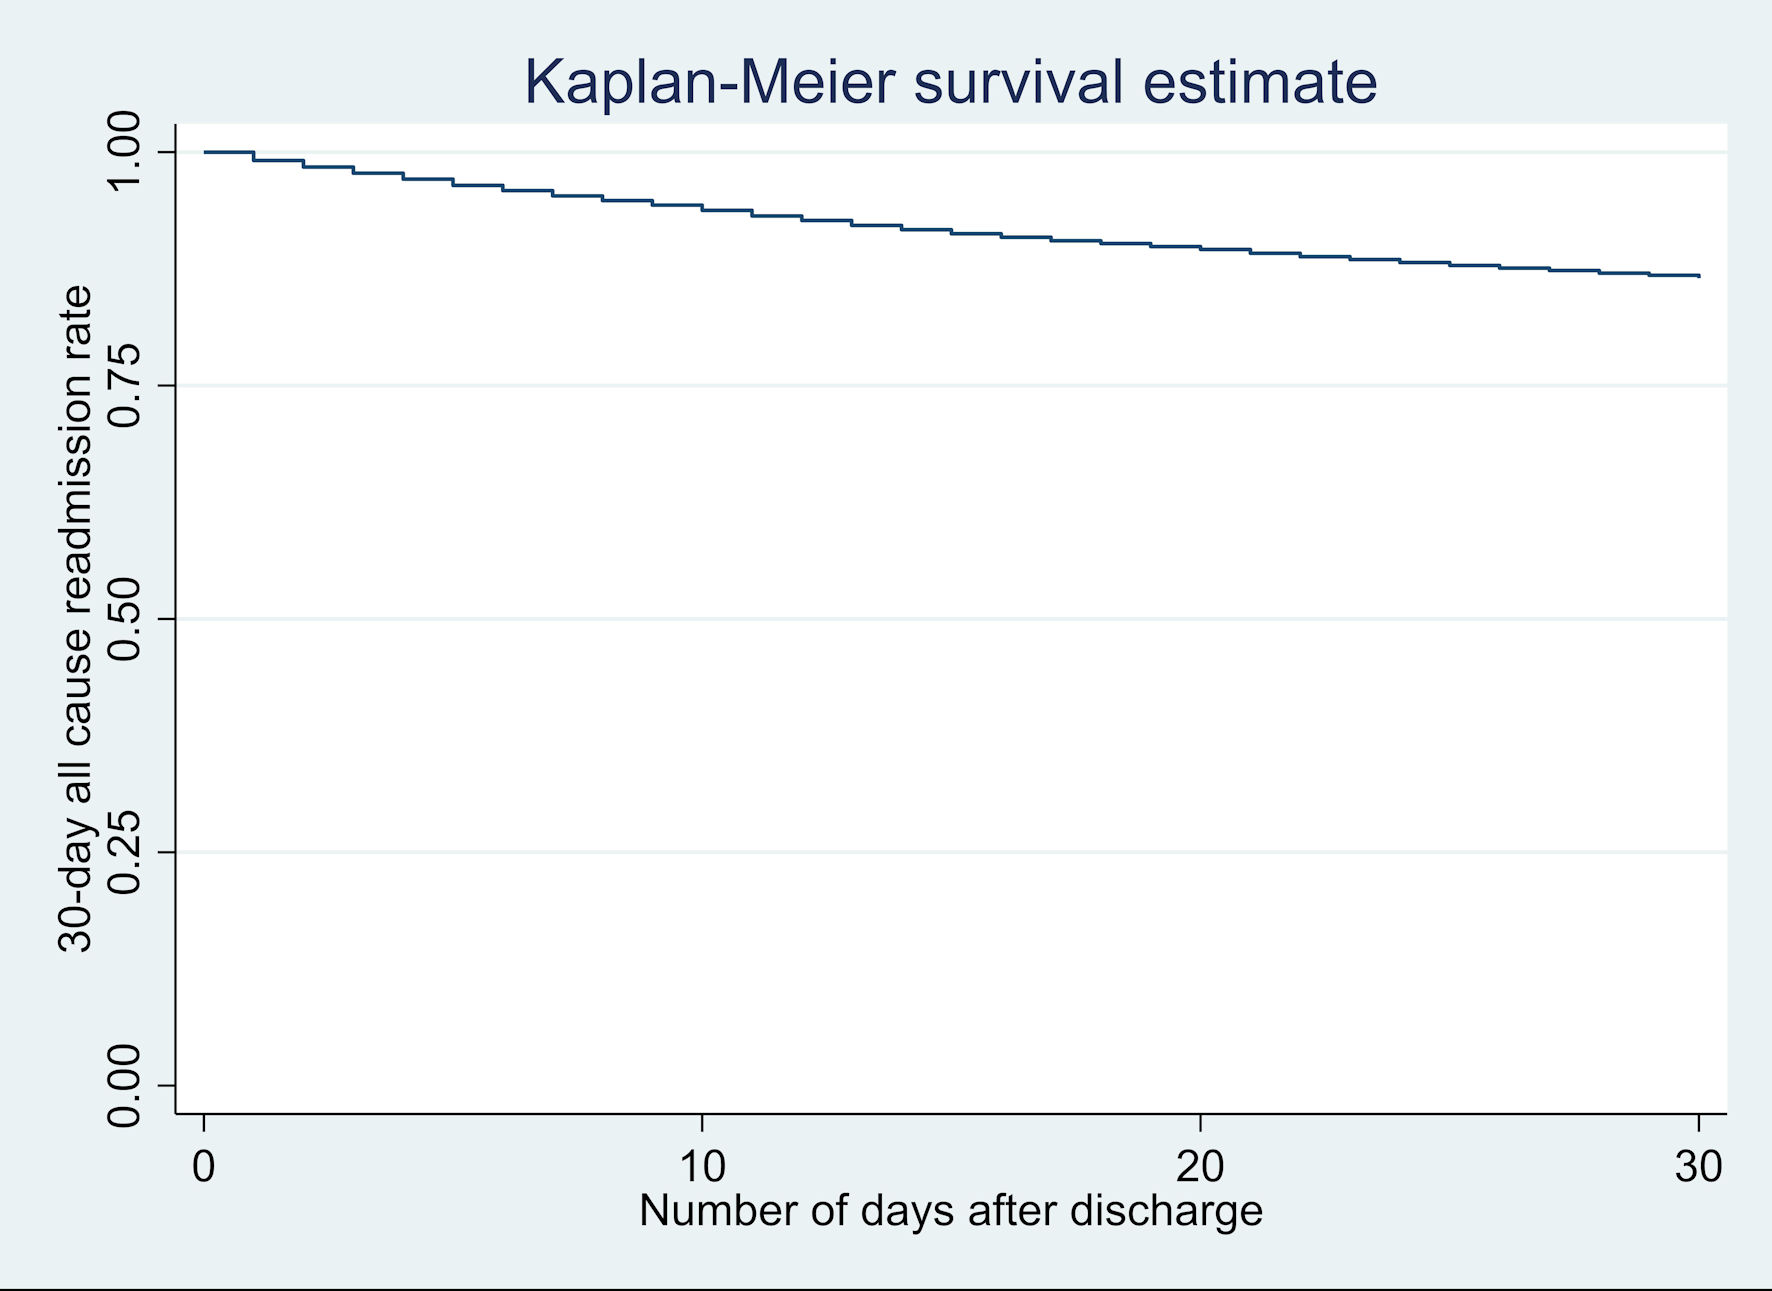
Figure 1. Kaplan-Meier graph for 30-day all-cause readmissions of hypertriglyceridemia-induced acute pancreatitis (HTG-AP) in the USA in 2018.
| Gastroenterology Research, ISSN 1918-2805 print, 1918-2813 online, Open Access |
| Article copyright, the authors; Journal compilation copyright, Gastroenterol Res and Elmer Press Inc |
| Journal website https://www.gastrores.org |
Original Article
Volume 15, Number 1, February 2022, pages 19-25
Clinical Outcomes and Predictors of Thirty-Day Readmissions of Hypertriglyceridemia-Induced Acute Pancreatitis
Figure
Tables
| Principal readmission diagnosis (n = 5,773) | Proportion (%) |
|---|---|
| Acute pancreatitis | 45.2 |
| Chronic pancreatitis | 6.3 |
| Sepsis (unspecified organism) | 4.8 |
| Acute renal failure | 1.6 |
| Malignant neoplasm of head of pancreas | 1.1 |
| Type 2 diabetes mellitus with ketoacidosis | 1.0 |
| Pneumonia (unspecified organism) | 0.9 |
| Hypertensive heart disease with heart failure | 0.7 |
| Non-ST elevation myocardial infarction | 0.7 |
| Index admission of HTG-AP | 30-day readmission of HTG-AP | P value | |
|---|---|---|---|
| Total hospitalizations | 43,094 | 5,773 | |
| Mean age (years) | 57.2 | 57.3 | 0.914 |
| Gender (%) | 0.667 | ||
| Females | 45.3 | 44.9 | |
| Males | 54.7 | 55.1 | |
| Charlson comorbidity index score (%) | < 0.001 | ||
| 1 | 25.6 | 18.4 | |
| 2 | 40.6 | 33.1 | |
| ≥ 3 | 33.8 | 48.5 | |
| Insurance type (%) | < 0.001 | ||
| Medicaid | 44.9 | 51.2 | |
| Medicare | 17.0 | 20.0 | |
| Private | 33.2 | 24.4 | |
| Uninsured | 4.9 | 4.4 | |
| Median annual income, $, (%) | < 0.001 | ||
| 1 - 43,999 | 30.5 | 33.9 | |
| 44,000 - 55,999 | 29.5 | 28.9 | |
| 56,000 - 73,999 | 24.3 | 22.7 | |
| ≥ 74,000 | 15.7 | 14.5 | |
| Comorbidities | |||
| Diabetes mellitus | 55.3 | 53.6 | 0.070 |
| Hypertension | 56.6 | 50.3 | < 0.001 |
| Smoking history | 25.0 | 25.5 | 0.560 |
| Congestive heart failure | 9.3 | 14.3 | < 0.001 |
| Chronic kidney disease | 15.5 | 20.8 | < 0.001 |
| Obesity | 26.5 | 21.6 | < 0.001 |
| Coronary artery disease | 22.3 | 27.0 | < 0.001 |
| Prior cerebrovascular accident | 1.2 | 1.9 | < 0.001 |
| Malnutrition | 4.9 | 13.2 | < 0.001 |
| Chronic obstructive pulmonary disease | 12.3 | 16.0 | < 0.001 |
| Hospital characteristics | < 0.001 | ||
| Hospital bed size (%) | |||
| Small | 21.3 | 17.5 | |
| Medium | 28.2 | 26.1 | |
| Large | 50.5 | 56.4 | |
| Metropolitan location (%) | 75.8 | 78.9 | |
| Teaching hospital (%) | 63.8 | 70.4 |
| Outcomes | Index admission of HTG-AP | 30-day readmission of HTG-AP | aOR (95% CI) | P value |
|---|---|---|---|---|
| aMean difference. aOR: adjusted odds ratio; CI: confidence interval. | ||||
| Inpatient mortality (%) | 0.7 | 1.7 | 2.55 (1.83 - 3.57) | < 0.001 |
| Mean length of stay (days) | 4.1 | 5.6 | 1.5a (1.2 - 1.7) | < 0.001 |
| Mean total hospital charge ($) | 36,078 | 56,779 | 18,702a (15,136 - 22,267) | < 0.001 |
| Variable | aHR | 95% CI | P value |
|---|---|---|---|
| aHR: adjusted hazard ratio; CI: confidence interval. | |||
| Protein energy malnutrition | 1.96 | 1.68 - 2.28 | < 0.001 |
| Discharge against medical advice | 1.80 | 1.44 - 2.24 | < 0.001 |
| Charlson comorbidity index score ≥ 3 | 1.80 | 1.53 - 2.11 | < 0.001 |
| Chronic kidney disease | 1.29 | 1.11 - 1.49 | 0.001 |
| Hypertension | 1.12 | 1.01 - 1.26 | 0.041 |
| Age | 0.99 | 0.98 - 0.99 | < 0.001 |
| Obesity | 0.83 | 0.74 - 0.93 | 0.001 |