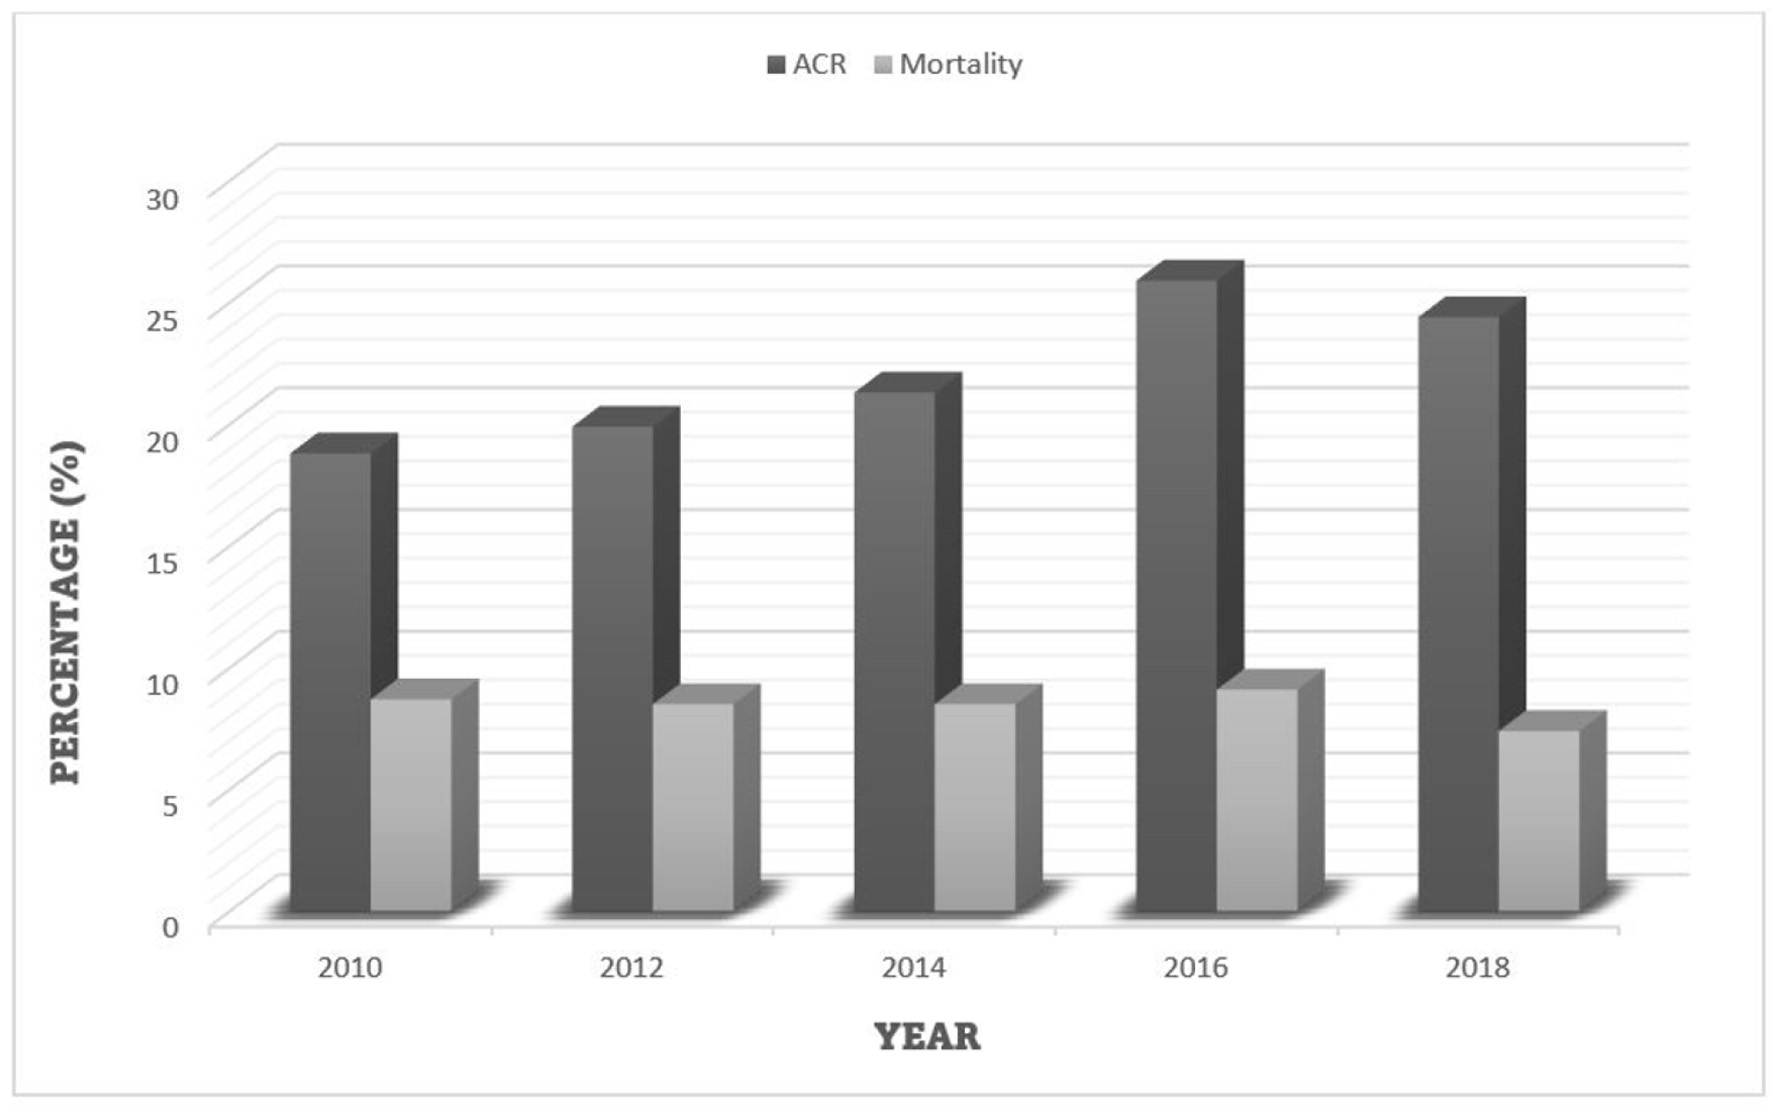
Figure 1. Trend of ACR and inpatient mortality for 30-day readmission of alcoholic hepatitis. ACR: all-cause readmission.
| Gastroenterology Research, ISSN 1918-2805 print, 1918-2813 online, Open Access |
| Article copyright, the authors; Journal compilation copyright, Gastroenterol Res and Elmer Press Inc |
| Journal website https://www.gastrores.org |
Original Article
Volume 14, Number 6, December 2021, pages 334-339
Declining Inpatient Mortality Despite Increasing Thirty-Day Readmissions of Alcoholic Hepatitis in the United States From 2010 to 2018
Figure
Tables
| Variables | Year | ||||
|---|---|---|---|---|---|
| 2010 | 2012 | 2014 | 2016 | 2018 | |
| Number of readmissions within 30 days | 1,839 | 2,227 | 2,716 | 3,503 | 3,784 |
| Mean age (years) | 46.8 ± 0.9 | 46.4 ± 0.8 | 46.4 ± 0.7 | 45.9 ± 0.6 | 46.1 ± 0.5 |
| Males (%) | 58.1 | 53.4 | 57.2 | 56.7 | 54.4 |
| Charlson Comorbidity Index score (%) | |||||
| 0 | 23.3 | 23.6 | 21.5 | 5.4 | 5.6 |
| 1 | 24.6 | 23.5 | 18.0 | 26.8 | 27.0 |
| 2 | 6.3 | 5.8 | 6.7 | 10.0 | 10.1 |
| ≥ 3 | 45.8 | 47.1 | 53.8 | 57.8 | 57.3 |
| Insurance type (%) | |||||
| Medicare | 14.9 | 13.6 | 15.5 | 15.2 | 15.5 |
| Medicaid | 37.7 | 35.4 | 41.8 | 43.7 | 41.2 |
| Private | 29.2 | 33.3 | 29.3 | 29.8 | 30.6 |
| Uninsured | 18.2 | 17.7 | 13.4 | 11.3 | 12.7 |
| Household income quartile (%) | |||||
| 1 | 28.8 | 29.6 | 26.4 | 25.9 | 26.9 |
| 2 | 23.7 | 24.5 | 27.6 | 26.7 | 27.5 |
| 3 | 25.6 | 23.5 | 23.8 | 26.3 | 26.7 |
| 4 | 21.9 | 22.4 | 22.2 | 21.1 | 19.0 |
| Hospital characteristics | |||||
| Hospital bed size (%) | |||||
| Small | 13.2 | 12.1 | 17.2 | 14.2 | 15.8 |
| Medium | 21.0 | 25.6 | 28.3 | 27.3 | 27.8 |
| Large | 65.8 | 62.3 | 54.5 | 58.5 | 56.4 |
| Teaching status (%) | |||||
| Metropolitan non-teaching | 42.3 | 34.4 | 23.0 | 24.5 | 19.4 |
| Metropolitan teaching | 50.3 | 57.1 | 72.0 | 70.1 | 75.1 |
| Non-metropolitan | 7.4 | 8.5 | 5.0 | 5.4 | 5.5 |
| Hospital volume quintiles (%) | |||||
| Q1 | 5.2 | 3.1 | 4.7 | 3.1 | 3.5 |
| Q2 | 6.2 | 6.9 | 5.6 | 7.3 | 7.6 |
| Q3 | 10.8 | 12.7 | 11.5 | 11.3 | 10.9 |
| Q4 | 20.3 | 19.8 | 19.9 | 21.0 | 20.4 |
| Q5 | 57.5 | 57.5 | 58.3 | 57.3 | 57.6 |
| Outcome | Year | P-trend | ||||
|---|---|---|---|---|---|---|
| 2010 | 2012 | 2014 | 2016 | 2018 | ||
| All-cause readmission rate (%) | 18.8 | 19.9 | 21.3 | 25.9 | 24.4 | 0.107 |
| Alcoholic hepatitis-specific readmission rate (%) | 2.9 | 3.0 | 2.9 | 3.7 | 3.9 | 0.546 |
| Alcoholic hepatitis readmission proportion (%) | 18.6 | 18.0 | 16.6 | 18.1 | 20.0 | 0.402 |
| Inpatient mortality (%) | 8.7 | 8.5 | 8.5 | 9.1 | 7.4 | 0.022 |
| Mean length of stay (days) | 6.1 | 6.0 | 6.1 | 6.7 | 6.7 | 0.822 |
| Mean total hospital cost ($) | 14,285 | 12,952 | 13,331 | 16,456 | 17,227 | 0.306 |